Health Metrics Explained: Body Temperature and Health Signals
Explaining body temperature and what changes can signal.
Explaining body temperature and what changes can signal.
In the quiet hum of the digital age, health has become a language of data. We count steps, measure heartbeats, and track sleep cycles, translating the whispers of our bodies into numbers on a screen. But among these vital signs, one stands as a primal and profoundly informative metric: your body temperature. It’s not merely a gauge for fever; it’s a continuous, dynamic narrative of your inner workings—a story of metabolism, circadian rhythm, stress, recovery, and hormonal symphony.
For centuries, a quick touch to the forehead was the primary diagnostic tool. Today, technology like smart rings is rewriting this story, offering a 24/7, non-invasive window into your core temperature trends. This is about moving beyond the singular, alarming spike of illness to understand the subtle, daily fluctuations that speak volumes about your overall wellness, fitness readiness, and even fertility.
This deep dive is your guide to decoding that narrative. We’ll peel back the layers on why body temperature is a cornerstone health metric, how modern devices track it with astonishing precision, and what those tiny variations truly mean for your energy, performance, and long-term health. By the end, you won’t just see a number; you’ll understand a fundamental dialogue between your body and your life.

Imagine your body as a complex, precision-engineered ecosystem. For every enzyme reaction, neural transmission, and cellular repair process to function optimally, the internal environment must be held within a remarkably narrow window. Your body temperature is the masterful regulation of that environment. It is not a passive reading but an active, energy-intensive achievement.
At its core, body temperature reflects the balance between heat production and heat loss. Heat is generated as a byproduct of your basal metabolism—the energy required to keep you alive at rest—and is amplified by muscle activity, digestion, and hormonal processes. This heat is dissipated through your skin, breath, and sweat. Your hypothalamus, a tiny region in your brain, acts as a supreme thermostat, constantly receiving signals from temperature receptors throughout your body and orchestrating responses: shivering to generate heat, vasodilation to cool down.
Why does this matter for everyday wellness? Because this balancing act is intimately tied to everything else.
Traditional spot-check methods with oral, ear, or forehead thermometers capture a single moment in this ongoing story—often only when you suspect a problem. The revolution lies in continuous core temperature monitoring, which reveals the plot, the character arcs, and the subtle themes. Devices like the Oxyzen smart ring, worn on the finger where a rich supply of blood vessels passes close to the skin, can estimate this core temperature trend seamlessly throughout the day and night, painting a complete picture of your body’s silent rhythm. For a deeper look at how this technology transforms personal health insight, you can explore the science behind Oxyzen’s sensors.
When we think "body temperature," 98.6°F (37°C) is the ingrained standard. However, this century-old average is misleading. Normal temperature is a range, and more importantly, a personal pattern. With continuous data, we move from a static number to a dynamic vocabulary.
This new vocabulary allows for proactive, rather than reactive, health management. Instead of waiting for a fever, you can observe a gradual elevation in your baseline over a few days, suggesting your body is under increased strain—perhaps from an oncoming illness, overtraining, or sustained stress. You can see if your lifestyle choices, like evening workouts or caffeine timing, are disrupting your natural cooling process at night. To see how users apply these insights in their daily lives, real-world testimonials offer powerful examples.
Understanding this language is the first step. The next is mastering how to track it accurately and consistently.
The journey to measure the body’s heat is a fascinating tale of scientific ingenuity. It began with rudimentary thermoscopes in the Renaissance and evolved into Gabriel Fahrenheit’s mercury-in-glass thermometer in the early 18th century. The clinical thermometer, with its narrow constriction to hold the reading, became a medical staple by the late 19th century.
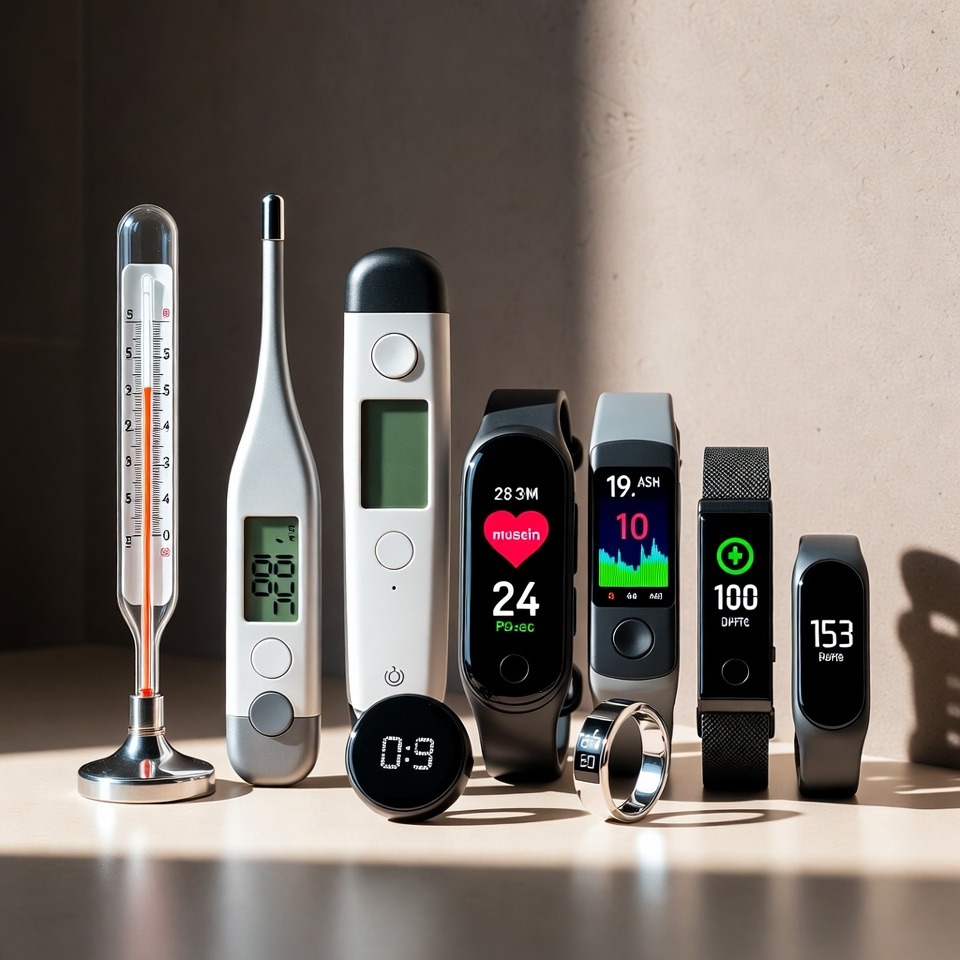
The late 20th century brought digital probes, infrared ear (tympanic) thermometers, and temporal artery scanners, improving speed and safety. However, all these methods shared a fundamental limitation: they were intermittent and situational. They provided a snapshot, missing the continuous narrative. They were also prone to user error and external influences (a cold room, a hot drink).
The paradigm shift arrived with wearable technology capable of continuous physiological monitoring. Wristwatches initially led the charge, but the wrist is not an ideal site for core temperature estimation due to its distance from the body’s trunk and susceptibility to ambient temperature swings.
The finger, however, is a different story. It hosts a high density of peripheral blood vessels, and its blood flow is closely regulated by the same autonomic nervous system that controls core temperature. This makes the finger pad an excellent proxy for estimating core temperature trends.
Modern smart rings, like the one developed by Oxyzen, leverage this principle. They house medical-grade sensors, including a high-sensitivity thermal sensor, in a sleek, comfortable form factor designed for 24/7 wear. Combined with accelerometers and optical sensors for heart rate and blood oxygen, the ring’s algorithm can filter out motion artifact and environmental noise to isolate the body’s true thermal signal.
This evolution—from a tool of acute diagnosis to one of chronic insight—represents a fundamental change in our relationship with our health data. It’s the difference between checking the weather once a day and having a live feed of the atmospheric pressure, humidity, and wind patterns that create the weather. For those curious about the journey to create such a device, the brand’s story reveals the mission behind the technology.

Your body temperature is not a flatline; it is a predictable, rhythmic wave that is one of the most robust outputs of your circadian system. This daily cycle is orchestrated by the suprachiasmatic nucleus (SCN) in your hypothalamus, which syncs with environmental light cues. Understanding your unique curve is key to optimizing your energy, sleep, and performance.
A textbook circadian temperature rhythm looks like this:
What Your Curve Tells You:
By observing how your lifestyle choices—light exposure, meal timing, exercise, and caffeine—affect this curve on your smart ring data, you gain the power to gently nudge your rhythm for better alignment and vitality. For more insights on aligning your habits with your biology, our blog is a dedicated resource for practical wellness strategies.
While the circadian rhythm provides the overarching structure, the hormone cortisol writes powerful edits into the daily script. Known as the primary "stress hormone," cortisol’s relationship with body temperature is direct and significant. In fact, tracking temperature can serve as a non-invasive proxy for understanding your stress physiology.
Cortisol is catabolic, meaning it breaks down resources (like glycogen and fat) to provide ready energy. This process generates heat. Under healthy conditions, cortisol follows its own diurnal rhythm: highest in the morning to help you wake up, gradually declining throughout the day, and reaching its lowest point at night to permit rest and recovery.
Acute Stress & Temperature: A sudden stressful event triggers a sympathetic nervous system ("fight-or-flight") response and a cortisol spike. This immediately increases heart rate, blood pressure, and body temperature. This is adaptive and short-lived.
Chronic Stress & Temperature: The problem arises with persistent, unresolved stress. Chronically elevated or dysregulated cortisol can manifest in your temperature data in several ways:
This is where continuous monitoring becomes a powerful biofeedback tool. You might notice that a difficult work meeting, a family conflict, or even excessive caffeine consumption correlates with a measurable temperature uptick. Over time, you can identify your personal stress triggers and, more importantly, validate the effectiveness of your stress-management techniques. Seeing your nighttime temperature dip more reliably after a week of meditation or evening walks provides concrete, motivating feedback that you’re positively influencing your nervous system.

Sleep is not a passive state; it’s an active, cooling-down process. The initiation of sleep is tightly coupled to a drop in core temperature. This thermoregulatory change is facilitated by the evening rise in melatonin, which promotes vasodilation in the extremities (hands and feet), releasing heat from the body’s core to the environment.
Therefore, your nighttime temperature profile is one of the most honest metrics for sleep quality and recovery. Let’s break down what a healthy recovery night looks like thermally:
Red Flags in Your Nightly Temperature Data:
By optimizing your sleep environment and habits for thermal regulation—keeping your bedroom cool (65-68°F or 18-20°C is ideal), using breathable bedding, avoiding alcohol and large meals before bed—you can directly improve the architecture of your sleep as reflected in your temperature data. It turns abstract advice into a visible, trackable science.
Your basal metabolic rate (BMR)—the calories your body burns at complete rest to maintain vital functions—is intrinsically linked to heat production. Thermogenesis (heat creation) accounts for a significant portion of your daily energy expenditure. Consequently, shifts in your metabolic health can often be observed through the lens of body temperature.
It’s crucial to state that body temperature is one of many metabolic signals and should be interpreted cautiously and in context. However, when combined with other data from a smart ring—like resting heart rate and heart rate variability (HRV)—it adds a valuable dimension to understanding how your lifestyle fuels your body’s fundamental energy systems. For a comprehensive understanding of how these metrics work together, our FAQ section addresses common questions on data interpretation.
For decades, women using fertility awareness methods have relied on tracking Basal Body Temperature (BBT)—the body’s temperature at complete rest. The principle is hormonally straightforward: estrogen, dominant in the follicular phase (pre-ovulation), has a cooling effect. After ovulation, the corpus luteum releases progesterone, which is thermogenic, causing a sustained temperature rise of about 0.4°F to 1.0°F (0.2°C to 0.5°C) throughout the luteal phase.
Traditional BBT tracking required taking an oral temperature with a specialized, highly accurate thermometer immediately upon waking, before any movement or talking. This method was prone to error, disruption, and only provided a single daily data point.
Continuous temperature sensing from a wearable device revolutionizes this practice:
This application of technology empowers family planning, whether the goal is conception or natural contraception (when used with a certified method and instructor). It transforms a sometimes-frustrating charting exercise into a seamless, data-rich understanding of a fundamental female health cycle.
The fever response is one of evolution’s oldest defense mechanisms. By raising the body’s thermostat, it enhances immune cell activity, inhibits pathogen replication, and speeds up tissue repair. Continuous temperature monitoring transforms this blunt instrument into a sensitive early-warning radar.
Here’s how the data can unfold during an immune challenge:
This predictive potential is powerful. Noticing a two-day upward trend in your temperature might prompt you to hydrate more, prioritize sleep, reduce stress, and boost nutrients—potentially mitigating the severity of an oncoming cold or flu. In a broader sense, a consistently stable temperature baseline is a positive indicator of robust immune resilience.
You now understand the profound language of body temperature—its rhythms, its responses, and its signals. But the true power lies not in mere observation, but in intelligent interpretation and action. Your personal temperature profile is a unique biometric fingerprint. Learning to read it in the context of your own life transforms raw data into a personalized blueprint for better health.
The first and most critical step is establishing your baseline. This isn’t a one-day task. Wear your tracking device consistently for at least two weeks during a period of relative normalcy—no major illness, travel, or extreme stress. From this data, you can identify:
With this baseline established, you can begin contextual analysis. This is where you move from "what" to "why." Every day, make brief notes on factors known to influence temperature:
After a few weeks, patterns will emerge. You may see that a late evening HIIT workout consistently blunts your nighttime temperature drop, leading to poorer sleep. You might discover that alcohol, even just one drink, causes a sharp nocturnal temperature rise. Perhaps you’ll see that your temperature rhythm is phase-delayed, explaining your morning fatigue.
The goal is not to become obsessed with every tiny fluctuation but to identify meaningful deviations from your norm. A single high reading is noise. A sustained elevation of 0.5°F above your baseline for 48 hours is a signal worth investigating. By correlating these deviations with your lifestyle log, you gain actionable insight. This self-awareness is the cornerstone of biohacking—making informed, incremental changes to optimize your biology. For those ready to start this journey of discovery, learning more about a dedicated tracking tool is the first step.
Armed with the ability to interpret your temperature data, you can now enter a powerful feedback loop. Your body’s thermal response becomes a real-time report card on your lifestyle choices, allowing you to experiment and optimize with precision. Here’s how to apply this across key life domains.
1. Sleep Optimization: Use your nighttime temperature curve as your ultimate sleep coach.
2. Training & Recovery: Temperature is a superb marker of training load and readiness.
3. Stress Management: Use your temperature as a biofeedback anchor.
4. Circadian Alignment: Reinforce your natural rhythm.
This iterative process of action, measurement, and adjustment turns wellness from a set of generic rules into a custom-tailored protocol. It’s the essence of what it means to be an active participant in your own health. For a deeper dive into specific optimization techniques, our blog features ongoing research and user case studies.
We stand on the brink of a paradigm shift, where continuous physiological monitoring transitions from descriptive to predictive and prescriptive. Body temperature, as a foundational vital sign, is poised to play a starring role in this future. The convergence of wearable technology, advanced algorithms, and big data analytics is unlocking possibilities that were once the domain of science fiction.
1. Predictive Health Analytics: The true frontier is not detecting illness, but forecasting risk. Machine learning models can analyze long-term temperature trends alongside other metrics (HRV, resting heart rate, activity) to identify subtle, pre-symptomatic patterns.
2. Fertility & Women’s Health Revolution: The future of fertility tracking is hyper-personalized and integrated.
3. Personalized Medication & Treatment Response: Temperature could become a biomarker for treatment efficacy.
4. Population Health & Early Detection: Anonymized, aggregated data from millions of users could serve as a global early-warning system for public health threats, detecting unusual fever clusters in real-time.
This future hinges on robust, medical-grade data collection and ethical, privacy-first AI. It represents a move from healthcare that is reactive and generalized to one that is proactive, preventive, and deeply personal. It aligns perfectly with the vision of companies like Oxyzen, which aim to put this level of insight directly into the hands of individuals. To understand the philosophy driving this future, you can learn more about the mission and values behind these advancements.
Our journey through the intricate world of body temperature reveals a fundamental truth: this ancient vital sign is a modern powerhouse of insight. We’ve moved far beyond the simple concept of fever. Your temperature is a continuous, dynamic readout of your metabolic engine, your circadian symphony, your stress response, your sleep quality, and your reproductive health. It is the silent conductor of your inner ecosystem, and for the first time in history, technology allows us to listen to its performance in real-time.
We’ve explored how the evolution from mercury thermometers to sleek smart rings has unlocked this 24/7 narrative. We’ve learned to decode the daily rhythm of peaks and troughs, understanding that a robust, high-amplitude curve is a hallmark of vitality, while a flattened wave whispers of disruption. We’ve seen how stress writes its signature in elevated nights, how sleep depends on a successful cooldown, and how metabolism and fertility leave clear thermal imprints.
Most importantly, we’ve transitioned from passive observation to active interpretation and optimization. By establishing your personal baseline and contextualizing fluctuations with your lifestyle, you transform data into a powerful feedback loop. You become the scientist of your own wellbeing, experimenting with sleep hygiene, training load, stress management, and circadian habits, using your body’s thermal response as your guide.
This knowledge empowers you to spot the early signs of imbalance, to validate what works for your unique biology, and to move from generic health advice to a personalized protocol for resilience and performance. The future of this field—predictive, personalized, and integrated—is even more promising, pointing toward a new era of participatory medicine.
This understanding of core body temperature is just the beginning. It is one critical thread in the rich tapestry of physiological data. To fully grasp your health and performance, temperature must be woven together with other vital signals: the steady drum of your heart rate, the complex variability that speaks to your resilience in HRV, the oxygen saturation in your blood, and the architecture of your sleep stages.
In the next portion of this comprehensive guide, we will dive equally deep into these interconnected metrics. We’ll unravel the stories told by your beating heart, both at rest and under stress. We’ll decode the mysterious language of HRV, a profound indicator of your nervous system balance and recovery status. We’ll explore what your blood oxygen levels reveal about your respiratory health and circulatory efficiency. Finally, we’ll break down the stages of sleep—light, deep, and REM—to understand what true restoration looks like and how to achieve it consistently.
Together, these metrics form a complete picture of your bioenergetic state—your capacity to generate energy, manage stress, recover fully, and thrive. By mastering the interplay between temperature, cardiovascular function, and sleep, you’ll possess the ultimate toolkit for navigating modern life with resilience, vitality, and informed intention. The journey to truly knowing yourself continues.
If body temperature is the silent conductor of your inner ecosystem, then your cardiovascular system is the dynamic delivery network that keeps it all running. Its rhythms are the most immediate and visceral signs of life itself—from the steady thump at rest to the exhilarating surge during a sprint. But beyond the simple beat, lies a universe of data that speaks to your fitness, your stress, your recovery, and your long-term health resilience.
In this second portion of our deep dive into health metrics, we move from the thermal landscape to the pulsing cardiovascular one. We will explore two of the most insightful, yet often misunderstood, data points available from modern wearables: Resting Heart Rate (RHR) and Heart Rate Variability (HRV). Far more than just numbers on a screen, these metrics form a dialogue between your conscious life and your autonomic nervous system. They tell a story of adaptation, strain, and recovery. Understanding this story is key to unlocking not just longer life, but more vitality in every day.
Your Resting Heart Rate is precisely what it sounds like: the number of times your heart beats per minute (BPM) when you are completely at rest—awake but calm, ideally measured after a period of consistent sleep and before any physical exertion or caffeine. While the classic textbook "normal" range is 60-100 BPM, for adults who are not elite athletes, a RHR between 50 and 70 is generally indicative of good cardiovascular fitness.
Why RHR Matters: The Efficiency Engine
A lower RHR is typically a marker of cardiovascular efficiency. Think of your heart as a pump. A strong, well-conditioned heart muscle (the left ventricle) can eject a larger volume of blood with each contraction (stroke volume). Therefore, it doesn’t need to beat as frequently to supply the body with the same amount of oxygenated blood. This efficiency reduces wear and tear on the entire system.
The Factors That Shape Your RHR:
Interpreting the Trends, Not the Snapshot
A single morning’s RHR reading is a data point. The true power lies in the trend. Tracking your RHR over weeks and months reveals your personal story.
When you see this elevation, it’s a cue from your body to prioritize rest, hydration, sleep, and stress management—not to push through with intense training or ignore self-care. It’s a foundational metric for any effective training program, preventing overtraining and illness. To see how users integrate this data into their daily routines for better recovery, check out these real-world experiences and testimonials.
While RHR is about the average space between beats, Heart Rate Variability is about the variation in the milliseconds between each successive heartbeat. This is not an arrhythmia; it is a sign of a healthy, responsive nervous system. Contrary to what one might assume, higher HRV is generally better. It indicates your body can readily adapt to stress and then recover.
The Autonomic Nervous System (ANS) Dialogue:
HRV is the ultimate window into the balance of your ANS, which has two primary branches:
A healthy system is dynamic. It ramps up the SNS to meet a challenge (a workout, a work deadline) and then efficiently engages the PNS to recover. High HRV reflects this flexibility—a strong parasympathetic tone that can quickly calm the system after a sympathetic surge.
What Influences Your HRV?
Like RHR, HRV is deeply personal. Comparing your number to someone else’s is meaningless. It’s your own trend that matters. Factors that lower HRV (increase stress load) include:
Factors that support higher HRV (promote recovery) include:
Using HRV for Daily Readiness & Recovery
This is where HRV becomes a practical, daily tool. By taking a consistent reading (first thing in the morning is ideal), you get a scorecard of your previous day’s stress and recovery.
Advanced users and athletes use this data for readiness-based training. Instead of following a rigid calendar plan, they let their HRV (alongside RHR and subjective feeling) guide the day's intensity. If HRV is high, they might push for a personal record. If it’s low, they might swap an intense interval session for light aerobic activity, yoga, or complete rest. This approach respects the body’s nonlinear recovery process and dramatically reduces the risk of injury and burnout. For a deeper exploration of how to apply these principles, our blog features detailed guides on recovery and readiness.
While powerful alone, RHR and HRV tell the most compelling story when viewed together. They offer a nuanced picture of your autonomic state.
By observing these patterns in your own data, you begin to see the direct impact of your lifestyle. You can validate that a weekend of relaxation truly lowered your RHR and raised your HRV. You can see the tangible cost of a poor night's sleep or one too many drinks. This biofeedback loop is transformative, turning abstract concepts of "balance" into concrete, observable physiology.
While heart rate tells us about the pump's activity, Blood Oxygen Saturation (SpO2) tells us about the cargo it's delivering. This metric measures the percentage of hemoglobin in your blood that is carrying oxygen. At sea level, a normal SpO2 level is typically between 95% and 100%.
Why SpO2 is a Crucial Vital Sign:
Oxygen is the fundamental currency for cellular energy production (ATP). Without adequate oxygen delivery, every system in your body—from your brain to your muscles—functions sub-optimally.
Continuous vs. Spot-Check Monitoring:
Traditional pulse oximeters are spot-check devices. The value of a wearable smart ring is its ability to monitor SpO2 continuously, especially during sleep. This is critical because many breathing disturbances occur only during sleep when you’re not consciously aware of them.
A sleep SpO2 report can reveal:
While not a diagnostic medical device, consistent patterns of low overnight SpO2 (e.g., frequent drops below 90%) are valuable information to bring to a healthcare professional for further evaluation. It transforms a subjective feeling of "unrefreshing sleep" into an objective data point. Understanding the full suite of metrics a device tracks is key; for a complete breakdown, you can visit our comprehensive FAQ page.
Sleep is not a monolithic state of unconsciousness. It is a complex, cyclical architecture of distinct brainwave patterns and physiological states, each with a unique restorative purpose. Modern sleep tracking via wearables uses a combination of heart rate, HRV, movement, and sometimes temperature and SpO2 to estimate these stages.
The Four Stages of Sleep:
The Sleep Cycle: You progress through these stages in cycles of about 90-120 minutes, repeating 4-6 times per night. Early cycles are rich in deep sleep, while later cycles contain more REM sleep.
What Your Sleep Data Reveals:
By understanding your sleep stages, you can move beyond just tracking hours in bed. You can see if your lifestyle is truly supporting the quality of restoration your brain and body need. This knowledge, combined with your temperature, cardiovascular, and oxygen data, completes a holistic picture of your overnight recovery. To learn more about the journey to create technology that seamlessly integrates these insights, discover the story behind our development.
A Seamlessly Integrated Picture
We have now journeyed through the thermal landscape of your body and the pulsing rhythms of your heart and breath. We've seen how temperature orchestrates your daily rhythm, how RHR and HRV conduct the symphony of stress and recovery, how SpO2 ensures the vital cargo is delivered, and how sleep architecture provides the necessary downtime for repair.
But these metrics do not exist in isolation. They are threads in a single, interconnected tapestry of well-being. A stressful day (lower HRV) can lead to poor sleep (disrupted architecture and higher nocturnal temperature), resulting in a higher morning RHR and lower readiness. Conversely, a day of good recovery (high HRV) supported by excellent sleep (deep cooling and ample deep sleep) sets the stage for a low RHR, a strong temperature rhythm, and high energy.
This is the ultimate power of a multi-sensor device like a smart ring: it weaves these threads together automatically. It doesn't just tell you your heart rate; it tells you what your heart rate means in the context of your sleep, your stress, and your temperature. It provides a Bio-Readiness Score or Recovery Index that synthesizes this complex physiological dialogue into a simple, actionable morning insight.
In the final portion of this guide, we will bring it all home. We will explore how to synthesize this multi-metric data into a coherent daily practice. We’ll discuss creating personalized health protocols, setting meaningful goals, and navigating the common pitfalls of health tracking. We’ll look at the future of personalized health AI and how you can use this knowledge not for obsession, but for empowerment—to live with more energy, resilience, and intention.
The goal is not to become a slave to the data, but to use it as a compassionate guide to a deeper understanding of your one and only body.
We have journeyed through the intricate worlds of thermoregulation and cardiovascular dynamics, unpacking the profound stories told by body temperature, heart rate variability, blood oxygen, and sleep architecture. These are not isolated data streams; they are vital instruments in a single, grand orchestra of your physiology. The true power of modern health tracking lies not in observing each instrument alone, but in listening to the symphony they create together. This synthesis is where data transforms into wisdom and insight becomes actionable intelligence.
Understanding how these metrics interact is the key to moving from fragmented numbers to a holistic view of your well-being. It’s the difference between checking the weather in three different cities and seeing a full meteorological map of a storm system. Let’s explore the critical interplay between these systems and how their combined narrative provides the most accurate picture of your health and readiness.
Your body’s systems are in constant, dynamic conversation. A change in one triggers a cascade of responses in others. Here are the most powerful interconnected relationships:
1. The Sleep-Stress-Temperature Triad:
This is perhaps the most fundamental loop. As we’ve established, sleep initiation requires a core temperature drop. This drop is facilitated by the parasympathetic nervous system (PNS), which is also reflected in a higher HRV. Therefore, high evening HRV supports the cooling process, leading to better sleep onset and quality.
2. The Recovery-Readiness Feedback Loop:
This loop is central for athletes and anyone managing energy.
3. The Cardio-Respiratory Coupling:
Your heart and lungs are a partnered team.
By learning to read these correlations in your own data, you stop asking, “Why is my HRV low?” and start asking, “Was my HRV low because my sleep was poor, my temperature was high, my SpO2 was unstable, or a combination of all three?” This systemic view leads to more effective and targeted interventions. For a deeper exploration of how to interpret these interconnected patterns, our FAQ provides detailed guidance on data synthesis.
With an understanding of these interconnections, you can now build a personalized, daily health-check ritual. This isn’t about spending hours analyzing charts; it’s about developing a quick, insightful morning routine using your compiled data.
The 5-Minute Morning Review:
Building Personal Baselines and Ranges:
You cannot interpret deviations without knowing your norm. Spend a month or two observing your data during a period of stable, healthy living to establish:
With these baselines, you can set intelligent alerts. For example, you might note that an RHR 7 BPM above your average for two consecutive days, paired with a 15% drop in HRV, has historically preceded illness for you. This pattern becomes your personal early-warning system.
The pursuit of optimization can sometimes lead to its own form of stress: data obsession, or "orthosomnia" (the unhealthy preoccupation with perfect sleep data). It’s crucial to adopt a healthy philosophy around tracking.
The goal of tracking is to increase self-awareness and agency, not anxiety. It’s about building a kinder, more responsive relationship with your body, where you learn its language and respect its signals. To see how others have successfully integrated tracking into a balanced life, the stories and experiences of our community can be a great source of perspective.
We are on the cusp of the next revolution: moving from descriptive and even prescriptive analytics to truly predictive and personalized health intelligence. This future is powered by the synthesis of long-term multi-metric data and sophisticated artificial intelligence.
This is the direction of true wellness technology: a seamless, intelligent partner that helps you navigate your unique physiology to live with more vitality and resilience. It aligns with a vision of healthcare that is proactive, personalized, and participatory. To understand the principles guiding this kind of innovation, you can learn more about the mission and vision driving our work.
This comprehensive exploration began with the subtle language of body temperature and expanded to include the dynamic rhythms of your heart, breath, and sleep. We’ve seen that these are not mere numbers, but chapters in the ongoing story of your body’s interaction with your life—your training, your stress, your nourishment, your rest.
The journey from data to wisdom follows a clear path:
You are not a passenger in your body. You are the co-pilot, with a newly installed dashboard that speaks its native language. This knowledge empowers you to navigate periods of stress with more grace, optimize your efforts for better results, and truly listen to what your body needs to thrive.
The ultimate goal is not a perfect score every day, but a profound and compassionate dialogue with yourself. It’s about using technology not to outsource your intuition, but to enhance it. To move from guessing about your health to knowing, from hoping you’re recovering to seeing the proof, and from applying generic advice to crafting a personalized protocol for your one, extraordinary life.
The story of your health is being written every second. Now, you have the tools to read it, understand it, and ultimately, become its most empowered author. For continued learning and to stay updated on the latest insights in personalized health, our blog is a dedicated resource for your journey.
Your Trusted Sleep Advocate: Sleep Foundation — https://www.sleepfoundation.org
Discover a digital archive of scholarly articles: NIH — https://www.ncbi.nlm.nih.gov/
39 million citations for biomedical literature :PubMed — https://pubmed.ncbi.nlm.nih.gov/
Experts at Harvard Health Publishing covering a variety of health topics — https://www.health.harvard.edu/blog/
Every life deserves world class care :Cleveland Clinic - https://my.clevelandclinic.org/health
Wearable technology and the future of predictive health monitoring :MIT Technology Review — https://www.technologyreview.com/
Dedicated to the well-being of all people and guided by science :World Health Organization — https://www.who.int/news-room/
Psychological science and knowledge to benefit society and improve lives. :APA — https://www.apa.org/monitor/
Cutting-edge insights on human longevity and peak performance:
Lifespan Research — https://www.lifespan.io/
Global authority on exercise physiology, sports performance, and human recovery:
American College of Sports Medicine — https://www.acsm.org/
Neuroscience-driven guidance for better focus, sleep, and mental clarity:
Stanford Human Performance Lab — https://humanperformance.stanford.edu/
Evidence-based psychology and mind–body wellness resources:
Mayo Clinic — https://www.mayoclinic.org/healthy-lifestyle/
Data-backed research on emotional wellbeing, stress biology, and resilience:
American Institute of Stress — https://www.stress.org/

