Health Metrics Explained: From Raw Data to Health Insights
Turning raw sensor data into meaningful health insights.
Turning raw sensor data into meaningful health insights.
In an age where we can track everything from our daily steps to our REM cycles, a fundamental question remains: what does it all mean? You wake up to a readiness score of 78, your smart ring notes a "slightly elevated" resting heart rate, and your sleep report flags "increased restlessness." The data is plentiful, but the insight—the actionable, personalized knowledge of what your body is telling you—can feel frustratingly out of reach.
We’ve moved beyond counting steps. Modern wellness technology, like advanced smart rings, captures a symphony of physiological signals: heart rate variability (HRV), skin temperature trends, blood oxygen saturation (SpO2), and more. This isn't just data for data's sake. This is the raw language of your autonomic nervous system, your metabolic health, and your body's silent response to stress, recovery, and illness. But without a translation, it's just noise.
This comprehensive guide is your translator. We will journey from the raw electrical signals and optical readings captured by sensors to the profound health insights they can unlock. We'll demystify the key health metrics, explain not just what they measure but why they matter, and show you how to move from passively observing numbers to actively engaging in a dialogue with your own body. For anyone using a smart ring like those from Oxyzen or simply curious about the biometric revolution, understanding this translation is the key to moving from tracked to transformed.
The fitness tracker of a decade ago was a pedometer with ambition. It told us to move more, and that was revolutionary for its time. Today, the landscape has shifted seismically. We are no longer just tracking activity; we are monitoring our body’s internal state—its readiness, its strain, its silent preparation for illness, and its journey toward recovery. This is the era of biometric monitoring, and it represents a fundamental shift from external activity metrics to internal status reports.
This shift is powered by two key developments. First, the miniaturization of clinical-grade sensors. Photoplethysmography (PPG) sensors that measure blood volume pulses, 3D accelerometers, skin temperature sensors, and bio-impedance sensors can now be elegantly housed in a device that fits on your finger. Second, and more critically, is the advancement in algorithms and machine learning. Raw sensor data is meaningless on its own. It is the sophisticated software that transforms a flickering light signal into a accurate heart rate, or a series of heartbeats into a calculation of Heart Rate Variability—a powerful marker of nervous system health.
The goal is no longer simply to log exercise. It is to answer deeper questions: Is my body ready to take on a hard workout today, or does it need rest? Was that social event more stressful for my system than I realized? Am I fighting off a virus before symptoms even appear? This proactive, preventative approach to health is the true promise of modern wearables. By understanding our biometric baselines, we can identify deviations that signal opportunity for optimization or early warning for intervention. As we explore on the Oxyzen blog, this isn't about fostering anxiety over numbers; it's about cultivating awareness and empowerment.
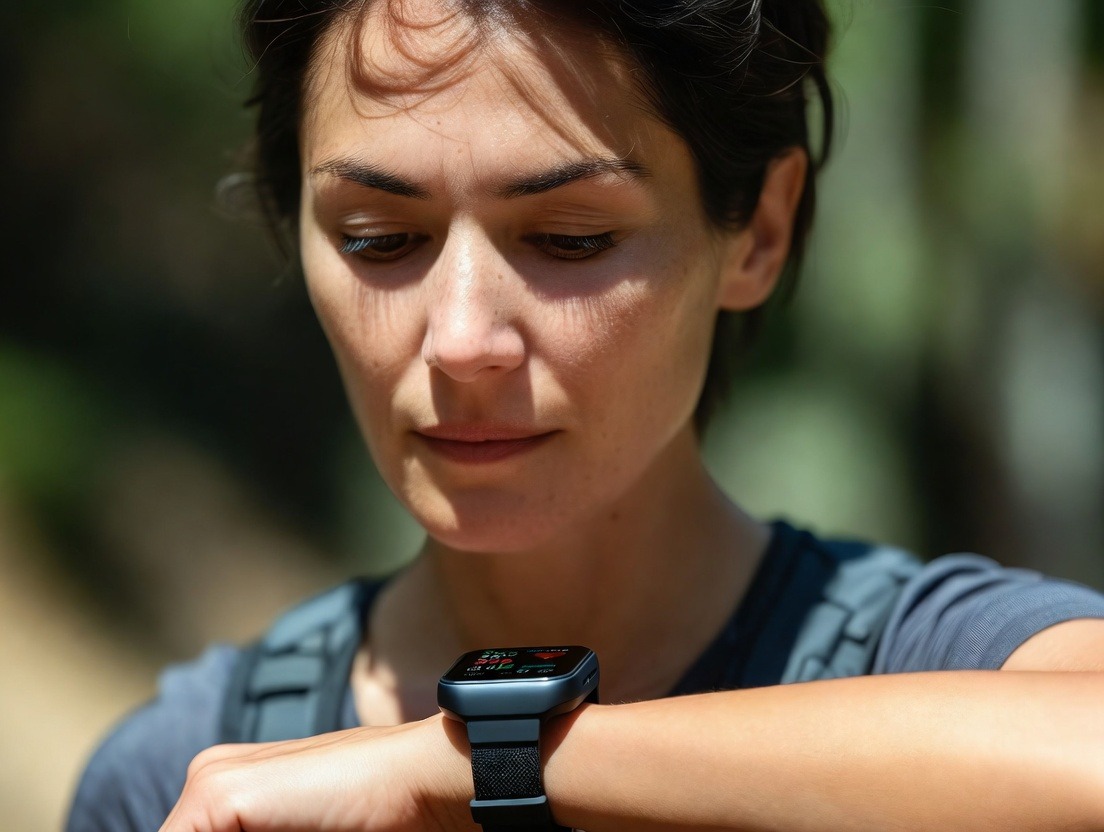
The smart ring has emerged as a particularly powerful form factor for this deep biometric monitoring. The finger provides a rich vascular bed for optical sensors, often yielding more consistent signals than the wrist, especially during sleep. The form factor is also unobtrusive, enabling 24/7 wear without the bulk of a watch, leading to continuous, uninterrupted data collection. This continuous data is the bedrock of insight, because our bodies tell their most honest stories not in the 30 minutes we're at the gym, but in the quiet hours of the night while we sleep.
To trust the insights, it helps to understand the journey of a single heartbeat from your body to your app. It begins with remarkable feats of engineering—tiny, powerful sensors acting as silent interpreters of your physiology.
The Optical Heart Rate Sensor (PPG): This is the workhorse. It emits a green (and sometimes red and infrared) LED light into the skin of your finger. Hemoglobin in your blood absorbs this light. As your heart beats, blood volume in the capillaries pulses. The sensor detects the minute changes in light reflection caused by these blood volume changes. This raw, flickering signal is a photoplethysmogram—a direct, optical measurement of your pulse wave. From this waveform, the device's algorithm can extract not just heart rate, but through subtle analysis of the wave's shape and timing, insights into blood pressure trends and even arterial stiffness.
The 3-Axis Accelerometer: This microscopic motion detector senses movement in all directions. Its raw data is a constant stream of acceleration values. This isn't just for counting steps. During the day, it distinguishes between walking, running, and sitting. At night, it becomes crucial for sleep staging. The absence of gross movement, combined with heart rate and HRV data, helps determine periods of deep sleep. Subtle movements indicate REM sleep. This sensor turns motion (or lack thereof) into a story about your activity and rest.
The Skin Temperature Sensor: Typically a negative temperature coefficient (NTC) thermistor, this sensor measures the heat radiating from your skin. The raw data is a simple resistance value that correlates precisely with temperature. But the magic isn't in a single reading; it's in the trend. Your core body temperature follows a circadian rhythm, dropping at night to initiate sleep and rising in the morning to promote wakefulness. A continuous temperature sensor tracks this rhythm. More importantly, a sustained elevation from your personal baseline is one of the earliest and most reliable signs of oncoming illness, inflammation, or, for women, ovulation.
The Blood Oxygen (SpO2) Sensor: This uses red and infrared LEDs. Oxygenated and deoxygenated hemoglobin absorb these wavelengths differently. By comparing the absorption of red and infrared light, the sensor's algorithm can calculate the percentage of hemoglobin saturated with oxygen. The raw data is a ratio of ratios, transformed into your SpO2 percentage. Consistent drops during sleep can signal sleep apnea, while changes in trends can reflect respiratory health.
All this raw data—light fluctuations, resistance values, acceleration vectors—is just noise. It is processed locally by the ring's chip using complex algorithms (like peak detection for heart rate, frequency analysis for HRV, and machine learning models for sleep staging) to create the clean, meaningful metrics you see in your app: 67 BPM, 42 ms HRV, 98% SpO2. This transformation from sensor signal to health metric is the first critical step. But the metric alone is still just a data point. The true insight comes from context, trends, and the interplay between these numbers—which is exactly what we'll explore next.

Your heart rate, or pulse, is the most immediate and intuitive vital sign. But in the context of continuous monitoring, it transforms from a simple number into a dynamic narrative of your daily life, stress, fitness, and recovery.
Resting Heart Rate (RHR): Your Body’s Idle Speed
Resting Heart Rate is measured when you are fully awake but completely at rest—typically first thing in the morning, before you get out of bed. It's the minimum number of beats per minute your heart needs to sustain your body's basic functions. A lower RHR generally indicates a more efficient cardiovascular system and higher aerobic fitness. For adults, a typical range is 60-100 BPM, but fit individuals often have RHRs in the 40s or 50s.
The power of RHR lies in its trend. Your day-to-day RHR is remarkably stable. Therefore, a sustained elevation of 5-10 BPM above your personal baseline is a massive red flag from your body. It is a classic sign of:
Tracking your RHR with a device like an Oxyzen smart ring gives you a daily check-in on your body's operational baseline. It answers the question: "Is my system running hot today?"
Heart Rate During Sleep: The Honest Story
While you are unconscious, social and mental influences fade away, and your heart rate reveals your pure physiological state. A normal, healthy sleep pattern shows a distinct heart rate curve: a gradual decrease as you enter deep sleep (the peak of physical recovery), variable rates during REM sleep (linked to brain activity), and a gentle rise toward morning as your body prepares to wake.
Deviations from this pattern are incredibly informative. A heart rate that doesn't drop sufficiently, or that spikes erratically throughout the night, can point to:
Heart Rate During Activity & Exercise: Measuring Effort
During exercise, heart rate becomes a direct measure of cardiovascular intensity. Beyond just tracking calories, understanding your heart rate zones (Zones 1-5, from very light to maximum effort) allows for targeted training. Are you in the fat-burning zone for a recovery jog, or pushing your anaerobic threshold for a performance gain?
Perhaps more important is Heart Rate Recovery (HRR)—how quickly your heart rate drops after you stop exercising. A fast drop (e.g., a decrease of 20+ BPM in the first minute) is a strong indicator of good cardiovascular fitness and autonomic nervous system health. A sluggish recovery can be a sign of fatigue, overtraining, or underlying cardiovascular issues.
In essence, your heart rate is a continuous, responsive rhythm section to the symphony of your day. It rises with emotion, effort, and stress, and falls with rest, relaxation, and recovery. Learning to listen to its patterns is the first lesson in biometric literacy.
If heart rate is the rhythm, Heart Rate Variability is the nuanced syncopation between the beats. It is arguably the most powerful and misunderstood metric in personal wellness monitoring.
What HRV Actually Is (And Isn't)
HRV is not an arrhythmia. It is the natural, millisecond-level variation in the time intervals between consecutive heartbeats (known as R-R intervals). If your heart beats at exactly 60 BPM, that would be one beat every 1000 milliseconds. But a healthy heart doesn't beat like a metronome. One interval might be 1010 ms, the next 990 ms, the next 1005 ms. This subtle variability is a very good thing.
HRV is a direct window into your autonomic nervous system (ANS), which has two primary branches:
A higher HRV generally indicates a stronger, more resilient parasympathetic tone and a body that is well-recovered, adaptable, and ready for stress. A lower HRV suggests dominant sympathetic activity, meaning your body is under strain—whether from physical training, psychological stress, illness, or poor sleep.
Interpreting Your HRV Score
Unlike heart rate, there is no "good" universal HRV number. It is highly personal, influenced by age, genetics, fitness, and lifestyle. A 25-year-old elite athlete might have an average HRV (using the common RMSSD measurement) of 80ms, while a healthy 50-year-old might average 40ms. Comparing your HRV to someone else's is meaningless. The only comparison that matters is your HRV against your own baseline.
This is where continuous tracking shines. By wearing a device 24/7, you establish your personal HRV range. The daily insights come from the trend and the daily deviations:
How to Use HRV for Daily Decision-Making
This is where data becomes action. Many modern systems, like the one you can explore with Oxyzen, synthesize HRV, RHR, sleep, and temperature into a single "Readiness" or "Recovery" score. But even on its own, HRV can guide your choices:
Think of HRV as your body's frank, internal conversation about its capacity. It tells you what your conscious mind might ignore: that you're still drained from Tuesday's workout, or that you handled Wednesday's work pressure better than you thought. Learning its language is a superpower for self-management.
Sleep is not a binary state of "on" or "off." It's a meticulously structured cycle of distinct stages, each with a critical physiological purpose. Understanding your sleep architecture—the nightly blueprint of light, deep, and REM sleep—is essential to moving beyond simple "8-hour" goals and into the realm of true sleep quality.
The Four Stages of Sleep:
A healthy sleep architecture cycles through these stages roughly every 90 minutes, repeating 4-6 times per night. The proportion of each stage matters more than absolute minutes.
How Wearables Estimate Sleep Stages:
Devices use a combination of sensors to estimate these stages:
Interpreting Your Sleep Data:
Instead of fixating on a single "sleep score," look at the components:
Tracking this architecture reveals the impact of your choices. That late-night glass of wine might help you fall asleep but it devastates your REM sleep. An intense evening workout can delay your body's temperature drop, pushing back deep sleep. By understanding your patterns, you can experiment with adjustments to your evening routine, environment, and schedule to engineer a better night. For a deeper dive into optimizing this process, our blog features numerous sleep science insights.
For centuries, a fever has been a clear sign of illness. But with continuous monitoring, we can now see that body temperature is not a static number—it's a dynamic, circadian rhythm that tells a story about your metabolism, sleep, hormonal health, and immune response.
Circadian Rhythm & Basal Temperature:
Your core body temperature follows a predictable 24-hour cycle, governed by your master biological clock. It typically:
A wearable measures skin temperature, which is a proxy for core temperature. The absolute value is less important than the deviation from your personal baseline. By tracking continuously, the device learns your unique daily rhythm.
Temperature as an Early Warning System:
This is one of the most powerful applications. Because your immune system's response to pathogens often involves releasing pyrogens (fever-inducing substances), your temperature will rise before you feel symptoms. A sustained elevation of 0.5°C to 1.0°C above your normal nightly baseline for one or more nights is a strong, data-driven indicator that your body is actively fighting something—a virus, a bacterial infection, or significant inflammation.
Reproductive Health & Ovulation Tracking:
For women, temperature tracking is a cornerstone of fertility awareness. Following ovulation, the hormone progesterone causes a sustained rise in basal body temperature (BBT) that lasts until the next menstruation. A smart ring that tracks temperature continuously (avoiding the hassle of taking a precise oral measurement first thing every morning) can automatically detect this biphasic pattern, pinpointing ovulation and identifying the fertile window and luteal phase with high accuracy. This data is invaluable for both family planning and for understanding hormonal health throughout the cycle.
Temperature & Sleep Quality:
As mentioned, the temperature drop is key for sleep initiation. If your room is too warm or your bedding is insulating you too effectively, your body may struggle to dissipate heat, leading to restlessness and shallow sleep. Observing a flatter temperature curve at night can prompt you to adjust your sleep environment—a simple fix with potentially dramatic results.
In summary, continuous temperature monitoring transforms a simple metric into a multi-dimensional health tool. It’s a metabolic readout, an early-alert system, a hormonal chart, and a sleep quality indicator all in one. Understanding its subtle shifts allows you to respond with precision, whether that means taking a rest day, increasing your hydration, or adjusting your thermostat.
Blood Oxygen Saturation, or SpO2, represents the percentage of hemoglobin molecules in your bloodstream that are carrying their full load of oxygen. It's a vital sign of respiratory and circulatory efficiency. At sea level, a normal, healthy SpO2 level is between 95% and 100%.
SpO2 During the Day: A Stability Check
While awake and at rest, your SpO2 should be stable. Brief, minor dips can occur during moments of breath-holding or sighing, but consistent readings below 95% warrant attention and potentially a discussion with a healthcare provider, as they can indicate conditions like asthma, COPD, or anemia.
Nocturnal SpO2: The Window to Sleep Breathing Health
The most critical insights from SpO2 monitoring come during sleep. When we sleep, our muscles relax—including the muscles in our airway. This can lead to partial or complete blockages, causing breathing to become shallow (hypopnea) or stop entirely (apnea) for seconds or even minutes.
Each of these events causes a corresponding dip in blood oxygen levels. Tracking SpO2 throughout the night is the primary at-home method for screening for sleep-disordered breathing, like obstructive sleep apnea (OSA).
Interpreting Your Nightly SpO2 Graph:
The Impact of Undetected Sleep Apnea:
Sleep apnea is far more than loud snoring. It's a state of chronic sleep fragmentation and intermittent hypoxia (low oxygen), which puts immense strain on the cardiovascular system. It's a major risk factor for hypertension, heart arrhythmias, stroke, type 2 diabetes, and daytime fatigue/cognitive impairment.
A smart ring that monitors SpO2 can provide powerful, objective data to answer the question, "Is my sleep being disrupted by breathing issues?" This data can be the catalyst for seeking a formal sleep study and treatment, which can be life-changing.
Beyond Apnea: Other Insights
SpO2 trends can also be informative in other contexts. At high altitudes, tracking SpO2 can help gauge acclimatization. During a respiratory illness like a cold or flu, monitoring SpO2 can provide reassurance or indicate when to seek medical attention if levels drop significantly.
In essence, SpO2 monitoring adds a crucial layer to the sleep story. It tells you not just how long or how restlessly you slept, but how effectively you breathed while doing so—a fundamental component of true restorative rest.
While we often focus on the depth or effort of breathing, the rate—the number of breaths you take per minute—is an incredibly sensitive and stable vital sign. For adults at rest, a normal respiratory rate is between 12 and 20 breaths per minute. Unlike heart rate, which can jump with a sudden noise, respiratory rate is less volatile and can be a more subtle indicator of underlying physiological changes.
How It's Measured: Wearables don't have a direct "breath sensor." Instead, they calculate respiratory rate through indirect but highly accurate methods. The most common is by analyzing the PPG (heart rate) signal. Every time you inhale, your heart speeds up slightly; every time you exhale, it slows down slightly. This is known as Respiratory Sinus Arrhythmia, and it's a normal, healthy phenomenon. Advanced algorithms can detect this rhythmic pattern in the heart rate data and extract the breaths-per-minute rate.
Why Respiratory Rate Matters:
Tracking Trends for Insight:
As with most biometrics, the individual number matters less than your personal trend. What is your normal resting rate? For some, it's 13, for others, 17. By establishing a baseline, you can spot meaningful deviations.
Respiratory rate is the quiet harmonizer in your biometric ensemble. It connects your cardiovascular and respiratory systems and responds elegantly to your state of being. Paying attention to its gentle rhythm adds another layer of depth to your self-understanding.
All the internal metrics—HRV, RHR, temperature—exist in a dynamic relationship with how you move your body. Activity data provides the essential context. It answers the critical question: Is my body's internal state (recovery/stress) a response to external strain (training/lack of movement), or is it due to internal factors (illness, emotional stress)?
Beyond Step Count: Measuring True Activity Strain
Modern devices use the accelerometer and heart rate data to estimate Active Energy Expenditure. This is more sophisticated than a simple step-to-calorie formula. It considers the intensity and duration of movement, often categorizing activity into minutes of moderate or vigorous activity. This helps you gauge whether you're meeting guidelines (e.g., 150+ minutes of moderate activity per week) that truly benefit cardiovascular health.
The Power of Non-Exercise Activity Thermogenesis (NEAT):
NEAT is the energy you burn through everything that isn't sleeping, eating, or sports-like exercise: walking to your car, typing, cooking, fidgeting. It's a huge variable in daily metabolic rate. A device that tracks all-day movement highlights the impact of a sedentary desk day versus an active day full of errands and chores. This awareness can motivate you to incorporate more "movement snacks" into your routine.
Activity as the Input, Recovery Metrics as the Output
This is the core feedback loop. You apply a stressor (a workout, a long hike, a physically demanding day), and your internal metrics show how your body is responding.
Without activity context, a low HRV score could be misinterpreted. Is it because you're getting fitter from consistent training (a known, acute effect), or because you're burning out? The activity log helps you decipher the message.
Rest as an Active Component:
Modern wellness platforms also score your inactivity. Consistent, prolonged periods of zero movement are flagged because they are detrimental to metabolic and cardiovascular health. The goal isn't constant motion, but a healthy rhythm of activity and restful recovery throughout the day, capped by quality sleep at night. Understanding your unique activity profile, as part of your complete biometric picture, is essential. You can learn more about creating this balanced profile in our resources.
By this point, you're familiar with the key players in your biometric ensemble. But an orchestra is more than a list of instruments; it's about how they play together. The ultimate power of health tracking lies not in analyzing daily snapshots, but in observing trends and understanding the interactions between metrics. This is the art of moving from data points to wisdom.
The Primacy of Your Personal Baseline
This cannot be overstated: You are your own control group. Medical ranges are population-based guidelines, but your health is personal. What's "normal" is what's normal for you.
The Interplay of Metrics: Reading the Symphony
True insight comes from correlations. Your app's "Readiness" or "Recovery" score is an algorithmic attempt to synthesize this, but you can learn to see the patterns yourself:
Context is King: Logging Your Life
The final, crucial layer is subjective context. Use the journal feature in your app (or your own notes) to log:
When you look back at a biometric dip or peak, this log provides the "why." You'll see, for example, that two glasses of wine reliably crush your HRV, or that a tough work presentation spiked your resting heart rate for two days. This turns abstract data into personal cause-and-effect knowledge. This holistic approach to data is central to the vision behind tools like Oxyzen, which aim to provide not just numbers, but a coherent narrative of your well-being.
Data without action is merely trivia. The true transformation occurs when you close the loop, using your biometric insights to inform daily decisions that enhance your well-being. This is where you move from being a passive observer to an active participant in your health. Creating a personal health protocol isn't about rigid, one-size-fits-all rules; it's about developing a flexible, responsive system guided by your body's own signals.
The Feedback Loop: Observe, Interpret, Act, Assess
This simple cycle is the engine of biohacking and proactive wellness:
The goal is to become your own expert—learning what truly works for your unique physiology.
Protocols Based on Key Metrics
The key is to start small and be patient. Introduce one protocol adjustment at a time and give your body a week or two to show a clear trend in the data. This empirical, self-experimentation approach is the cornerstone of personalized health. For more ideas and user-shared protocols, our community often discusses them on the Oxyzen blog.
In our always-on culture, stress is often the silent underminer of health. While we subjectively feel "stressed," biometrics offer an objective, quantifiable measure of our nervous system's burden. Modern wearables synthesize multiple data streams to create stress scores or direct readings of sympathetic activation, providing a real-time barometer for burnout risk.
How Stress Manifests in Your Data:
Acute stress triggers a sympathetic nervous system (SNS) response: heart rate spikes, HRV plummets, breathing becomes shallow and rapid. This is normal and adaptive for short bursts. Chronic stress, however, creates a state of persistent, low-grade SNS dominance that is reflected in your daily trends:
The "Body Battery" or "Stress Score" Concept:
Many platforms combine these metrics into a single, easy-to-grasp index. Think of it as your body's "energy bank." Stressful events (mental, physical, emotional) make withdrawals. Rest, recovery, and sleep make deposits. A continuously low or draining "score" is a quantitative warning of impending burnout or exhaustion. It visually reinforces that a demanding workday or an intense argument is a real physiological cost, equivalent in some ways to a hard workout.
Using Stress Data Proactively:
Understanding your stress biometrics shifts the narrative from "I feel overwhelmed" to "My nervous system is showing signs of overload, and I need to prioritize X, Y, or Z to restore balance." It depersonalizes the feeling and turns it into a manageable physiological process. This objective insight is a core reason why professionals and high-performers integrate tools like a smart ring into their lives; to learn more about that journey, you can read real user experiences.
Recovery is the silent partner to performance and health. It's the period where adaptation occurs—muscles repair, memories consolidate, hormones rebalance. Biometric monitoring illuminates recovery as a multi-system process, with sleep being just one (vital) component.
The Pillars of Biometric Recovery:
Passive vs. Active Recovery:
Your data helps you choose the right type.
The Role of Nutrition and Hydration:
Your biometrics are acutely sensitive to fuel and fluid.
Non-Sleep Deep Rest (NSDR):
Practices like guided meditation, yoga nidra, or even brief naps can induce a state that mimics some benefits of sleep for the nervous system. You can track their direct impact by watching your real-time heart rate drop and observing a positive bump in your afternoon HRV or stress score. This validates them as powerful tools in your recovery arsenal, especially on days when sleep was insufficient.
By viewing recovery through this multi-metric lens, you learn to honor all its forms. Sometimes the most productive thing you can do for your health is not another workout, but 20 minutes of conscious breathing with your legs up the wall. The data provides the proof that this "doing nothing" is, in fact, doing everything for your long-term vitality.
As powerful as biometric wearables are, they are tools, not oracles. A critical part of being an informed user is understanding their limitations and cultivating a healthy, non-obsessive relationship with the data. The goal is empowerment, not anxiety.
Technical Limitations to Keep in Mind:
The Psychological Pitfall: Data Anxiety (or "Orthosomnia"):
A legitimate concern is developing an unhealthy fixation on the data—a phenomenon researchers have termed "orthosomnia," where the pursuit of perfect sleep scores via tracking actually increases anxiety and worsens sleep.
When to See a Professional:
Biometric data is fantastic for awareness and prevention, but it is not a substitute for medical care.
By approaching your wearable with this balanced perspective—respecting its power while acknowledging its limits—you ensure it remains a source of insight rather than a source of stress. For common questions on getting the best, most accurate data from your device, our FAQ section is a valuable resource.
The frontier of personal biometrics is no longer just about reporting what happened yesterday; it’s about forecasting what might happen tomorrow. By applying advanced analytics—including longitudinal trend analysis, correlation mapping, and emerging machine learning models—to your continuous data stream, we enter the realm of predictive health insights. This is where wearables transition from a reactive journal to a proactive health companion.
Longitudinal Analysis: The Power of the 90-Day View
While daily and weekly views are essential for immediate feedback, the true narrative of your health unfolds over quarters. A 90-day (or longer) trend analysis reveals patterns invisible in the daily noise:
Correlation Discovery: Finding Your Personal Levers
Advanced platforms allow you to manually or algorithmically discover correlations between your lifestyle logs and your biometrics. This is personalized cause-and-effect science.
The Emergence of Predictive Algorithms
The next step is algorithmic prediction. By analyzing your unique historical patterns, systems can begin to forecast states.
These predictive models are built on the foundation of clean, consistent data. They represent the shift from descriptive analytics ("you slept poorly") to diagnostic ("you slept poorly because of late caffeine") and finally to predictive ("if you have caffeine now, you will likely sleep poorly").
The Role of Population-Level (Anonymous) Data
Anonymized, aggregated data from millions of users can power population-level insights that feed back to the individual. For instance, if the data shows that thousands of users with a similar biometric signature to yours responded positively to a specific intervention, that could be presented as a suggested experiment for you to try. This creates a collective learning loop, accelerating personal discovery. This kind of large-scale, ethical data application is part of the forward-thinking mission of companies in this space.
The technology on your finger today is just the beginning. The convergence of sensor miniaturization, non-invasive molecular monitoring, and AI integration is poised to make the next generation of wearables even more profound and integrated into healthcare.
Non-Invasive Blood Biomarker Monitoring:
The holy grail is moving beyond physiological signals to continuous chemical monitoring. Research is advancing rapidly in areas like:
Advanced Cardiovascular and Neurological Imaging:
Future sensors may move closer to medical imaging capabilities.
Seamless Integration and the "Digital Twin":
The future lies in integration. Your wearable data will seamlessly sync with your electronic medical records (with your consent), providing your doctor with years of contextual data. It will combine with your genetic data (from services like 23andMe), your microbiome analysis, and your detailed nutrition logs.
This could culminate in the concept of a "Digital Twin"—a dynamic, AI-driven model of your unique physiology. You could simulate the impact of a new medication, a different training program, or a dietary change on this virtual "you" before trying it in real life, dramatically personalizing and de-risking health optimization.
The Ethical and Privacy Imperative:
With this power comes immense responsibility. The industry must prioritize:
The journey ahead is as much about building trust as it is about building better sensors. The companies that will lead will be those that champion user privacy and ethical data use as core features, not just compliance obligations.
Ultimately, the goal of all this technology is not to live by the numbers, but to use the numbers to live better. The endpoint of biometric literacy is a state of intuitive, informed self-awareness where the data serves as a periodic check-in, not a constant overseer. It's about integrating this quantitative wisdom into a qualitative, holistic life.
The Bio-Intuitive Feedback Loop:
With enough time and attention, you begin to internalize the lessons. You start to feel when your HRV is likely low—a subtle, wired-but-tired sensation. You notice the bodily signs of a temperature rise. The wearable then confirms these intuitions, strengthening your mind-body connection. Eventually, you may only need to check the data when your intuition signals something is off, using it as a diagnostic tool rather than a daily report card.
Creating a Sustainable Routine:
A holistic protocol is built on consistent fundamentals that the data universally supports:
The Role of Community and Shared Learning:
Sharing anonymized insights and protocols within trusted communities (like those fostered around a brand's platform) can accelerate learning. Seeing how others with similar goals and challenges interpret their data can provide new perspectives and solutions. Whether it's through shared user stories or forum discussions, this collective wisdom adds a rich, human layer to the data.
The Long-Term Vision: Lifelong Healthspan, Not Just Lifespan
The final integration is temporal. This isn't about optimizing for a race next month; it's about compounding small, data-informed positive decisions over decades to extend your healthspan—the number of years you live in good health. By understanding your personal trends, you can potentially spot early deviations signaling metabolic dysfunction, cardiovascular risk, or cognitive decline far earlier than traditional annual check-ups allow, creating a window for early, often lifestyle-based, intervention.
We began this exploration amid a sea of raw data—flickering lights, resistance values, and acceleration vectors. We have followed the journey of this data as it transforms into signals, then into metrics, and finally, through the lens of context and trend, into genuine insight.
This process demystifies the inner workings of your body. The elevated resting heart rate is no longer a mysterious number; it's your cardiovascular system asking for rest. The dip in HRV is your nervous system reporting on yesterday's stress load. The gentle rise in temperature is your immune system mobilizing its defenses.
Tools like advanced smart rings, such as those developed by Oxyzen, are the translators in this dialogue. They give a voice to the silent, automatic processes that define your well-being. But you are the interpreter and, ultimately, the decision-maker.
The promise of this technology is not a life chained to optimization, perpetually chasing perfect scores. It is the promise of agency. It is the move from guessing about your health to knowing. From wondering why you're tired to understanding the cause. From following generic advice to discovering what works uniquely for you.
Embrace the data. Learn its language. Experiment with its lessons. But always remember that the final metric of success is not a number on a screen, but the quality of your lived experience—your energy, your resilience, your joy, and your vitality. Let the insights guide you toward a life where you feel as good as you possibly can, for as long as you possibly can. You are no longer just reading your body's story; you are equipped to help write its next, best chapter.
Your Trusted Sleep Advocate: Sleep Foundation — https://www.sleepfoundation.org
Discover a digital archive of scholarly articles: NIH — https://www.ncbi.nlm.nih.gov/
39 million citations for biomedical literature :PubMed — https://pubmed.ncbi.nlm.nih.gov/
Experts at Harvard Health Publishing covering a variety of health topics — https://www.health.harvard.edu/blog/
Every life deserves world class care :Cleveland Clinic - https://my.clevelandclinic.org/health
Wearable technology and the future of predictive health monitoring :MIT Technology Review — https://www.technologyreview.com/
Dedicated to the well-being of all people and guided by science :World Health Organization — https://www.who.int/news-room/
Psychological science and knowledge to benefit society and improve lives. :APA — https://www.apa.org/monitor/
Cutting-edge insights on human longevity and peak performance:
Lifespan Research — https://www.lifespan.io/
Global authority on exercise physiology, sports performance, and human recovery:
American College of Sports Medicine — https://www.acsm.org/
Neuroscience-driven guidance for better focus, sleep, and mental clarity:
Stanford Human Performance Lab — https://humanperformance.stanford.edu/
Evidence-based psychology and mind–body wellness resources:
Mayo Clinic — https://www.mayoclinic.org/healthy-lifestyle/
Data-backed research on emotional wellbeing, stress biology, and resilience:
American Institute of Stress — https://www.stress.org/

