Health Metrics Explained: What Your Smart Ring Actually Measures
Explaining what the health metrics from your smart ring actually mean.
Health Metrics Explained: What Your Smart Ring Actually Measures
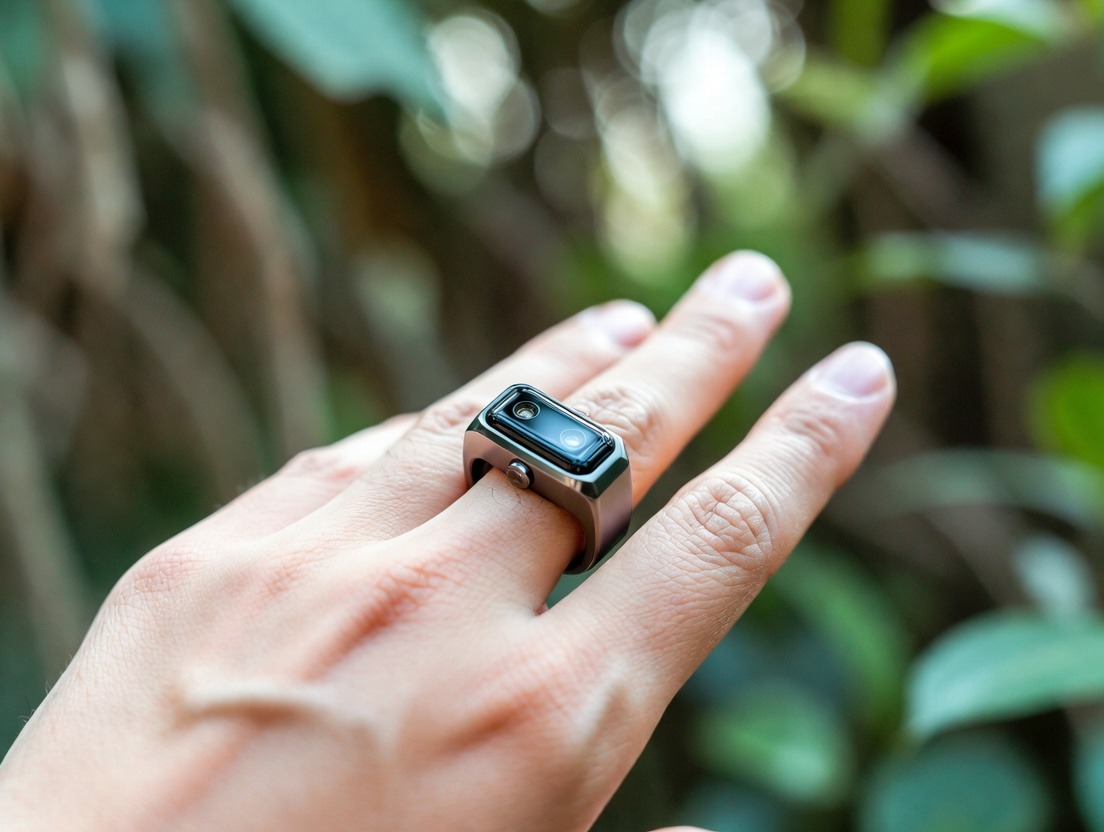
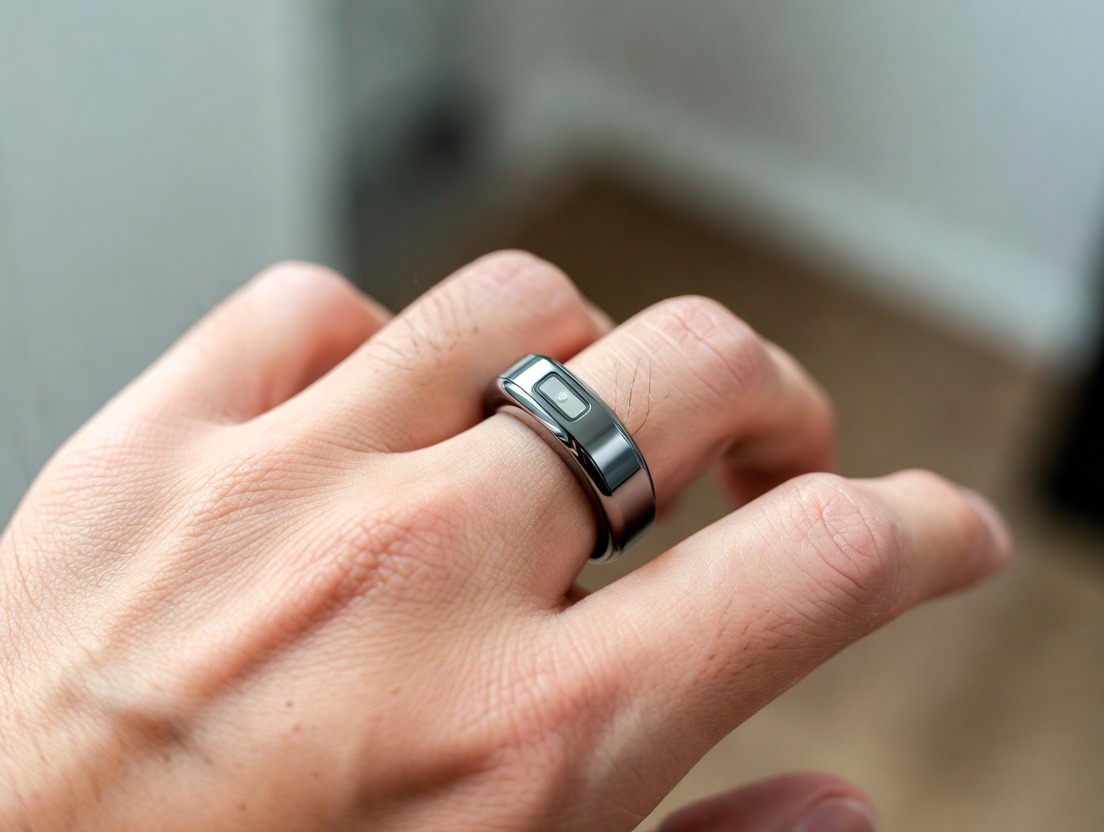
A quiet revolution is happening on our fingers. While we’ve grown accustomed to tracking steps on our wrists, a new generation of discreet, powerful wearable technology—the smart ring—is providing a deeper, more intimate window into our health than ever before. Unlike bulky watches that sit on top of the wrist, a smart ring, nestled against the delicate blood vessels and nerves at the base of your finger, operates at the physiological front lines. It’s a 24/7 health observatory, gathering a symphony of data points that paint a comprehensive picture of your well-being. But what exactly is it measuring? And more importantly, what do all those numbers, graphs, and scores actually mean for your life?
For many, the initial excitement of unboxing a device like the Oxyzen ring—sleek, comfortable, and promising insights—quickly gives way to a flood of questions. Your app dashboard might show your Sleep Score, your Resting Heart Rate (RHR), your Heart Rate Variability (HRV), and your Body Temperature, among others. These aren't just vanity metrics; they are vital signs with deep roots in physiology, psychology, and performance science. Yet, without context, they can feel abstract, confusing, or even anxiety-inducing.
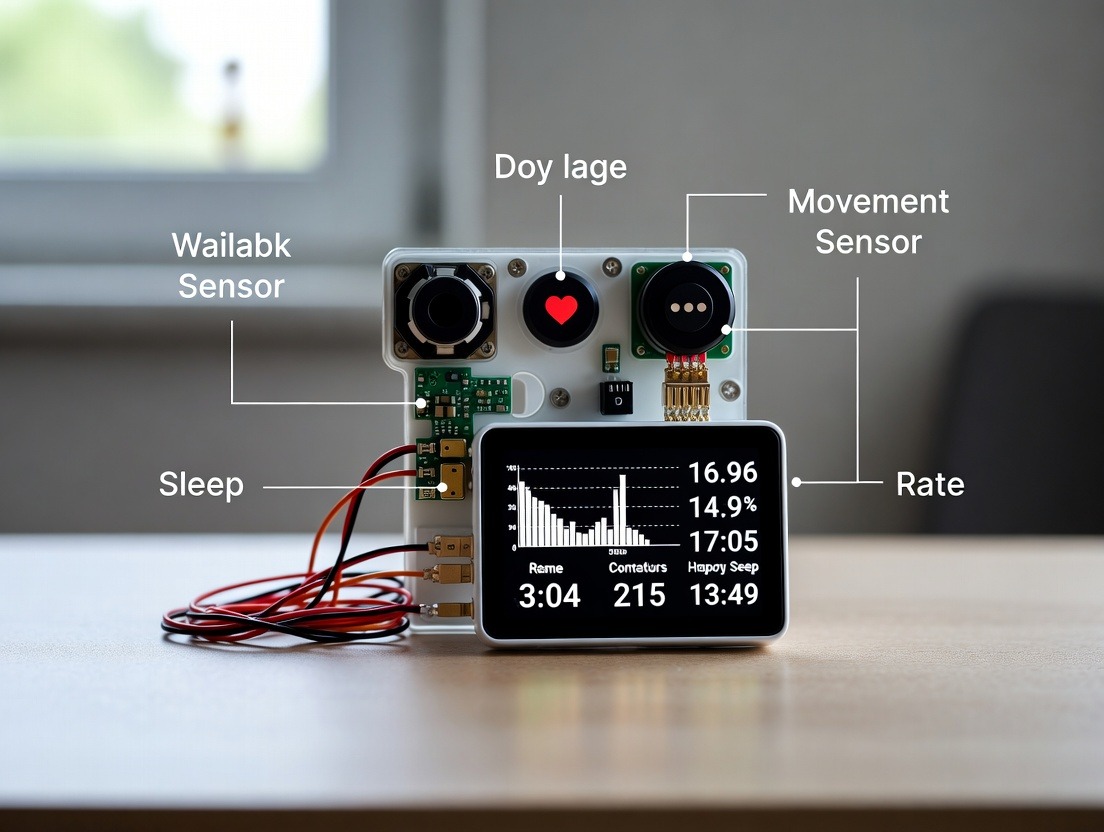
This guide exists to demystify that data. We will journey through the core metrics measured by advanced smart rings, moving beyond the surface to understand the "why" and the "so what." We’ll explore how optical sensors and accelerometers work in concert to translate faint light signals and subtle motions into actionable health intelligence. You’ll learn how your nightly HRV is a direct conversation with your nervous system, how continuous temperature tracking can reveal more than a fever, and why your SpO2 is a critical gauge of resilience.
By the end, you won’t just see numbers; you’ll see a narrative—a story of your body’s response to stress, recovery, exertion, and rest. This knowledge transforms a sophisticated piece of technology from a mere tracker into a true partner in your wellness journey. For a deeper dive into the technology that makes this possible, you can explore how Oxyzen works on a fundamental level. Let’s begin by understanding the very foundation of all these measurements: the science of photoplethysmography, or PPG.
The Core Technology: How a Ring Measures Your Vital Signs
At first glance, the idea that a small ring can monitor your heart rate, blood oxygen, and more seems like magic. In reality, it’s a brilliant application of physics and physiology, centered on a technology called Photoplethysmography (PPG). Pronounced "FOH-toh-pleth-iz-MOG-ruh-fee," this is the foundational heartbeat of nearly all optical health sensors in wearables.
PPG Explained: Reading Your Pulse with Light
Imagine shining a very bright flashlight through your fingertip. You’d see a red glow because light passes through the tissue. Now, with every heartbeat, your heart pumps a surge of blood through your arteries. This tiny, rhythmic increase in blood volume momentarily changes how much light can pass through or reflect off your blood vessels. PPG sensors exploit this phenomenon.
A smart ring houses miniature LEDs (Light Emitting Diodes)—typically green and red or infrared—that shine light into the skin on the palm-side of your finger. Opposite or adjacent to these LEDs are photodiodes, sensors that measure the intensity of the light that is either transmitted through the finger or reflected back. The photodiode detects incredibly subtle changes in light absorption. When blood volume is higher (during a heartbeat pulse), more light is absorbed, so less light reaches the sensor. Between beats, less light is absorbed. This oscillation creates a waveform—the PPG signal—that looks like a series of rolling hills, with each hill representing a single heartbeat.
Why the Finger is a Superior Location
You might wonder why a ring is more effective than a wrist-based device. The answer lies in anatomy. The finger, particularly the base, has a high density of capillary beds (tiny blood vessels) and less variable tissue between the skin and arteries compared to the wrist. This provides a stronger, cleaner PPG signal with less "noise" from motion or loose fitting. The ring form factor also allows for consistent, snug contact that a watch on a bony wrist can struggle to maintain, especially during sleep. This superior signal fidelity is why medical-grade pulse oximeters are clip-ons for the finger.
Beyond the Pulse: Extracting a Universe of Data
The raw PPG waveform is just the beginning. Advanced algorithms perform a digital symphony on this data to extract distinct health metrics:
Heart Rate (HR): By counting the peaks (heartbeats) in the waveform over a period, the ring calculates beats per minute (BPM).
Heart Rate Variability (HRV): This isn't measured by counting peaks, but by measuring the precise time intervals between each consecutive heartbeat (R-R intervals). The millisecond variations in these intervals are what constitute HRV.
Blood Oxygen Saturation (SpO2): This uses a principle called pulse oximetry. Hemoglobin (the protein in red blood cells that carries oxygen) absorbs light differently depending on whether it’s oxygenated or deoxygenated. Oxygenated hemoglobin (oxyHb) absorbs more infrared light, while deoxygenated hemoglobin (deoxyHb) absorbs more red light. By comparing the absorption of red and infrared LED light, the sensor can calculate the percentage of hemoglobin that is oxygenated—your SpO2.
Respiratory Rate: Believe it or not, your breathing rate can be derived from the PPG signal. Each breath causes a slight, slow modulation in the baseline of the waveform due to changes in intrathoracic pressure. Algorithms can isolate this respiratory-induced rhythm.
The Role of the Accelerometer and Other Sensors
While PPG is the star, it doesn’t work alone. A high-precision 3-axis accelerometer is crucial. It serves two primary functions:
Motion Detection & Activity Tracking: It counts steps, identifies periods of activity vs. rest, and can even classify types of movement.
Motion Artifact Rejection: This is its most critical job for health sensing. If you’re moving your hand, the PPG signal gets corrupted with motion noise (imagine the light sensor shaking). The accelerometer detects this motion so algorithms can either discard the bad data or apply advanced filters to clean the signal. The best rings use sensor fusion, intelligently combining PPG and motion data for accuracy.
Some rings, like Oxyzen, also include a skin temperature sensor. This is typically a negative temperature coefficient (NTC) thermistor that rests against the skin, providing a continuous log of peripheral temperature trends, which is more valuable for tracking changes than providing a single absolute clinical reading.
Understanding this technological foundation transforms the data from mysterious outputs to logical results of measurable physiology. It’s the reason you can trust the insights on your screen. For those interested in the engineering and design philosophy behind this approach, the Oxyzen story details the journey to perfecting this balance of form and function. Now, with the "how" established, let's delve into the first and most familiar metric: your beating heart.
Heart Rate: More Than Just a Number
Your heart rate, measured in beats per minute (BPM), is the most immediate and intuitive vital sign. From the moment you strap on a fitness tracker, you learn to recognize your resting heart rate and see your heart pound during a workout. But when monitored 24/7 by a smart ring, heart rate transforms from a momentary snapshot into a continuous story—a narrative of your daily strain, your nightly recovery, and your body’s silent reactions to the world.
Resting Heart Rate (RHR): Your Baseline of Health
Your Resting Heart Rate is precisely what it sounds like: your heart rate when you are fully awake but completely at rest—physically and mentally relaxed. For a smart ring, the most accurate RHR is typically calculated during your deepest, most stable sleep periods, free from the influences of digestion, standing, or acute stress.
What’s a "Good" RHR? While the textbook range for a healthy adult is 60-100 BPM, a ring-wearing, health-conscious individual will often see lower numbers. Here’s a more nuanced breakdown:
Excellent: 50-60 BPM (common in very fit individuals)
Good: 60-70 BPM
Average: 70-80 BPM
Elevated: 80-90+ BPM (may warrant attention to lifestyle factors)
Why RHR Matters: RHR is a powerful, long-term indicator of cardiovascular fitness and autonomic nervous system efficiency. A lower RHR generally suggests that your heart muscle is strong and doesn’t have to work as hard to pump blood throughout your body. Think of a well-tuned engine idling smoothly. A consistently elevated RHR can be a sign of deconditioning, ongoing stress, inadequate recovery, dehydration, or even the onset of illness.
Tracking Trends, Not Just Numbers: The true power of ring-based RHR tracking is in the trend line. Seeing your RHR dip by 2-3 BPM over several months of consistent training is a fantastic, objective sign of improved fitness. Conversely, a sudden, sustained increase of 5-7 BPM above your personal baseline is one of the most reliable early warnings your body gives you. It often signals that your body is fighting something—be it stress, fatigue, dehydration, or an impending cold—before you feel any overt symptoms.
Daytime Heart Rate: Responding to Life
Throughout the day, your heart rate is a live biofeedback monitor. A smart ring observes its fluctuations:
Mental Stress: A difficult work meeting or an anxious thought can spike your heart rate without a single muscle moving.
Physical Activity: It tracks the intensity of your workout through heart rate zones (e.g., fat burn, cardio, peak).
Post-Prandial Response: That meal digesting? It requires increased blood flow to your gut, which can raise your heart rate slightly.
Caffeine & Stimulants: The direct physiological impact of your morning coffee is quantified in real-time.
Nighttime Heart Rate: The Story of Recovery
Sleep is when the most telling heart rate data emerges. A healthy sleep pattern shows a distinct heart rate curve:
Gradual Decline: As you fall asleep and enter light sleep, your heart rate begins to drop from its daytime level.
Deep Sleep Nadir: During deep (slow-wave) sleep, your heart rate should reach its lowest point of the 24-hour cycle. This is when physical repair is prioritized, and energy is conserved.
REM Fluctuations: During REM sleep (associated with dreaming and memory consolidation), your heart rate can become variable, spiking and dipping similar to awake states, while your body remains paralyzed.
A disrupted heart rate curve—one that stays elevated, is jagged, or doesn’t reach a clear low point—is a strong indicator of poor sleep quality, incomplete recovery, or an underlying disturbance. This continuous nocturnal monitoring provides a level of insight impossible to get from a manual morning pulse check.
Practical Insights from Heart Rate Data
Fitness Optimization: Use your exercise heart rate to ensure you’re training in the correct zone for your goals (e.g., endurance vs. high-intensity intervals).
Illness Prediction: A sustained elevated RHR, especially when coupled with other metric deviations, is a cue to prioritize rest, hydration, and sleep. Many users report their ring "telling them they’re getting sick" a day before symptoms appear.
Stress Awareness: Noticing heart rate spikes during sedentary activities can make you aware of subconscious stress triggers, allowing you to practice breathing techniques or take a mindful break.
Recovery Validation: A low, stable sleeping heart rate following a hard training block confirms that your body is effectively repairing itself.
Your heart rate is the steady drumbeat of your existence. But to understand the nuance, the subtle cues of readiness and resilience, we must listen to the spaces between the beats. This brings us to a more sophisticated and profoundly insightful metric: Heart Rate Variability.
Heart Rate Variability: The Ultimate Readiness Metric
If heart rate is the drumbeat, Heart Rate Variability (HRV) is the complex, syncopated rhythm played over top of it. It is the measure of the subtle variations in time between each of your heartbeats, measured in milliseconds. Contrary to what one might assume, a healthy heart does not tick like a metronome. It has a dynamic, flexible rhythm that is a direct, real-time reflection of your autonomic nervous system (ANS) balance. This makes HRV, as tracked by your smart ring, one of the most powerful biomarkers for overall stress, recovery, and readiness you have access to.
The Science of HRV: Your Nervous System's Conversation
Your heart rate is controlled by a delicate tug-of-war between two branches of your ANS:
The Sympathetic Nervous System (SNS): Your "fight or flight" system. When activated (by stress, exercise, or danger), it releases adrenaline and norepinephrine, which increases heart rate and decreases HRV (making beats more regular) to prepare for action.
The Parasympathetic Nervous System (PNS): Your "rest and digest" system. Orchestrated by the vagus nerve, it promotes relaxation, recovery, and digestion. It slows heart rate and, critically, increases HRV (creating more variability between beats), allowing for a flexible, responsive system.
A higher HRV generally indicates a stronger parasympathetic tone and a more resilient, adaptable nervous system. Your body is in a state where it can recover effectively, handle stress efficiently, and is likely primed for performance. A lower HRV suggests dominant sympathetic activity—your body is under strain, fighting something, or in need of rest.
How Your Ring Measures and Presents HRV
Smart rings don't measure HRV during chaotic daytime activity. They calculate it during stable periods, most reliably during deep sleep, when external influences are minimized. They use the PPG signal to detect the precise R-R intervals between beats and then apply complex mathematical algorithms (like rMSSD or SDNN) to quantify the variability. Your app will typically show you a single, nightly HRV baseline or trend line. It’s crucial to track your own baseline, not compare to others, as absolute HRV is highly individual, influenced by age, genetics, and fitness.
Interpreting Your HRV Trends
A Rising or High HRV Trend: This is a green light. It suggests you are recovering well, managing stress effectively, and are likely adapting positively to your training and lifestyle. You are probably sleeping well and feeling energized.
A Sharp Drop in HRV: This is a yellow or red flag. A significant drop below your personal baseline is one of the clearest signs your body is dealing with excess stress. The cause could be:
Training Overload: You’re not recovering from your workouts.
Emotional or Mental Stress: Work deadlines, relationship issues.
Poor Sleep: Insufficient duration or quality.
Illness Onset: Your body is mounting an immune response.
Poor Nutrition or Dehydration: The physiological strain of processing junk food or lack of fluids.
Jet Lag or Circadian Disruption: Travel across time zones.
Using HRV for Daily Decision-Making
This is where HRV transitions from an interesting data point to a practical tool for autoregulation.
Training Guidance: Wake up to a low HRV? Consider making today’s workout lighter or taking an active recovery day instead of pushing for a personal record. Your body is asking for resources to repair, not for more strain.
Stress Management: A low HRV can be a prompt to incorporate more parasympathetic-activating activities into your day: deep belly breathing, meditation, a walk in nature, or prioritizing an early bedtime.
Lifestyle Experimentation: HRV provides objective feedback. Try tracking how different interventions affect your score: Does a 10-minute meditation before bed raise it? Does alcohol lower it? Does eating late at night suppress it? You move from guessing to knowing. For more on how to integrate these insights, our blog offers numerous guides on recovery and stress management.
The Crucial Caveats
HRV is powerful, but it must be interpreted wisely:
Don't Obsess Over Daily Numbers: Look at 3-7 day rolling averages. Single-day dips are normal; consistent trends are meaningful.
It's One Piece of the Puzzle: Always view HRV in context with other metrics like RHR, sleep quality, and temperature. A low HRV with a high RHR and poor sleep is a stronger signal than a low HRV alone.
Individuality is Key: Your 45 ms might be someone else’s 70 ms. The trend is your friend.
HRV offers a direct line to your body’s internal state, giving you a quantifiable measure of your readiness to perform, adapt, and thrive. By learning its language, you gain a profound tool for managing your health proactively. As we understand our circulatory rhythm, another critical metric shines a light on the very quality of our blood: oxygen saturation.
Blood Oxygen Saturation (SpO2): Your Cellular Fuel Gauge
Blood Oxygen Saturation, commonly referred to as SpO2, is a percentage that represents how much of the hemoglobin in your red blood cells is carrying oxygen. It is a direct measure of your respiratory and circulatory systems’ efficiency in delivering this essential element to every cell in your body. While you may have encountered it in a doctor’s office via a finger-clip pulse oximeter, a smart ring brings the power of continuous, trend-based monitoring into your daily life, revealing insights far beyond acute medical events.
The Physiology of Oxygen Transport
Every breath you take draws oxygen into your lungs, where it binds to hemoglobin molecules inside red blood cells. This oxygenated blood is then pumped by the heart through arteries to tissues throughout the body. At the cellular level, oxygen is released to fuel metabolism—the process that creates energy (ATP). SpO2 measures the saturation of hemoglobin with oxygen in your peripheral blood (like in your finger) as a percentage. A normal, healthy SpO2 at sea level typically ranges from 95% to 100%.
How Your Ring Measures SpO2: Pulse Oximetry
As explained in the technology section, this is achieved through pulse oximetry. Your ring’s sensors use red and infrared light to distinguish between oxygenated and deoxygenated hemoglobin. By analyzing the ratio of light absorption during your pulse waves, it calculates your SpO2. Advanced rings perform this measurement periodically throughout the night, creating a nocturnal SpO2 profile.
Why Nighttime SpO2 Monitoring is Revolutionary
While a daytime spot-check can be useful, the most valuable SpO2 data comes from uninterrupted sleep tracking. During sleep, our respiratory drive changes, and potential issues often become apparent.
Normal Nocturnal Pattern: It’s normal for SpO2 to dip slightly during sleep, often staying within 1-3% of your waking baseline. Small, brief dips (desaturations) can occur, especially during REM sleep.
Concerning Patterns:
Frequent, Significant Dips: Repeated drops of 4% or more from baseline may indicate sleep-disordered breathing. The most common form is obstructive sleep apnea (OSA), where the airway partially or fully collapses during sleep, interrupting breathing and causing oxygen levels to fall. This strains the cardiovascular system and fragments sleep, leading to daytime fatigue even if you don’t recall waking up.
Consistently Low Baseline: A nightly average persistently below 94% could suggest an underlying respiratory or circulatory issue that warrants medical investigation.
Practical Insights from SpO2 Data
Sleep Quality Detective: If you consistently wake up feeling unrefreshed despite sufficient time in bed, a graph showing frequent SpO2 dips could be the clue. It provides objective data to take to a sleep specialist, moving the conversation from "I'm tired" to "my data shows 15 desaturation events per hour."
Altitude Acclimation: When traveling to or exercising at high altitude, where atmospheric oxygen is lower, tracking your SpO2 is incredibly useful. It helps you gauge how well you are acclimating and can warn you of potential altitude sickness if your saturation drops too low.
Illness and Recovery Indicator: Respiratory illnesses like colds, flu, or bronchitis can impact lung function and lower SpO2. Monitoring it during sickness can help you track your recovery. (Note: For any serious respiratory symptoms, always consult a doctor; a ring is not a medical device).
Overall Respiratory Health: For athletes, a strong, stable SpO2 is a sign of robust respiratory fitness. Seeing how it responds to intense training blocks can be informative.
Limitations and Context
It’s vital to understand the smart ring’s role:
Trend Over Absolute Precision: Consumer ring SpO2 is excellent for tracking trends and patterns over time but is not a calibrated medical diagnostic device. It’s designed for wellness awareness, not for diagnosing conditions.
Motion is the Enemy: Accurate SpO2 requires a clean PPG signal. This is why measurements are taken during still periods like sleep, not during the day while you’re moving.
One Metric Among Many: A single low reading is not cause for alarm. Look for persistent patterns and correlate them with how you feel—fatigue, morning headaches, poor sleep scores.
By monitoring your SpO2, your smart ring gives you a silent, nightly report on the efficiency of your breathing and the quality of your sleep’s restorative power. It shifts SpO2 from an abstract hospital number to a personal gauge of respiratory wellness. As we track the oxygen in our blood, we must also consider the engine that drives it: our metabolism, often reflected in our body’s thermal signature.
Body Temperature: The Silent Metabolic Signal
Body temperature is a fundamental vital sign, a direct output of your body’s metabolic engine. For centuries, a fever thermometer under the tongue has been the gold standard for detecting illness. A smart ring revolutionizes this concept by tracking continuous peripheral skin temperature from the finger, providing a rich, dynamic trend line instead of a single-point snapshot. This shift from acute symptom detection to chronic pattern recognition unlocks profound insights into your circadian rhythm, metabolic health, stress, and even fertility.
Core vs. Peripheral: What Your Ring Actually Measures
It’s critical to distinguish between core body temperature (the temperature of your internal organs, measured rectally, orally, or via ingestible pills) and skin temperature (the temperature at the body’s surface). Your smart ring measures the latter at your finger.
While skin temperature is lower and more variable than core temperature (influenced by room temperature, bedding, and blood flow to extremities), its relative changes over time are exceptionally informative. Advanced algorithms focus on the trend—how your temperature shifts across the 24-hour cycle and from night to night—rather than the absolute number.
The Circadian Temperature Rhythm
A healthy body follows a distinct diurnal temperature rhythm, a core component of your circadian biology:
Daily Drop: In the evening, as melatonin secretion begins, your core temperature starts to decrease, a signal that prepares your body for sleep.
Nighttime Low: Temperature reaches its nadir typically in the second half of the night, during your deepest sleep phases.
Morning Rise: In the hours before you wake, your temperature begins to rise (cortisol increases), helping to mobilize energy and promote alertness. This rise is a key part of feeling refreshed.
Your ring’s temperature graph should, over time, reflect this smooth wave-like pattern. A blunted, erratic, or inverted rhythm can be a sign of circadian disruption—caused by shift work, poor sleep hygiene, excessive blue light at night, or social jet lag.
Temperature as a Diagnostic Trend
Illness Prediction & Detection: This is one of the most powerful applications. An elevated nocturnal temperature baseline relative to your personal norm is a classic early warning sign. Your body raises its temperature (even sub-fever level) as part of the innate immune response to fight pathogens. Your ring may alert you to this shift 12-48 hours before you feel overt symptoms, allowing you to preemptively hydrate, rest, and support your immune system.
Ovulation Tracking (Fertility Awareness): For women, core body temperature shows a clear biphasic pattern across the menstrual cycle. After ovulation, the hormone progesterone causes a sustained rise in basal body temperature (BBT) of about 0.3-0.5°C (0.5-1.0°F) until the next period. While a ring measures skin temperature, which is noisier, advanced algorithms can still detect this post-ovulatory shift in the trend data, providing valuable insight into cycle phases. This is a key feature in many wellness-focused rings.
Stress and Recovery Marker: Intense physical or psychological stress can dysregulate the autonomic nervous system, affecting blood flow to the skin and, consequently, peripheral temperature. An unusually low or unstable nighttime temperature can sometimes correlate with poor recovery or high stress loads.
Sleep Phase Estimation: The predictable drop in temperature is so tied to sleep onset that some algorithms use the temperature curve to help pinpoint the beginning of sleep and differentiate between light and deep sleep stages.
How to Use Your Temperature Data
Establish Your Baseline: Wear your ring consistently for at least a week to understand your normal nightly range and pattern.
Watch for Deviations: Pay attention to sustained shifts, not one-off spikes (which could be due to a hot room or thick blankets). A consistent elevation over 2-3 nights is a meaningful signal.
Correlate with Other Metrics: A temperature rise coupled with an elevated RHR and low HRV forms a powerful "stress/illness triad" that strongly suggests your body is under significant load.
Cycle Tracking: If using it for cycle awareness, look for the sustained upward shift in your 5-7 day rolling average that indicates the luteal phase has begun.
Temperature is the slow, steady drum of your metabolic and circadian health. By tracking its subtle ebbs and flows, your smart ring provides a continuous thermal journal of your body’s internal state, connecting the dots between your lifestyle, your environment, and your biology. This foundational rhythm is inextricably linked to the most obvious pillar of recovery: our sleep.
Sleep Tracking: Beyond Hours in Bed
Sleep is the cornerstone of health, and for decades, our only metric was duration: "I got 8 hours." A smart ring shatters this simplistic view, providing a multi-dimensional analysis of your sleep that rivals clinical-grade understanding. By combining PPG (heart rate, HRV), accelerometry (movement), and temperature data, it constructs a detailed architecture of your night, revealing not just how long you sleep, but how well you sleep across its vital stages.
The Stages of Sleep: Architecture Matters
Sleep is not a monolithic state. It cycles through distinct stages every 90-120 minutes, each with unique physiological functions:
Light Sleep (Stages N1 & N2): This is transitional sleep, making up about 50-60% of the night. It’s important for memory consolidation and metabolic regulation. Your ring detects this as reduced movement and a beginning decline in heart rate.
Deep Sleep (Slow-Wave Sleep, Stage N3): The most physically restorative phase. This is when tissue repair, muscle growth, immune strengthening, and cellular cleanup occur. It’s characterized by very low heart rate (at its nightly nadir), high HRV, minimal movement, and typically lower body temperature. Your ring’s algorithms identify this through these distinct signatures.
REM Sleep (Rapid Eye Movement): The mentally restorative phase, crucial for emotional processing, memory consolidation, and creativity. Your brain is highly active (dreaming occurs here), but your body is paralyzed (atonia). Your ring identifies REM by a return to near-awake heart rate levels, increased HRV variability, and, crucially, a complete lack of movement despite an active heart signal.
A healthy sleep cycle involves repeated passages through these stages. The first half of the night is typically richer in deep sleep, while REM periods lengthen in the second half.
Key Sleep Metrics Your Ring Provides
Total Sleep Time: The actual time spent asleep, excluding periods of wakefulness after initial sleep onset.
Sleep Efficiency: The percentage of time in bed actually spent sleeping. 90% or above is excellent; lower percentages indicate more restlessness or wakefulness.
Sleep Latency: How long it takes you to fall asleep. Ideally under 20 minutes. A consistently long latency can point to poor sleep hygiene or evening stress.
Wake After Sleep Onset (WASO): The total time spent awake after initially falling asleep. Minimal WASO is a sign of solid, uninterrupted sleep.
Sleep Stage Breakdown: The minutes and percentage spent in Light, Deep, and REM sleep. While ring staging is an estimate (true staging requires an EEG brain scan), the trends are highly reliable.
Sleep Score: A composite score (often out of 100) that weighs all the above factors—duration, efficiency, latency, and stage balance—to give you a single, easy-to-digest metric for overall sleep quality.
Interpreting Your Sleep Data for Actionable Insights
Deep Sleep Deficiency: If your ring consistently shows low deep sleep, consider: Are you allowing enough time for sleep (deep sleep is prioritized early)? Are you consuming alcohol or cannabis too close to bed? (These substances suppress REM early in the night and can fracture deep sleep.) Are you overtrained or excessively stressed?
REM Sleep Deficiency: Low REM can be linked to alcohol consumption (which severely suppresses REM), certain medications, sleep fragmentation (e.g., from apnea, signaled by SpO2 drops), or chronic sleep deprivation (REM is prioritized last).
High WASO/Fragmentation: Frequent awakenings disrupt the sleep cycle. Causes can range from environmental (noise, light, temperature) to physiological (pain, sleep apnea, restless legs, digestive issues).
The Impact of Lifestyle: Your ring provides direct feedback. See how late meals, evening screen time, caffeine timing, or an intense late workout affect your sleep architecture and score. It turns guesswork into knowledge.
The Power of Consistent Tracking
One night of poor data is a story. Two weeks of data is a revelation. Consistent tracking allows you to:
Find Your Personal Rhythm: Discover your ideal bedtime and sleep duration for your best scores.
Quantify the Impact of Changes: Did a new mattress, blackout curtains, or a mindfulness practice improve your deep sleep? The data will show you.
Correlate with Daytime Metrics: See how a night of poor sleep (low efficiency, low deep sleep) directly impacts your next-day RHR, HRV, and cognitive performance.
Sleep is the ultimate recovery modality. Your smart ring transforms it from a black box into a transparent, analyzable process. By understanding your sleep architecture, you can make targeted interventions to improve the single most important third of your life. For a deep library of tips on optimizing this crucial pillar, our blog is a dedicated resource for sleep science and strategies. As we recover at night, we expend energy by day, which brings us to the metric of movement and calorie burn.
Activity & Calorie Burn: The Movement Intelligence
While smart rings are renowned for their passive health monitoring, they are also powerful, discreet activity trackers. Using their accelerometers and heart rate sensors, they quantify your daily movement, estimate your energy expenditure, and provide nuanced insights into how your activity levels interact with your recovery metrics. This isn't just about counting steps; it's about understanding your body's total daily energy dynamics.
How a Ring Tracks Activity
The primary sensor for activity is the 3-axis accelerometer, which detects linear acceleration in all directions. Sophisticated algorithms interpret these motion patterns:
Step Count: By identifying the rhythmic, cyclical motion of walking or running.
Activity Type Recognition: Advanced algorithms can classify activities like walking, running, cycling (if your hands are on handlebars), and even elliptical training based on the unique motion signature.
Active Minutes & Intensity: The ring tracks time spent in activities of moderate to vigorous intensity, often using heart rate data to validate and refine the intensity level.
Understanding Calories: BMR, Active Burn, and NEAT
Your ring provides an estimate of Total Daily Energy Expenditure (TDEE)—the total calories you burn in a day. This is broken down into key components:
Basal Metabolic Rate (BMR): The calories your body burns at complete rest just to maintain vital functions (breathing, circulation, cell production). This is the largest component (60-75% of TDEE) and is estimated using your personal data (age, height, weight, sex).
Active Energy Burn: Calories burned through dedicated exercise and tracked activities. This comes from the accelerometer and heart rate data during workouts.
Non-Exercise Activity Thermogenesis (NEAT): This is the unsung hero of metabolism—the calories burned through all movement that isn't formal exercise: fidgeting, typing, walking to the car, doing dishes, standing. A smart ring, by tracking all-day movement, captures a significant portion of your NEAT, which can vary by hundreds of calories daily and is a major factor in weight management.
Activity Level as a Recovery Context
This is where the smart ring ecosystem shines. Your activity data isn't in a silo; it’s directly contextualized against your recovery metrics.
The Strain-Recovery Feedback Loop: A day of high activity (burn) should, ideally, be followed by signs of good recovery: a low sleep heart rate, high HRV, and good sleep scores. If your activity is consistently high but your recovery metrics are deteriorating (rising RHR, falling HRV), it’s a clear signal of imbalance. You are accumulating more fatigue than you can dissipate, a one-way ticket to overtraining or burnout.
Rest Day Validation: On a planned rest day, seeing low activity levels coupled with improving recovery metrics (HRV rising) confirms the rest day was needed and effective.
NEAT as a Health Indicator: A sudden, unexplained drop in your daily NEAT (without a change in routine) could be a subtle sign of low energy, illness, or low mood.
Practical Applications
Weight & Metabolism Management: For those with body composition goals, having a realistic estimate of your TDEE (more accurate than online calculators, as it includes your personal NEAT) is invaluable for nutrition planning.
Fitness Programming: You can see how different types of workouts (long cardio vs. HIIT) affect not just your immediate calorie burn but also your subsequent nighttime recovery. This helps in periodizing training effectively.
Sedentary Behavior Alerts: Some apps can nudge you if you’ve been inactive for too long, promoting a healthy break to walk around—a small intervention with big long-term metabolic benefits.
Holistic Health View: It answers the question, "Am I doing enough?" by showing your active minutes in the context of your overall health dashboard, not just as an arbitrary step goal.
Activity tracking from a ring is less about gamification and more about integration. It completes the picture by quantifying the "output" side of the equation, so you can perfectly balance it with the "input" of recovery that your other metrics so eloquently describe. This balance between exertion and rest is at the heart of the most integrative score your device provides: the Readiness Score.
Readiness & Recovery Scores: Your Daily Prescription
After a night of intricate data collection, your smart ring app doesn't just present you with a series of charts. It synthesizes the most critical recovery-focused metrics into a single, actionable number: your Readiness Score (also called Recovery Score, Body Battery, or similar). This score is the culmination of all the previous sections—the algorithm’s interpretation of whether your body is primed for performance or in need of respite. It is your daily, personalized prescription for activity.
What Goes Into a Readiness Score?
While each brand’s algorithm is proprietary, they universally draw from a core set of nocturnal metrics, weighting them to reflect their importance in signaling recovery status:
Heart Rate Variability (HRV): Typically the most heavily weighted input. High HRV boosts your score; low HRV suppresses it.
Resting Heart Rate (RHR): Compared to your personal baseline. An elevated RHR lowers the score.
Sleep Quality & Quantity: Your Sleep Score, total sleep time, and sleep efficiency are major contributors. Poor or insufficient sleep results in a lower readiness score.
Sleep Balance (Recent vs. Long-term): Many algorithms consider not just last night’s sleep, but whether you’ve been meeting your sleep need over the past several days. A sleep debt will lower your score.
Body Temperature: A significant elevation from your baseline can lower the score as a potential sign of immune activation or stress.
Previous Day’s Activity Load: Some scores incorporate your recent strain to ensure the recommendation accounts for cumulative fatigue.
The result is a score, often on a scale of 1-100 or categorized as "Poor," "Moderate," "Good," or "Optimal."
How to Use Your Readiness Score: From Data to Decision
The score’s power lies in its ability to guide your daily choices objectively, overriding how you might subjectively feel ("I feel tired but should push through" or "I feel great but my body is actually stressed").
High Readiness Score (e.g., 80-100 / "Optimal"): Green Light. Your body has recovered well and is resilient. This is the day to tackle that intense workout, take on a demanding project, or engage in high-energy activities. You are likely to perform at your best and adapt positively to the stress.
Moderate Readiness Score (e.g., 50-79 / "Good/Moderate"): Yellow Light. Proceed, but with awareness. Your body is in a balanced state but not at peak resilience. Consider a moderate-intensity workout, focus on maintenance tasks, and be mindful not to overextend. It’s a good day for technique-focused training rather than max efforts.
Low Readiness Score (e.g., <50 / "Poor"): Red Light. This is a clear signal to prioritize recovery. Your body is under strain—from training, stress, illness, or poor sleep. The prescription is rest: a complete day off, gentle movement like walking or yoga, extra hydration, excellent nutrition, and an early bedtime. Pushing hard on a low score risks injury, illness, and deeper fatigue.
The Psychological Benefit: Permission to Rest
In a culture that often glorifies "grinding," a low readiness score provides data-driven permission to rest. It externalizes the decision, removing guilt. You’re not "being lazy"; you’re "following your body’s data." This can be profoundly liberating and is a key factor in preventing burnout and overtraining syndrome.
Tracking Trends for Macro-Cycles
Beyond daily decisions, your readiness score trend over weeks and months is incredibly revealing:
Consistently Low Scores: Indicate a chronic imbalance. Your lifestyle (stress, training, sleep) is consistently outpacing your recovery capacity. This necessitates a lifestyle audit and likely a planned deload period.
Adaptation Curves: When you start a new training program, you may see scores dip initially (a stress response), then climb higher than baseline as you adapt and become fitter—a beautiful visual representation of supercompensation.
Life Event Impact: You can literally see the physiological impact of a stressful work week, travel, or a social event in your readiness trend.
The Readiness Score is the executive summary of your body’s internal report. It translates complex physiology into a simple, actionable guideline, making advanced biofeedback accessible to everyone. It empowers you to work with your body, not against it. This principle of listening and adapting extends to one of the most personalized applications of this data: understanding the female menstrual cycle.
Menstrual Cycle & Reproductive Health Tracking
For women, the cyclical hormonal fluctuations of the menstrual cycle are not a sidebar to health—they are a central, governing rhythm that influences everything from metabolism and temperature to mood, recovery, and performance. A smart ring, with its ability to track subtle, continuous physiological changes, is uniquely positioned to provide objective insights into this cycle, moving beyond calendar estimates to bio-signal-based awareness.
The Hormonal Symphony and Its Physiological Signatures
The menstrual cycle (typically 21-35 days) is divided into two main phases by ovulation:
Follicular Phase (From period start to ovulation): Characterized by rising estrogen. From a biomarker perspective, this phase often shows more variable, but generally lower, resting heart rate and more stable, sometimes higher, HRV. Basal body temperature is at its lower set point.
Luteal Phase (After ovulation to next period): After the ovary releases an egg, it produces progesterone, which raises core body temperature to support a potential pregnancy. This creates a clear, sustained temperature shift of about 0.3-0.5°C (0.5-1.0°F). This phase is also associated with a slightly elevated resting heart rate and often a decrease in HRV, as progesterone can be stimulating to the nervous system. The body is in a slightly higher metabolic state.
A smart ring tracks these biomarkers—temperature, RHR, and HRV—to identify these phases objectively.
How Cycle Tracking Works with a Smart Ring
Instead of relying solely on user-inputted symptoms or calendar predictions, advanced rings use algorithms to detect the post-ovulatory temperature shift.
Phase Identification: The app will typically show a clear graph where your temperature trend (often a 3-5 day rolling average) shifts upward and stays elevated. This shift, confirmed by other data patterns, is used to confirm that ovulation has likely occurred and you have entered the luteal phase.
Cycle History & Prediction: Over multiple cycles, the ring learns your personal patterns, potentially improving its predictions for future ovulation and period start dates based on your body’s actual signals, not just averages.
Cycle-Centric Dashboard: Some apps re-contextualize all your health data (sleep, readiness, activity) through the lens of your cycle phase, helping you understand why you might feel or perform differently at different times of the month.
Practical Applications and Insights
Fertility Awareness: For those trying to conceive or avoid pregnancy (using a fertility awareness method, FAM, under guidance), the objective temperature data from a ring can be a valuable tool for identifying the fertile window and confirming ovulation. (Note: It should not be used as sole contraception without proper instruction).
Performance & Training Optimization: Understanding your cycle allows for cycle-synced training. The higher-energy, strength-potential follicular phase may be ideal for heavy strength training and high-intensity work. The luteal phase, with its higher core temperature and potential for lower recovery, may be better suited for endurance-focused, lower-intensity training, with a greater emphasis on recovery.
Symptom Management & Health Awareness: Correlating subjective symptoms (mood swings, cramps, bloating, sleep disturbances) with objective data (high RHR, low HRV, temperature changes) can be validating and informative. It can also help identify patterns of PMDD (Premenstrual Dysphoric Disorder) or other cycle-related disorders by showing the severe physiological impact.
A Window into Overall Health: Irregular cycles, anovulatory cycles (no temperature shift), or extremely short/long luteal phases can be early indicators of hormonal imbalances (like PCOS, thyroid issues, or hypothalamic amenorrhea) that warrant a conversation with a healthcare provider.
A Tool for Empowerment and Understanding
For many women, this data demystifies their cycle. It transforms it from a mysterious, sometimes frustrating, event into a comprehensible, predictable rhythm with distinct physiological chapters. It provides the evidence to advocate for oneself, whether with a coach to adjust training plans or with a doctor to discuss symptoms. It underscores that a woman's "normal" is not a single state, but a dynamic continuum, and optimizing health means honoring that rhythm.
As we integrate these profound layers of personal data—from sleep and readiness to our unique hormonal cycles—the question of long-term utility arises. How do we move from daily insights to lifelong health intelligence? This leads us to the critical importance of long-term trends and personal baselines.
Long-Term Trends & Personal Baselines: The True Power of Continuous Data
The single most transformative feature of a smart ring is not its ability to tell you your heart rate at this moment, but its capacity to build a continuous, long-term health record. This shifts the paradigm from reactive medicine ("How do I feel today?") and generic advice ("A normal heart rate is 60-100 BPM") to proactive, personalized health intelligence ("My body's optimal resting heart rate is 52 BPM, and a rise to 58 BPM for three days signals I need to rest").
Why Your Baseline is Your Most Important Metric
Every metric discussed—HRV, RHR, temperature, sleep—is meaningless in isolation without context. That context is YOU. Your personal baseline is your unique physiological fingerprint.
Establishing a Baseline: This requires consistent wear (especially during sleep) for a minimum of 2-4 weeks during a period of "normal" life—not on vacation, not intensely ill, not in peak training. This captures your body's set point under regular conditions.
Dynamic, Not Static: Your baseline isn't fixed forever. As you get fitter, your RHR and HRV baselines may improve. As you age, they may slowly shift. The key is to understand your current baseline range.
The Insight in Deviations: Listening to the Signals
Once your baseline is established, deviations become the primary language of insight.
Acute Deviations (Daily/Weekly): A spike in RHR, a dip in HRV, a rise in temperature. These are your body's short-term communications, indicating stress, poor recovery, or illness onset, as previously discussed.
Chronic Trends (Monthly/Yearly): This is where the deepest wisdom lies. Is your average sleep HRV trending gently upward over six months of consistent meditation and training? That's quantifiable proof of improved resilience. Is your deep sleep percentage slowly declining over a year despite no change in routine? That might be a subtle sign of aging, increased stress, or a need to revisit your sleep hygiene.
Practical Applications of Long-Term Trend Analysis
Fitness & Training Efficacy: You can objectively answer: "Is my training program working?" Look for trends: a downward RHR trend, an upward HRV trend, faster post-workout recovery. These are signs of positive adaptation. A plateau or reversal signals it may be time to change your program.
Lifestyle Experimentation: Go beyond "I think this helps." With trend data, you can run n=1 experiments. Try a new supplement, a different bedtime, a change in diet for 30 days. Did your HRV trend improve? Did your sleep scores get better? The data provides unbiased feedback.
Aging Gracefully & Healthspan: Your long-term data becomes a dashboard of your "healthspan." You can track how lifestyle interventions affect the rate of change in your metrics over years. It empowers you to make choices that not only add years to your life but life to your years.
Informed Health Conversations: Walking into a doctor's office with a graph showing a 3-month trend of elevated nighttime heart rate and poor sleep efficiency is far more powerful than saying "I'm tired." It provides concrete, chronological data for a more productive discussion. Our FAQ page often covers how to best prepare and use your data in such conversations.
Preventative Health Monitoring: Gradual, long-term shifts can be early indicators. A steady, unexplained creep upward in resting heart rate over many months could be a prompt to check in on cardiovascular health, thyroid function, or chronic stress levels.
The Oura Ring vs. Circular Slim: A Detailed Comparison
In the burgeoning smart ring market, two names consistently rise to the top for wellness enthusiasts: the Oura Ring (Generation 3) and the Circular Slim Ring. Both promise to deliver deep insights into sleep, readiness, and recovery, but they take distinct approaches in design, user experience, and underlying philosophy. For the discerning user deciding where to invest, a nuanced, side-by-side comparison is essential.
Brand Philosophy & Core Focus
Oura Ring: Oura positions itself as the holistic "health advisor." Its primary goal is to guide users toward better health through sleep-first insights. The platform emphasizes long-term trends and providing a clear, daily Readiness Score to help you balance activity with recovery. Its branding is wellness-centric, with a strong focus on meditation, stress management, and the foundational role of sleep. You can learn more about this holistic approach in resources like those found on the Oxyzen blog, which explores similar wellness principles.
Circular Slim: Circular leans into being a proactive "health assistant" with a focus on actionable nudges and real-time feedback. Its standout feature, the "Smart Alarm" (Kira), provides subtle vibrations for alarms or health alerts. It emphasizes immediacy—like prompting you to take a breathing exercise if stress is detected—and aims to integrate more seamlessly into the moment-to-moment decisions of your day.
Design, Comfort & Battery Life
Design & Fit:
Oura: Offers a thicker, curved profile (though slimmer than Gen 2) with a flat sensor array on the inside. It's made from titanium and comes in multiple finishes (brushed, matte, shiny). It has a distinctive, tech-forward look that some find a bit bulky, especially on smaller fingers.
Circular Slim: True to its name, it is remarkably thin and lightweight with a minimalist, jewelry-like design. It has a rounded, smooth exterior and sits very flush on the finger, making it less obtrusive and often more comfortable for side sleepers and those not used to wearing rings.
Battery Life & Charging:
Oura: Boasts an impressive 4-7 days of battery life depending on usage. It charges via a proprietary, compact ring dock that is easy to travel with. A full charge takes about 80 minutes.
Circular Slim: Offers 2-3 days of battery life. It charges via a clever, portable charging case (similar to earbuds) that provides multiple full charges on the go. This is a major advantage for travelers, though the more frequent charging is a noted trade-off for its slim form factor.
Core Sensor Technology & Data Accuracy
Both rings utilize similar core sensor suites: PPG for heart rate/HRV/SpO2, a 3-axis accelerometer, and a skin temperature sensor. The differences lie more in sensor placement, algorithms, and data presentation.
Sensor Placement: Oura's flat inner surface aims for consistent skin contact. Circular's sensors are integrated into its slim band, which relies on a precise fit to maintain optimal contact.
Data Presentation:
Oura provides a clean, visually appealing dashboard with a top-level Sleep, Readiness, and Activity score. It excels at presenting long-term trends in a clear, graph-heavy format. Its data feels comprehensive and authoritative.
Circular presents data in a more modular, app-like interface within its companion app. It breaks down metrics into distinct "cards" (Sleep, Energy, Stress, etc.) and emphasizes its smart notifications (Kira) directly on the home screen.
Unique Features & Differentiators
Oura's Key Features:
Sleep Staging Algorithm: Widely regarded as one of the most accurate in the consumer wearable space, validated against polysomnography (PSG).
Period Prediction: A robust cycle tracking feature that uses temperature, HRV, and RHR to predict periods and estimate fertile windows.
Guided Meditations & Content: Integrates with Oura's own library of mindfulness and sleep sound sessions.
Large, Established Ecosystem: Strong partnerships (like with Strava, Natural Cycles) and a large, active community.
Circular's Key Features:
Smart Vibration Alerts (Kira): Its most defining feature. Can be used for silent alarms, inactivity reminders, phone notifications, and—most uniquely—real-time health nudges (e.g., "high stress detected, do a 2-minute breathing exercise").
On-the-Go SpO2 & Heart Rate Checks: Allows for manual spot checks of these metrics directly from the ring or app interface, not just during sleep.
"Energy" vs. "Readiness": Presents an "Energy Score" which factors in sleep, stress, and activity to suggest ideal times for focused work or rest, offering a slightly different angle than Oura's recovery-focused Readiness Score.
Subscription Model & Pricing
This is a critical point of divergence.
Oura Ring: Requires an active Oura Membership subscription ($5.99/month) to unlock all historical data, advanced insights, and personalized guidance. Without it, you only see three basic scores and limited data. The ring itself is a significant upfront investment ($299+).
Circular Slim: Does not have a mandatory subscription fee. All features, data, and insights are included with the purchase of the ring. This is a major selling point for users wary of recurring fees.
Which One is Right for You?
Choose the Oura Ring (Gen 3) if:
Your primary focus is on sleep quality and comprehensive recovery metrics.
You value a polished, established ecosystem with strong third-party integrations.
You prefer a data-dashboard approach and love analyzing long-term trends.
You are comfortable with a subscription model for ongoing access to your full data.
You don't mind a slightly more substantial ring design.
Choose the Circular Slim if:
Discreet, ultra-comfortable design is a top priority (for sleep, daily wear, or small fingers).
You want real-time, actionable nudges and a smart alarm feature directly from the ring.
You are adamantly opposed to a monthly subscription fee.
You value the convenience of the portable charging case.
You want the ability to perform manual spot checks of heart rate and SpO2.
The Verdict: Depth vs. Dexterity
Oura Ring is the deep, authoritative health journal—a tool for those who want to understand the "why" behind their energy levels and are committed to a long-term wellness journey guided by best-in-class sleep and recovery analytics.
Circular Slim is the agile, responsive health companion—a tool for those who want immediate feedback, subtle interventions throughout the day, and a device that prioritizes comfort and freedom from subscriptions.
Both represent the cutting edge of personal health technology, and the best choice hinges entirely on which philosophy and feature set best aligns with your lifestyle and health goals. For more perspectives on how real users integrate these devices into their lives, exploring customer testimonials for similar products can be illuminating. As we compare these leaders, it’s also valuable to understand the technology they share and the metrics they interpret, such as the critical biomarker of overnight oxygen levels.
Blood Oxygen (SpO2) Levels: The Nocturnal Breathing Analysis Revisited
While we previously introduced SpO2 as a metric, its application in sleep analysis warrants a dedicated, deeper exploration. For both the Oura and Circular rings, overnight blood oxygen saturation tracking isn't just about spotting a single low number; it's about mapping the landscape of your breathing throughout the night. This data can reveal subtle inefficiencies and patterns that have profound implications for sleep quality, cardiovascular health, and daytime energy.
Understanding the Nocturnal SpO2 Graph
Your ring’s app will typically display a graph of your SpO2 levels across the night. A healthy graph looks like a relatively flat line hovering between 95-100%, with perhaps minor, infrequent dips.
Baseline SpO2: Your average saturation throughout the night. Consistently below 94% warrants attention and possibly a discussion with a healthcare provider.
Desaturation Events: These are temporary drops in SpO2, usually defined as a decrease of 4% or more from your baseline that lasts for at least 10 seconds. The key metrics derived are:
Event Frequency: How many times these dips occur per hour of sleep.
Event Depth: How low the SpO2 drops during an event.
Event Duration: How long each dip lasts.
What Do These Patterns Indicate?
Occasional, Shallow Dips (1-4 per hour): Can be normal, especially during REM sleep when muscle atonia is most pronounced and breathing can become more irregular.
Frequent, Significant Dips (5+ per hour): This is the hallmark of sleep-disordered breathing. The most common cause is Obstructive Sleep Apnea (OSA), where the throat muscles relax, causing the airway to narrow or close repeatedly. Each closure (apnea) or partial closure (hypopnea) leads to a drop in oxygen, followed by a micro-arousal from sleep to reopen the airway. This cycle can repeat dozens or hundreds of times per night, severely fragmenting sleep without the sleeper being fully aware.
Gradual, Progressive Declines: A slow, steady decline in SpO2 across the night could be related to positional factors (worsening breathing on your back) or other respiratory conditions.
The Ripple Effects of Nocturnal Oxygen Drops
Poor overnight oxygenation isn't just about snoring or fatigue; it creates systemic stress:
Sleep Architecture Fragmentation: Each breathing event causes a micro-arousal, pulling you out of deep or REM sleep. This results in non-restorative sleep, even if you log 8 hours in bed. You wake up feeling unrefreshed.
Cardiovascular Strain: The heart must work harder during low-oxygen episodes, causing blood pressure to spike. Over time, this strain increases the risk of hypertension, atrial fibrillation, and other cardiovascular issues.
Metabolic Impact: Sleep disruption and intermittent hypoxia are linked to insulin resistance and can contribute to weight gain and metabolic syndrome.
Cognitive & Mood Effects: Daytime sleepiness, brain fog, irritability, and decreased focus are common consequences.
How Smart Rings Empower Awareness
For the vast majority of people with undiagnosed mild to moderate sleep apnea, a smart ring can be the first objective indicator that something is amiss. It provides data that moves the conversation from subjective feeling ("I'm always tired") to observable evidence ("My data shows 12 oxygen drops per hour, and my deep sleep is consistently low").
Screening Tool, Not Diagnostic Device: It is crucial to reiterate that consumer rings are wellness screening tools. They are not medical-grade diagnostic polysomnography (PSG). However, their data is compelling enough to justify a visit to a sleep specialist for further evaluation.
Tracking Intervention Efficacy: For those diagnosed with sleep apnea who use a CPAP (Continuous Positive Airway Pressure) machine, a smart ring can be a fantastic tool to track the effectiveness of therapy at home, showing improvements in SpO2 stability and sleep scores.
Actionable Steps from Your SpO2 Data
Review the Trend: Don't panic over one bad night. Look for a consistent pattern over several weeks.
Correlate with Other Metrics: Check if nights with frequent SpO2 dips correlate with poor sleep scores (low efficiency, high wakefulness), elevated morning RHR, and low HRV. This clustering of data strengthens the signal.
Experiment with Lifestyle: Try side-sleeping (using a positional pillow or wearable device), avoid alcohol before bed (a major muscle relaxant that worsens airway collapse), and maintain a healthy weight. Observe if these changes improve your SpO2 graph.
Seek Professional Guidance: If patterns persist, share your data graphs with your doctor. They are a powerful starting point for a clinical conversation.
By illuminating the invisible process of nighttime breathing, SpO2 tracking transforms your smart ring into a guardian of your respiratory health, offering a proactive path to more restorative sleep and long-term wellness. Understanding this silent nocturnal struggle is a cornerstone of interpreting the most common symptom reported by ring users: unexplained fatigue and readiness drops, which often have their roots in a phenomenon known as sleep debt.
Sleep Debt & Recovery: The Mathematics of Rest
One of the most paradigm-shifting concepts a smart ring introduces is the quantification of sleep debt. This moves beyond the simplistic "8-hour rule" into a personalized accounting system for your most vital resource. Sleep debt is the cumulative difference between the sleep your body needs and the sleep you actually get. A smart ring doesn't just track last night's sleep; it calculates this running balance, revealing why you might feel drained even after a "good" night's rest and how true recovery is achieved.
How Your Ring Calculates Sleep Need and Debt
Advanced algorithms, like those in Oura and Whoop, estimate your personal sleep need. This isn't a fixed number but a dynamic target influenced by your recent activity, recovery status, and physiological strain.
Establishing Baseline Need: Over time (typically a few weeks of consistent wear), the ring learns how much sleep you require to wake up with optimal readiness scores. For most adults, this personal need falls between 7-9 hours, but it can vary significantly.
Accounting for Strain: After a day of high physical or mental exertion, the algorithm may increase your sleep target for that night, recognizing your body's heightened need for repair.
Running the Balance: Each night, it subtracts your actual total sleep time from your target sleep time. If you sleep less, you incur debt. If you sleep more, you pay it down. This balance is carried over, often for up to 14 days.
The Physiology of Debt: More Than Just Feeling Tired
Sleep debt isn't just about fatigue; it's a physiological state with measurable consequences that your ring tracks:
Elevated Resting Heart Rate: Chronic partial sleep deprivation keeps your sympathetic nervous system subtly activated.
Suppressed Heart Rate Variability: Your nervous system loses its flexibility and resilience.
Impaired Glucose Metabolism: Just a few nights of short sleep can induce a pre-diabetic state of insulin resistance.
Hormonal Dysregulation: Cortisol (stress hormone) patterns become dysregulated, and leptin (satiety hormone) decreases while ghrelin (hunger hormone) increases.
Cognitive Deficits: Reaction time, focus, and emotional regulation suffer, often before you consciously feel "sleepy."
Your ring’s readiness or recovery score is often the direct numeric representation of your current sleep debt load. A high debt will consistently suppress this score, regardless of other factors.
Strategies for Managing and Repaying Sleep Debt
The smart ring shifts you from a cycle of guilt ("I should sleep more") to a system of strategic management.
Prioritize Consistency First: The single best way to avoid debt is a consistent sleep schedule, going to bed and waking up at similar times every day, even on weekends. This stabilizes your circadian rhythm.
Listen to Your Readiness Score: A low score is a direct recommendation to prioritize sleep. It may mean scheduling an earlier bedtime, canceling late plans, or planning a nap.
Strategic Repayment: You cannot "cash in" a week's debt in one marathon sleep session. The body repays debt most effectively through consistent, slightly extended sleep. If your need is 8 hours and you have a 5-hour debt, aim for 8.5 hours per night for several nights. Your ring’s improving metrics will show you it's working.
The Power of Naps: Short naps (10-20 minutes) can provide acute alertness and marginally help with debt without causing sleep inertia or disrupting nighttime sleep. Some rings can even track naps and incorporate them into your daily sleep total.
Understand Your Debt Tolerance: Some individuals are more resilient to sleep loss than others. Your ring personalizes this for you. You'll learn through data how a single late night or a week of 6-hour sleeps impacts your unique physiology.
The Long Game: From Debt Management to Sleep Equity
The ultimate goal is to move from constantly repaying debt to building sleep equity—consistently meeting or slightly exceeding your sleep need. This is the state where your body isn't just repairing daily damage but building greater resilience, optimizing hormonal function, and enhancing cognitive performance. In this state, your readiness scores will be consistently high, and your body will be primed to handle stress and perform at its best.
By making the invisible visible, sleep debt tracking provides the ultimate rationale for prioritizing rest. It frames sleep not as lost productive time, but as the fundamental investment upon which all daytime performance, health, and happiness are built. For a deeper exploration of sleep science and strategies to build this equity, our comprehensive guides on the Oxyzen blog offer a wealth of actionable advice. As we master the mathematics of rest, we must also learn to interpret the body's most immediate response to life's challenges: the stress response, and its powerful counterpart, resilience.
Stress & Resilience Tracking: Quantifying Your Body's Burden
Modern life is a constant negotiation with stress. Unlike our ancestors who faced acute, physical threats, we now navigate a landscape of chronic, psychological pressures. The insidious part of this "always-on" stress is that we often become numb to its physiological toll—until it manifests as burnout, illness, or anxiety. A smart ring cuts through this numbness, providing an objective, real-time measure of your stress load and, more importantly, your resilience—your body's ability to withstand and recover from that stress.
How Your Ring Measures Stress: The Physiological Signature
Stress isn't a feeling; it's a cascade of measurable biological events orchestrated by the sympathetic nervous system (SNS) and the HPA (hypothalamic-pituitary-adrenal) axis. Your ring detects the following signatures:
Elevated Heart Rate & Reduced HRV: The most direct and immediate sign. Even during sedentary mental work, a stressful thought can cause a noticeable heart rate spike and a corresponding drop in HRV, indicating SNS activation.
Respiratory Rate Increases: Stress triggers faster, shallower breathing. Advanced PPG algorithms can detect this increased respiratory rate from the waveform.
Sleep Disruption: Chronic stress hijacks sleep, reducing deep sleep, increasing nighttime awakenings (WASO), and elevating sleep heart rate. Your sleep score becomes a lagging indicator of your daily stress burden.
Temperature Fluctuations: While less direct, chronic stress can dysregulate the autonomic nervous system, affecting peripheral blood flow and skin temperature patterns.
Some rings, like Circular, use these markers to provide a real-time stress score or send a vibration alert (Kira) when heightened stress is detected, prompting an immediate intervention.
Resilience: The Other Side of the Coin
If stress is the load, resilience is your capacity to carry it. Your ring measures resilience primarily through your recovery metrics:
High Nighttime HRV: Indicates strong parasympathetic (rest-and-digest) activity and the ability to "downshift" after stress.
Rapid Recovery: How quickly your heart rate returns to baseline after a stressful event or a workout.
Stable Sleep Architecture: The ability to achieve deep, uninterrupted sleep despite daily pressures is a hallmark of resilience.
Consistent Readiness Scores: A resilient system will maintain good readiness scores even amidst moderate, manageable stress.
Resilience isn't the absence of stress; it's the efficient management of it. It's like having a high-performance cooling system in a car—the engine can run hot, but it won't overheat.
Using Your Data to Build Stress Intelligence
The goal isn't to eliminate stress (an impossible task) but to develop stress intelligence: the ability to recognize, respond to, and recover from stress effectively.
Identify Your Invisible Stressors: Your ring can reveal stress you've learned to ignore. That "calm" afternoon of back-to-back Zoom calls may show as a 90-minute period of elevated heart rate and suppressed HRV. This awareness is the first step toward management.
Validate the Impact of Positive Practices: See the direct effect of a 10-minute meditation, a walk in nature, or a breathing exercise. Does your heart rate drop and HRV rise within minutes? Does a consistent mindfulness practice lift your baseline HRV over weeks? This turns well-being from an abstract concept into a quantifiable experiment.
Prevent Burnout: A trend of gradually declining HRV, rising RHR, and deteriorating sleep scores, despite constant activity, is the biometric fingerprint of impending burnout. Your ring provides an early warning system to force a rest period before you crash.
Optimize Work-Life Balance: Use your daily readiness or stress scores to structure your day. Schedule demanding cognitive work during periods of high resilience (often mornings, post-good sleep), and administrative tasks for when your metrics indicate lower capacity.
Building Resilience: A Data-Driven Approach
Your ring guides you toward habits that build physiological resilience:
Prioritize Sleep: Nothing builds resilience like consistent, high-quality sleep. It's the foundation.
Incorporate Real Recovery: Schedule downtime. Your ring will show that true recovery (low stress metrics) often requires intentional disconnection, not just passive scrolling.
Train Your Nervous System: Practices like box breathing (inhale 4, hold 4, exhale 4, hold 4) actively stimulate the vagus nerve and parasympathetic system. You can literally watch your HRV improve during a session with live feedback.
Manage Your Training Load: Avoid chronic cardio without adequate recovery. Intersperse intense days with low-intensity movement and rest, guided by your readiness score.
By quantifying the invisible, your smart ring transforms stress from a vague, overwhelming foe into a manageable variable. It empowers you to move from being a victim of your stress response to becoming the architect of your resilience. This profound self-knowledge is what ultimately forges a deep partnership between you and your technology, a journey that begins with understanding the mission behind the device.