Health Metrics Explained: Understanding Trends vs Single Points
Understanding long-term trends versus single data points.
Understanding long-term trends versus single data points.
You wake up, glance at your smart ring, and see a number: a resting heart rate of 62 BPM. Is that good? Is it bad? A week later, it’s 66 BPM. Should you be concerned? In our data-driven world, we’re surrounded by more health metrics than ever before—heart rate variability, sleep scores, blood oxygen, readiness scores, stress levels. But too often, we fixate on the single, solitary data point from this morning, yesterday, or last night. We let a single number define our day, dictate our mood, and drive our health decisions. This is the modern health paradox: more information, yet more potential for misinterpretation and anxiety.
The truth is far more empowering. A single data point is a snapshot—a pixel. The trend is the panoramic picture. Understanding the difference isn't just a nuance of data science; it's the foundational shift that turns a flood of numbers into a roadmap for genuine, personalized wellness. It’s the difference between reacting to noise and responding to signal. This article is your definitive guide to making that shift. We’ll dismantle the myth of the "perfect" single metric, explore the profound science of longitudinal tracking, and show you how to transform every piece of data from your wearable—especially from a sophisticated device like a smart ring—into actionable intelligence for a healthier life.
Your journey to data literacy starts here. We’re moving beyond the snapshot to understand the story.

Imagine judging an entire film by a single, random frame. You might see a character crying and assume it’s a tragedy, missing the context that it’s a moment of joy at a wedding. This is the "Snapshot Fallacy," and it’s the most common and costly mistake we make when interpreting health data. Our brains are wired to seek quick, definitive answers, and a single number provides a tempting, if illusory, sense of certainty.
A solitary metric exists in a vacuum. Your heart rate is elevated this morning. The immediate, anxious conclusion might be stress, poor health, or impending illness. But what if you had a more intense workout yesterday? Drank a glass of wine later in the evening? Are slightly dehydrated? Or even slept in a warmer room? The number, without context, is meaningless—and often alarmist. This fallacy leads to what researchers call "cyberchondria" or "wearable anxiety," where users experience stress directly from the very devices meant to reduce it.
Consider sleep data. A single night of poor sleep, marked by a low "sleep score" or high awake time, can feel like a failure. But zoom out: is this one bad night in a month of excellent rest, or is it the fifth consecutive night of disruption? The former is normal biological variation; the latter is a critical trend requiring attention. The Snapshot Fallacy causes us to overreact to normal fluctuations and potentially underreact to slow, creeping changes that are far more significant. By fixating on points, we become weather-obsessed, reacting to every passing cloud, rather than climate-aware, understanding the seasonal patterns that truly matter for our health. To move beyond this, we must first appreciate the variables that create this daily "noise," which we’ll explore next. For those seeking to deepen their understanding, our wellness blog features numerous articles on data interpretation and managing wearable anxiety.
To accurately interpret any single data point, you must first acknowledge the invisible orchestra of factors influencing it. Your body is not a machine that outputs identical readings under identical conditions; it's a dynamic, living system constantly responding to a myriad of internal and external stimuli. Ignoring these variables is like trying to read a compass while holding a magnet.
These contextual factors fall into several key categories:
The goal is not to control all these variables—that's impossible—but to become aware of them. This awareness transforms confusion into clarity. A higher resting heart rate becomes not an alarming mystery, but a logical outcome: "Ah, I pushed hard in my workout yesterday and had a late dinner. This makes sense." This foundational awareness is what allows us to start connecting dots over time, seeking the signal in the noise. It's the first step toward the most powerful tool in health optimization: the longitudinal trend. Curious about how advanced wearables like the Oxyzen ring are designed to account for this complexity? You can discover more about our technology and philosophy here.
If a single data point is a word, and context is the sentence, then a trend is the entire chapter—or better yet, the unfolding narrative of your health. Longitudinal tracking (observing data over weeks, months, and years) reveals the direction and momentum of your body’s systems. This is where true insight and proactive health management begin.
Trends help you answer the most important questions: Am I improving? Am I recovering well? Is my baseline shifting? For instance, a gradual, consistent downward trend in your resting heart rate over several months is one of the clearest indicators of improving cardiovascular fitness and efficiency. Conversely, a creeping upward trend in your resting heart rate, outside of normal cyclical variation, could be an early warning sign of overtraining, chronic stress, or the onset of illness.
The magic of trend analysis lies in its ability to:
By focusing on trends, you shift from a reactive, anxiety-driven mindset to a proactive, empowered one. You’re no longer asking "Is this number good?" but "What is this data telling me about my body’s current state and trajectory?" This foundational understanding of trends is best applied to specific, vital metrics, starting with the most fundamental: your heart's rhythm at rest.
Resting Heart Rate (RHR)—the number of times your heart beats per minute while you are at complete rest—is arguably the most accessible and informative core vital sign. It’s a direct window into the efficiency of your cardiovascular system and the balance of your autonomic nervous system. But its value is almost entirely in its trend.
A lower RHR generally indicates stronger cardiovascular fitness, as a more efficient heart pumps more blood per beat, requiring fewer beats per minute. However, the absolute number is less important than its behavior over time and in context.
The Trend Tells The Story:
The Contextual Nuance:
Remember the variables? A single elevated RHR reading is likely due to yesterday's hard workout, alcohol, or poor sleep. A trend of elevated RHR demands attention. Furthermore, your RHR has a natural daily and monthly rhythm. It’s typically lowest during deep sleep and can be slightly elevated in the morning as part of the wake-up process (the "cardiovascular surge"). For women, RHR reliably rises in the luteal phase (post-ovulation) of the menstrual cycle due to increased progesterone and body temperature.
Actionable Insight: Don't panic over a single high reading. Note it, and observe the next few days. If it forms an upward trend paired with other metrics (like lowered HRV), it’s your body’s signal to prioritize rest, hydrate, sleep more, and perhaps ease off intense training. Tracking RHR trends is a powerful, passive way to gauge your body’s response to your lifestyle. To see how real users leverage this data for better health, you can read their stories in our testimonials.
If Resting Heart Rate is about the heart’s pace, Heart Rate Variability is about its rhythm—specifically, the subtle, millisecond variations in the time intervals between consecutive heartbeats. Counterintuitively, a higher HRV (more variability) is generally better. It indicates a robust, resilient, and responsive autonomic nervous system. Your heart can swiftly adapt to changes, reflecting a good balance between the stress-response (sympathetic) and rest-and-digest (parasympathetic) branches.
HRV is exceptionally sensitive, making it a premier trend metric. A single low HRV reading is virtually meaningless; its power is in the directional trend.
Interpreting the HRV Trend:
Why HRV Demands a Trend View:
HRV fluctuates dramatically based on the context variables we discussed. It plummets after alcohol. It dips after a hard training session (which is normal and expected—it’s the rebound that matters). It changes with your breathing. Therefore, the only sane way to use HRV is to track its rolling average (e.g., a 7-day average) and observe its trajectory. Is your weekly average climbing? Fantastic. Is it on a steady decline? Time to investigate your stress load and recovery habits.
Personal Baseline is Paramount: One person’s "low" HRV of 30 ms might be their completely healthy normal, while another’s "high" of 80 ms is their baseline. Comparing your HRV to anyone else’s is futile. The only valid comparison is you, yesterday, to you, over the last several weeks. This metric, perhaps more than any other, exemplifies the core thesis: the trend is the truth. For a deeper dive into how to track and influence your HRV, our blog offers expert guidance.
In the quest for better health, sleep has rightfully taken center stage. But the old paradigm of "8 hours is a must" has been replaced by a more nuanced understanding of sleep quality. This is where composite "Sleep Scores" from devices like smart rings come in. However, a score of 85 one night and 72 the next can be a source of unnecessary stress if misunderstood. Deconstructing this score into its trends is key.
A robust sleep score algorithm typically synthesizes several key metrics, each telling part of the story:
The Holistic View: A single night’s low score because you slept 6.5 hours instead of 7.5 but had excellent deep sleep is a very different scenario than a low score from 8 hours of fragmented, restless sleep. The trend will show you your patterns: Do you sleep poorly after late-night screen time? Does alcohol give you a deceptively fast sleep onset but then trash your sleep quality later in the night?
By focusing on the weekly or monthly trend of your sleep score and its components, you move from "I slept badly last night" to "My sleep efficiency has been declining for a week; I need to look at my evening routine and stress levels." This empowers targeted interventions rather than generalized worry.
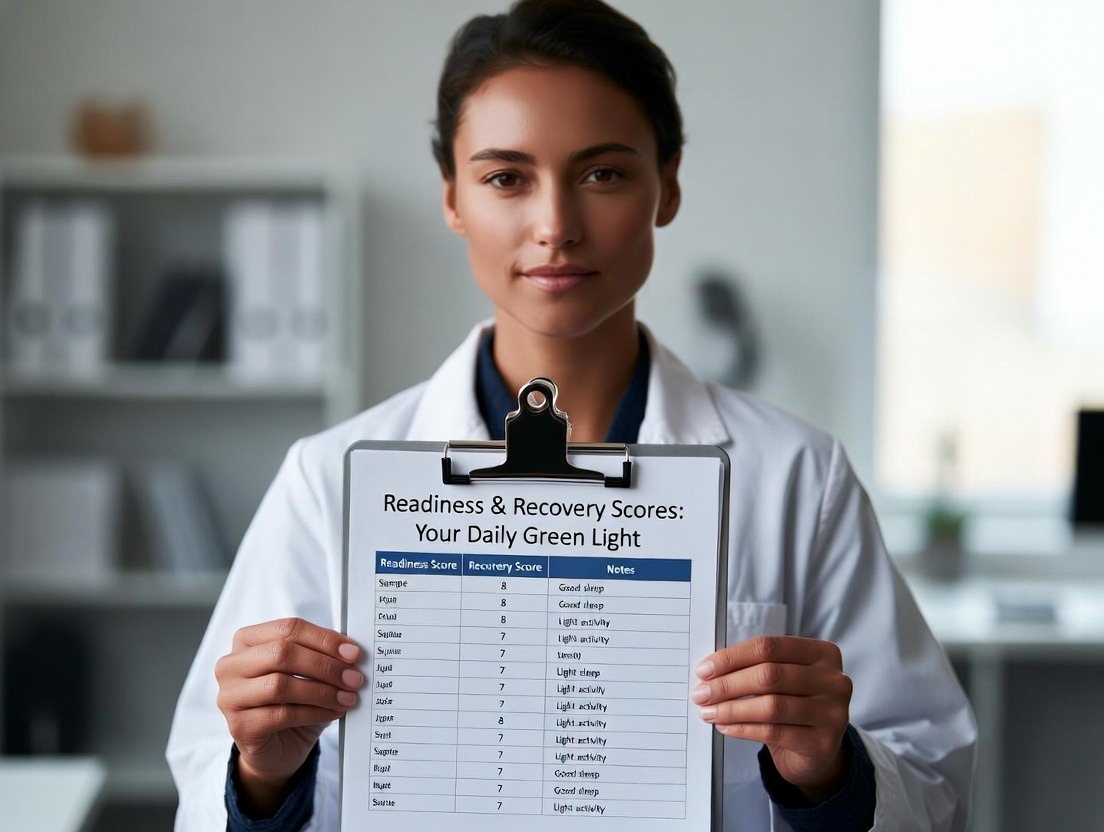
Building on the foundational metrics of RHR, HRV, and sleep, many advanced wellness platforms synthesize this data into a single, actionable metric: a Readiness or Recovery Score. This score aims to answer the day’s most practical question: "Based on how my body recovered last night and my recent strain, how prepared am I for today’s physical and mental demands?"
Think of it as your body’s daily briefing. A high score suggests your systems are resilient and primed to take on stress (like a tough workout or a big project). A lower score is not a judgment, but a recommendation: today is a day for gentler movement, focused recovery, and stress management.
Why This Score is Inherently a Trend Metric:
Your score today is a direct product of the trends in your data over the preceding 24-72 hours. It doesn’t just look at last night’s sleep in isolation; it considers:
Acting on the Signal, Not the Snapshot:
A single low readiness score, especially after a known stressor (a hard race, a stressful day), is expected and should be heeded—take it easy. The real intelligence comes from observing the trend of your readiness scores:
This score transforms raw data into a daily prescription. It helps you align your actions with your body’s actual state, promoting sustainable progress rather than forced overexertion. It embodies the principle of listening to trends. If you have questions about how these scores are calculated or how to use them, our FAQ section provides detailed support.
While we often think of body temperature as a static 98.6°F (37°C), it is, in fact, a dynamic variable that follows a delicate daily rhythm (circadian cycle) and longer-term cycles. Continuous temperature tracking, especially through the sensitive sensors of a smart ring worn 24/7, unlocks insights that intermittent checks with a thermometer completely miss. The value here is almost exclusively in the micro-trends and shifts from your personal baseline.
The Circadian Rhythm: Your body temperature naturally dips to its lowest point in the early morning hours (around 4-5 AM) and rises throughout the day, peaking in the late afternoon or early evening. A well-defined, robust temperature rhythm is a hallmark of a healthy, well-entrained circadian clock, which is foundational for sleep, metabolism, and hormone regulation.
Trends That Signal Change:
The Critical Rule: Forget 98.6. The question is: What is your normal range and rhythm? A reading of 99.0°F might be perfectly normal for your afternoon peak. But if your personal baseline peak is 98.7°F and you see a sustained trend at 99.2°F, that’s a meaningful signal. Like all other metrics, temperature is a story told in chapters, not sentences.
Blood oxygen saturation (SpO2) and respiratory rate (breaths per minute) are vital signs traditionally confined to clinical settings. Now, wearable technology brings them into the realm of daily, trend-based wellness. While single-point measurements have limited utility for healthy individuals, their long-term trends serve as silent sentinels for respiratory and systemic health.
Blood Oxygen (SpO2) Trends:
For most healthy people at sea level, SpO2 will consistently hover between 95-100%. A single reading of 94% is not a cause for alarm. However, trend analysis is powerful:
Respiratory Rate Trends:
This is a profoundly underrated metric. The number of breaths you take per minute at rest is a stable indicator of overall fitness and autonomic nervous system balance. A lower resting respiratory rate (e.g., 12-14 breaths/min vs. 16-20) often indicates better cardiovascular fitness and more efficient gas exchange in the lungs.
The Trend Tells the Tale:
These metrics exemplify the shift from acute monitoring to chronic surveillance. They aren’t for diagnosing a sudden problem today; they are for ensuring your baselines remain stable and detecting slow, negative drifts long before they become serious health issues. To understand how the Oxyzen ring captures these nuanced trends accurately, learn more about our sensor technology and approach.
Health is a balance between stress and recovery. Activity and strain metrics quantify the "stress" side of that equation—the positive, intentional stress of movement and exercise. But without the context of your recovery metrics (the trends we’ve covered in RHR, HRV, sleep, and readiness), activity data is incomplete and can even be counterproductive, encouraging overtraining.
Moving Beyond Steps:
While step count is simple, modern wearables calculate more sophisticated Strain or Exertion Scores. These scores often combine heart rate data (intensity), duration, and sometimes movement type to estimate the total physiological cost of your day’s activity.
The Crucial Integration: Trend vs. Trend:
This is where the magic happens. The ultimate goal is to correlate your Activity/Strain trend with your Recovery/Readiness trend.
Actionable Insight: Never view your activity goal in isolation. Let your recovery trends guide your activity decisions. A low readiness score doesn’t mean "do nothing"; it might mean "go for a gentle walk instead of a tempo run." This dynamic, responsive approach, guided by the interplay of trend data, is the essence of personalized, sustainable fitness.
Now that we’ve deconstructed the key metrics, how do you synthesize them into a coherent, actionable personal health narrative? This is the practical application of everything we’ve discussed. It’s about moving from scattered data points to a curated story of you.
Step 1: Commit to Consistent Tracking.
Trends cannot exist without consistent data. The unique advantage of a smart ring is its 24/7 wearability, providing seamless, passive data collection across all life’s phases—awake, asleep, and at work. This consistency is the bedrock of reliable trends.
Step 2: Establish Your Baselines (The First Month is for Learning).
For the first 3-4 weeks, resist the urge to judge or act on daily numbers. Your sole job is to observe and let your personal baselines for RHR, HRV, sleep stages, and temperature reveal themselves. Note how different activities and lifestyle choices affect your next-day metrics.
**Step 3: Review Weekly, Not Daily.
** Make a weekly ritual—perhaps Sunday morning—to review your trends. Look at the 7-day or 30-day graphs for your key metrics:
Step 4: Look for Correlations, Not Isolations.
This is the master skill. Look at your data holistically.
Step 5: Implement Targeted, Tiny Experiments.
Based on your correlated trends, make one small change. If late meals correlate with poor sleep, experiment with finishing dinner 3 hours before bed for two weeks. Then, check the trend. Did your sleep efficiency improve? Did your morning HRV rise? Let the trend data be your objective report card.
By following this framework, you become the author of your health story, using data as your guide rather than your judge. You’ll learn to trust the trends, understand your body’s unique language, and make decisions that lead to sustained vitality. For more ideas on experiments and lifestyle integrations, explore our blog for community tips and science-backed strategies.
Having established the fundamental philosophy—that trends are truth and single points are mere snapshots—we now embark on the practical application of this wisdom. Understanding your data is the first step; learning to act upon it to sculpt a healthier, more resilient life is the ultimate goal. This portion of our guide transitions from theory to practice, focusing on how to leverage these longitudinal insights to optimize performance, enhance recovery, and build unshakable resilience. We'll explore advanced integrations, tackle common challenges, and provide a roadmap for turning your personalized health narrative into tangible, daily protocols.
The true power of a device like a smart ring is not in its ability to record data, but in its capacity to inform a dynamic, responsive lifestyle. It closes the feedback loop between action and outcome, allowing you to fine-tune your habits with precision. This is where biohacking meets common sense, guided by the unbiased story your body tells each day. Let’s begin by exploring how to use your trend awareness to fuel physical achievement without crossing the line into burnout.
The old model of training was based on rigid schedules and ignoring the body's signals, often leading to plateaus, injury, and fatigue. The new paradigm, empowered by physiological trend data, is autoregulation: letting your body's daily state dictate the intensity and volume of your workout. This is the pinnacle of personalized fitness.
Moving Beyond the Pre-Written Plan:
A training plan written weeks in advance assumes you will recover identically each day. Your trends know better. By integrating your daily readiness or recovery score (a synthesis of HRV, RHR, sleep, and temperature trends), you can adopt a flexible, responsive approach:
Tracking Progressive Overload Through Trends:
The principle of progressive overload—gradually increasing stress to drive adaptation—is best monitored through trends, not workout logs alone.
The Power of the Weekly Review:
Each week, compare your Activity/Strain trend graph with your Recovery metrics trend graph. They should be in a dynamic dance, not a vicious cycle. This macro view prevents the slow creep of chronic fatigue and ensures your fitness journey is sustainable and effective. For athletes and dedicated fitness enthusiasts, this data-driven approach is transformative, turning guesswork into a precise science of adaptation.
Stress is not the enemy; a lack of recovery from stress is. Modern life delivers a constant stream of psychological and emotional stressors, and our physiological data provides an unfiltered readout of their impact. By using trend data, we can move from feeling vaguely "stressed" to having a concrete management strategy.
Identifying Your Stress Signatures:
While a stress score from a wearable provides a moment-to-moment estimate, the real insight comes from how acute stress events affect your trending biomarkers.
Data-Informed Stress Interventions:
Armed with this trend knowledge, you can test interventions with objective feedback:
Your wearable becomes a biofeedback tool, showing you in real-time how different thoughts, interactions, and activities affect your inner state. This awareness is the first and most powerful step toward resilience. You learn which levers to pull to bring your system back into balance, proving to yourself what works. For a deeper look at techniques supported by our community, our blog features user-tested strategies for managing stress with data.
Nutrition is shrouded in universal dogma, but your metabolic response is uniquely personal. While wearables don't measure glucose directly (yet), the trends in key biomarkers provide powerful indirect feedback on how your diet and meal timing are serving your physiology.
Metabolic Indicators in Your Trends:
Conducting a Nutrition Experiment:
Use your trend data to become your own nutrition scientist.
Hydration & Electrolytes: Even mild dehydration can elevate RHR and lower HRV. If you see an unexplained negative blip in your trends, especially after exercise or a hot day, hydration status is the first and easiest variable to check and correct.
We've discussed interpreting sleep scores; now let's use trend data to actively engineer better sleep. The goal is to create an environment and routine that consistently produces high-quality sleep, as validated by your trending data.
Using Trends to Diagnose Sleep Issues:
Actionable Interventions Backed by Your Data:
By treating sleep as the most important recovery session of your day and using trends to guide your adjustments, you transform it from a passive state into an active pillar of health. This proactive approach is at the heart of the mission behind Oxyzen's technology and design philosophy.
One of the most valuable applications of trend tracking is in the realm of illness prevention and navigating recovery. Your body broadcasts signals of distress long before you feel symptoms, and a consistent wear pattern allows you to catch these early whispers.
The Pre-Symptomatic Signature:
A classic pattern often seen in the data before the onset of a common cold, flu, or other infection includes:
Seeing this constellation of trends form is a powerful signal to downshift immediately. Cancel intense workouts, prioritize sleep, hydrate aggressively, and nourish your body. This proactive response can potentially lessen the severity or duration of the illness by allowing your immune system to focus on the threat without the added stress of physical exertion.
Guiding Your Return to Activity:
After an illness, the urge to "get back to normal" can lead to relapse. Your trends provide a safe, objective guide for a graded return:
This data-driven approach removes ego and guesswork from the recovery process, ensuring you come back stronger without compromising your immune system.
While quantitative data from a wearable is objective, it lacks qualitative context. This is where the ancient practice of journaling meets modern biometrics. A simple, consistent logging habit transforms your data from a series of graphs into a rich, cause-and-effect narrative.
What to Log for Maximum Insight:
Spend 2 minutes each evening noting:
The Weekly Correlation Review:
Each week, open your journal alongside your trend graphs. Look for patterns:
This practice builds profound self-knowledge. It moves you from "My HRV is low, I don't know why" to "My HRV is low, and it's consistently linked to my weekly deadline. I need to manage my Tuesdays differently." It provides the "why" behind the "what" of your data. For inspiration on how to start and maintain this powerful habit, our community often shares their methods on the blog.
With great data comes great responsibility. It is possible to become overwhelmed, checking your app compulsively and letting a single low score ruin your day. This defeats the entire purpose. The goal is informed awareness, not obsessive control.
Healthy Data Hygiene Habits:
Remember, the data is a servant, not a master. Its job is to provide an objective perspective to inform your subjective experience. If it's harming your mental well-being, the protocol needs to change. A balanced approach is key, which is why we've compiled common questions and support on finding that balance in our FAQ.
A one-size-fits-all approach to health data is inherently flawed. Your age, sex, hormonal status, and lifestyle phase dramatically alter your baselines and how you should interpret trends. Personalization must account for these macro factors.
For Women: Honoring the Cycle
For anyone with a menstrual cycle, ignoring it renders most trend data unintelligible. Hormonal fluctuations create predictable, healthy patterns:
Tracking your cycle alongside your biometrics validates these patterns, reducing anxiety and allowing you to work with your physiology, not against it.
Aging & Changing Baselines:
As we age, certain baselines naturally shift. Average RHR may increase slightly, and HRV may show a gradual, long-term declining trend. This is normal. The key is to differentiate this slow, natural drift from an accelerated decline caused by lifestyle factors. The principles remain the same: establish your current baseline and watch for significant deviations from your personal trend.
The Athlete vs. The Desk Worker:
Baselines and responses will be vastly different. An endurance athlete may have a RHR in the 40s and an HRV over 100 ms. A healthy, sedentary individual may have a RHR in the 60s and an HRV of 40 ms. Comparing absolute numbers is useless. Each person must track their own trends and understand their own personal "zones." The value is in the individual's direction of travel.
Understanding these layers of context is what separates a sophisticated user from a casual checker. It’s the final layer of personalization that makes the data truly yours.
This is a critical boundary to understand: Your wearable is a wellness tool, not a medical device. It is designed for lifestyle optimization and education, not for diagnosis, treatment, or management of disease. However, when used wisely, it can create a powerful bridge to more productive healthcare partnerships.
How to Use Data with Your Doctor:
What Not to Do:
A well-prepared summary of your long-term trends turns you into an informed participant in your health, providing objective, longitudinal data that a single office visit could never capture. It can help pinpoint the timing of issues and measure the impact of prescribed treatments on your daily physiology. To see how others have successfully partnered with their healthcare providers, you can read about user experiences on our testimonials page.
The journey we've outlined—from single points to insightful trends to personalized action—represents the current forefront of consumer health technology. But this is just the beginning. The future lies in even deeper integration, prediction, and seamless guidance.
Predictive Analytics & AI Coaches: The next evolution is moving from descriptive ("This is what happened") to predictive ("This is what's likely to happen"). Imagine your device analyzing your multi-month trends and giving you a gentle notification: "Your recovery trend has been declining for 5 days. Based on your history, this pattern often precedes a mild illness. Consider prioritizing rest tonight." Or an AI coach that suggests: "Your data shows you consistently recover best with 48 hours between strength sessions. Let's adjust your upcoming week's plan."
Multi-Modal Data Fusion: The most complete picture will come from correlating data from multiple, complementary sources—your smart ring (sleep, continuous HRV, temperature), a continuous glucose monitor (metabolic response), and even periodic blood tests (nutrient levels, hormones). Synthesizing these streams will unlock hyper-personalized insights into how nutrition, exercise, and sleep interact uniquely for you.
Passive, Ambient, and Actionable: The ultimate goal is for technology to fade into the background while its insights become more profound and its suggestions more seamlessly integrated into your life. The device learns your patterns so well it can nudge you at the perfect moment with the perfect, tiny action to maintain your well-being.
This future is one of empowerment, where technology doesn't make us slaves to data but uses data to give us back our time, our health, and our peace of mind. It starts with the fundamental shift you are now mastering: valuing the long-term narrative over the momentary snapshot.
You have journeyed from understanding the fundamental principle—that trends are truth—to applying this wisdom across every facet of your wellness. You are no longer a passive observer of data points, but an active author of your health narrative. Now, we ascend to the final tier: synthesis, sustainability, and foresight. This portion is for the advanced practitioner. We will explore how to weave these data streams into a seamless, holistic life system, anticipate the future of bio-tracking, and navigate the profound ethical landscape this technology opens. This is about moving beyond optimization to integration, creating a lifestyle where data serves a greater vision of long-term flourishing without consuming your attention.
The ultimate sign of mastery is when the tools become invisible, and the insights become intuition. Here, we build that bridge. We’ll design your personal dashboard, explore cutting-edge correlations, establish principles for long-term use, and peer into the horizon of what’s next. Your data is more than a report card; it’s the compass for a lifetime of vitality.
With a dozen metrics and trends at your fingertips, the risk of fragmentation is real. The solution is to create a personalized "dashboard"—a mental and practical framework that prioritizes the 3-5 key trend lines that matter most to your current goals, while keeping the rest in supportive view. This is the art of focus within the science of tracking.
Step 1: Define Your Primary Objective (The 12-Week Focus)
Health is multidimensional, but trying to optimize everything at once leads to frustration. Choose one primary focus for a 12-week cycle. Examples:
Step 2: Select Your Lead Indicators (The North Star Metrics)
Based on your objective, choose 2-3 primary metrics whose trends will be your clearest measure of progress.
Step 3: Establish Your Supportive Context Metrics
These are the variables you monitor to understand why your lead indicators are moving.
Step 4: Create Your Weekly Review Ritual
This is the non-negotiable habit that brings the system to life. Each week, in a dedicated 20-minute session:
This systematic approach prevents data overload and creates a clear, actionable feedback loop aligned with your personal goals. To see how others structure their review process, our community often shares their templates on the blog.
As an advanced user, you can look for relationships between trend lines that reveal sophisticated aspects of your physiology. This is where you move from tracking metrics to understanding systems.
The HRV-RHR Relationship (The Recovery Gap):
Plotting your HRV trend and RHR trend on the same graph (even mentally) is powerful. In a state of good recovery and adaptation, they should move in opposite directions: HRV trending up, RHR trending down. When they start to move in the same direction (both trending down, or HRV down while RHR is static), it often indicates your system is under non-adaptive stress—you’re not recovering from the load you’re under.
Temperature-RHR Coupling (Circadian Health):
A strong, predictable circadian rhythm is shown by a clear inverse relationship between your daytime temperature (gradually rising) and your RHR (at its lowest at night, rising upon waking). If this coupling becomes erratic—for instance, your temperature rhythm flattens while your RHR becomes more variable—it’s a sign of circadian disruption, often linked to poor sleep hygiene, jet lag, or irregular schedules.
Activity Strain vs. Sleep Depth Correlation:
This is a direct measure of your recovery efficiency. After days of higher activity strain, does your deep sleep percentage show a corresponding increase (a positive adaptive response) the following night? Or does it decrease or stay flat, suggesting your system is struggling to handle the repair work? A strong positive correlation here is a hallmark of robust health.
Respiratory Rate & HRV (Autonomic Synchronicity):
Your resting respiratory rate and HRV are both governed by the autonomic nervous system. In a calm, parasympathetic state, you should see a lower respiratory rate and a higher HRV. Tracking both can give you a more nuanced picture of your autonomic balance than either one alone. A trend of rising respiratory rate paired with falling HRV is a very strong indicator of accumulating sympathetic (stress) overload.
By observing these inter-metric relationships, you become a true biographer of your body’s complex story, capable of fine-tuning with remarkable precision.
The goal is not to be tethered to a device for months, but to engage in a lifelong conversation with your body. This requires a philosophy of use that prevents burnout and ensures the practice remains enriching, not enslaving.
1. The Principle of Seasonal Disengagement:
Commit to taking 1-2 weeks completely off from tracking every 3-4 months. Go on vacation and leave the ring at home. This serves critical purposes:
2. The Principle of Evolving Goals:
Your dashboard should not be static. As you achieve one objective, consciously shift your 12-week focus. Perhaps after a performance cycle, you shift to a stress resilience or metabolic health focus. This keeps the practice dynamic and aligned with your life’s changing chapters.
3. The Principle of Minimum Effective Dose (MED):
What is the least amount of tracking and analysis needed to maintain your gains and course-correct? For some, after a year of deep learning, this might mean simply wearing the device for sleep and recovery tracking, and only checking the weekly readiness score for training guidance. Find your personal MED to make the technology a sustainable partner.
4. The Principle of Grace:
Life is not a lab. There will be weeks of poor data, sick days, holidays, and life events that disrupt all your trends. The advanced practitioner sees these not as failures, but as part of the rich human dataset. The goal is the overall trajectory over years, not perfection over weeks.
Adopting these principles ensures that your pursuit of quantified self remains a source of empowerment and curiosity for decades, not a fleeting obsession. For more on building a sustainable practice, our founding story discusses the vision behind creating a tool for lifelong wellness.
As we invite these devices deeper into our lives, we must consciously address the weighty questions of privacy, ownership, and the psychological impact of constant self-surveillance. Being an educated user means being a vigilant steward of your most personal data.
Who Owns Your Biometric Data?
This is the paramount question. Before using any device, understand its privacy policy. Reputable companies will be transparent:
You should feel confident that you are the ultimate owner of your data stream. It is a record of your life, and its use should be governed by your informed consent. We believe strongly in this principle, which is detailed in our company's commitment to user privacy and transparency.
The Risk of External Scoring & Insurance Implications:
A dystopian concern is the potential for health data from wearables to be used by insurers, employers, or financial institutions to adjust premiums, deny coverage, or make hiring decisions. While largely hypothetical now, it’s a frontier requiring careful regulation and personal vigilance. Support policies and companies that advocate for strict consumer protections against such uses.
Psychological & Societal Impacts:
Beyond the individual risk of anxiety, we must consider the societal lens. Does constant tracking promote a hyper-individualistic, optimized self at the expense of community and acceptance? Could it widen health disparities? As advanced users, we have a responsibility to advocate for a humane, balanced narrative around this technology—one that emphasizes self-knowledge and prevention over punitive perfectionism.
Navigating this landscape thoughtfully is part of the maturity that comes with mastering this powerful tool.
The technology in your smart ring is impressive, but it is merely the foundation for a coming revolution in personalized health. Understanding this trajectory helps you contextualize today’s tools and anticipate tomorrow’s possibilities.
Continuous, Non-Invasive Biomarker Sensing:
The holy grail is moving beyond optical heart rate and temperature to other key biomarkers:
Advanced AI & Predictive Health Partners:
The future is predictive and prescriptive. Imagine an AI health coach that doesn’t just describe your sleep, but says: *"Based on your light exposure today, current body temperature, and last night's sleep deficit, I predict you will have difficulty falling asleep tonight. I suggest a 15-minute wind-down ritual starting at 9:45 PM."* This AI will learn your unique patterns so deeply it can intervene proactively to keep you in your optimal zone.
True Interoperability & The Health Data Ecosystem:
The future winner is not the device with the most sensors, but the platform that best integrates data from all sources: your ring, your CGM, your electronic medical record, even your genetic data. This integrated "health graph" will provide a holistic view no single device can match, allowing for truly personalized medicine.
As users, our role is to demand these advances be implemented with robust ethics, unwavering privacy, and a focus on genuine human well-being over mere engagement metrics.
Let’s crystallize everything into a concrete, actionable 90-day plan to cement your journey from novice to master.
Days 1-30: The Foundation Phase
Days 31-60: The Intervention Phase
Days 61-90: The Integration & Systems Phase
By the end of 90 days, the practice will be ingrained, and you will have tangible, data-validated proof of what works for your unique biology.
We began this journey confronting the Snapshot Fallacy—the anxiety of the single data point. We learned to see the variable context, to trust the power of the trend, and to decode the language of our bodies through RHR, HRV, sleep, temperature, and breath. We progressed to applying this knowledge, optimizing our fitness, building resilience, refining nutrition, and engineering recovery. Now, we arrive at the synthesis: building a personal system, anticipating the future, and wielding this knowledge with ethics and grace.
The ultimate goal was never a perfect sleep score or an astronomical HRV. The goal was always agency. Agency over your health, your energy, and your understanding of your own life force. The data, and more importantly, the trends, return that agency to you. They cut through the noise of generic health advice and provide a personalized, objective mirror.
Your smart ring, or any advanced wearable, is therefore more than a tracker. It is a lens for self-discovery, a compass for navigation, and a gentle guardian that whispers insights drawn from the silent language of your physiology. It empowers you to move from reactive healthcare to proactive self-care, from guessing to knowing, from optimizing fragments to integrating the whole.
As you move forward, remember the core tenet: you are not a machine to be optimized, but a human to be understood. Let the data inform you, not define you. Let trends guide you, not govern you. Use this powerful tool to cultivate a life of vitality, resilience, and profound self-knowledge—a life where technology serves your humanity, not the other way around.
This concludes our comprehensive guide. May your trends be ever in your favor, and may your journey toward wholeness be rich, informed, and deeply your own. For continued learning and support on this path, remember that our blog is always updated with the latest insights, and our team is dedicated to supporting your journey.
Your Trusted Sleep Advocate: Sleep Foundation — https://www.sleepfoundation.org
Discover a digital archive of scholarly articles: NIH — https://www.ncbi.nlm.nih.gov/
39 million citations for biomedical literature :PubMed — https://pubmed.ncbi.nlm.nih.gov/
Experts at Harvard Health Publishing covering a variety of health topics — https://www.health.harvard.edu/blog/
Every life deserves world class care :Cleveland Clinic - https://my.clevelandclinic.org/health
Wearable technology and the future of predictive health monitoring :MIT Technology Review — https://www.technologyreview.com/
Dedicated to the well-being of all people and guided by science :World Health Organization — https://www.who.int/news-room/
Psychological science and knowledge to benefit society and improve lives. :APA — https://www.apa.org/monitor/
Cutting-edge insights on human longevity and peak performance:
Lifespan Research — https://www.lifespan.io/
Global authority on exercise physiology, sports performance, and human recovery:
American College of Sports Medicine — https://www.acsm.org/
Neuroscience-driven guidance for better focus, sleep, and mental clarity:
Stanford Human Performance Lab — https://humanperformance.stanford.edu/
Evidence-based psychology and mind–body wellness resources:
Mayo Clinic — https://www.mayoclinic.org/healthy-lifestyle/
Data-backed research on emotional wellbeing, stress biology, and resilience:
American Institute of Stress — https://www.stress.org/

