How Sleep Trackers Actually Work (The Technology Explained)
Understanding how sleep trackers actually work demystifies the technology. This explanatory guide breaks down sensors including optical heart rate monitors, accelerometers, and temperature sensors, explaining how devices measure movement, physiology, and rest stages to generate sleep insights and quality scores.
How Sleep Trackers Actually Work (The Technology Explained)
For centuries, sleep was a profound mystery—a nightly voyage into darkness with no map or logbook. We knew we needed it, and we could feel the devastating effects of missing it, but the what, why, and how of those precious hours remained locked in subjective experience. Did I sleep well? Did I dream? Did I even move? The answers were fuzzy at best.
Today, that mystery is being decoded not in a sleep lab, but on our wrists, under our mattresses, and, most discreetly, on our fingers. Sleep trackers have moved from niche gadgets to mainstream wellness tools, promising to unveil the secrets of our slumber. But as you stare at a dashboard showing your light, deep, and REM cycles, a critical question arises: How does this device actually know I was dreaming?
The journey from raw, unconscious biological signals to a polished morning sleep score is a marvel of modern sensor technology, data science, and physiological understanding. It’s a process that involves capturing whispers from your autonomic nervous system, filtering out the noise of modern life, and interpreting a complex biological story. Whether you’re a biohacker optimizing for peak performance, someone struggling with chronic fatigue, or simply curious about your own health, understanding this technology is key to using it wisely.
This article is your definitive guide to the hidden world inside your sleep tracker. We’ll move beyond the marketing claims and dive deep into the sensors that capture your body’s nocturnal signals, the algorithms that transform that data into sleep stages, and the surprising science—and limitations—behind the scores you see. By the end, you’ll not only know how your tracker works, but you’ll also become a more informed interpreter of your own sleep data, empowering you to make meaningful changes rather than chasing arbitrary numbers.
From Ancient Observations to Algorithmic Insights: A Brief History of Sleep Monitoring
To truly appreciate the technology in a modern sleep tracker, we must first understand what it’s attempting to measure and replicate. The gold standard for sleep analysis isn’t a wearable device; it’s a clinical procedure called polysomnography (PSG). Conducted in a specialized lab, PSG is a multi-sensor tour de force. It involves:
Electroencephalography (EEG): Electrodes on the scalp measure brain wave activity (frequency and amplitude), which is the primary determinant of sleep stages.
Electrooculography (EOG): Electrodes near the eyes detect the subtle rolling movements of light sleep and the rapid, jerky movements of REM (Rapid Eye Movement) sleep.
Electromyography (EMG): Electrodes on the chin and limbs measure muscle tone. A crucial marker of REM sleep is near-complete muscle paralysis (atonia), preventing you from acting out your dreams.
Additional Sensors: These often include sensors for heart rate (ECG), breathing effort, blood oxygen saturation (pulse oximetry), and audio/video recording.
A sleep technologist monitors this symphony of data in real-time, and later, a trained clinician scores it in 30-second epochs according to standardized rules (like the AASM Manual). This process meticulously catalogs wakefulness, N1 (light sleep), N2 (deeper light sleep), N3 (deep or slow-wave sleep), and REM sleep.
The first at-home sleep trackers were a far cry from this. Early actigraphy devices, used in research since the 1970s and 1980s, were simple motion loggers. Worn on the wrist, they contained an accelerometer to detect movement. The core assumption was straightforward: when you’re still, you’re asleep; when you move, you’re awake. While useful for gauging general sleep-wake patterns over long periods, this method was famously blind to sleep stages. You could be lying perfectly still in light sleep or in the middle of a vivid REM cycle, and the device would score it the same.
The revolution began with the convergence of miniaturized sensors, ubiquitous smartphone connectivity, and advances in machine learning. Consumer devices started to incorporate optical heart rate sensors, then heart rate variability (HRV) sensors, and later, pulse oximeters and temperature sensors. They were no longer just measuring movement but physiological arousal. This shift—from tracking gross motor activity to inferring the state of the autonomic nervous system—is what powers the modern sleep tracker.
Companies like Oura, Whoop, and Apple, and emerging innovators like Oxyzen, realized that by combining multiple biometric data streams, they could train algorithms to approximate the sleep staging done in a lab. The device doesn’t "see" your brain waves, but by analyzing the interplay of your heart rate, HRV, movement, and body temperature, it can make a highly educated guess about your sleep state. It’s a brilliant workaround, turning the wrist or finger into a window into the nervous system. For a deeper look at how one company is approaching this from a holistic wellness perspective, you can explore Oxyzen’s story and vision on their about page.
This journey from lab to living room sets the stage for our deep dive. Every graph on your sleep app is the end product of a complex technological chain. Let’s start by examining the first link: the sensors themselves.
The Silent Sentinels: Core Sensors in Modern Sleep Trackers
Your sleep tracker is, at its heart, a data collection platform. While it sleeps on your body, its sensors are working tirelessly through the night, sampling your physiology hundreds to thousands of times. Each sensor type captures a different piece of the puzzle. Understanding their strengths and inherent limitations is the first step to becoming data-literate.
1. The Accelerometer: The Veteran Watchman
The workhorse of wearables, the accelerometer is a micro-electromechanical system (MEMS) that measures proper acceleration—essentially, movement in three-dimensional space (X, Y, and Z axes).
How it Works for Sleep: It detects gross body movements (tossing, turning) and more subtle motions like the rise and fall of your chest with breathing or the minute movements of your limbs.
What it Tells the Algorithm: Prolonged periods of very low movement suggest sleep onset. Frequent or large movements often indicate restlessness, awakenings, or changes in sleep stage. It remains the primary tool for detecting "wake" periods after sleep has begun.
The Limitation: It cannot distinguish between sleep stages on its own. Lying perfectly still in front of a screen (so-called "quiet wakefulness") can be mis-scored as sleep, while the micro-movements of REM sleep can sometimes be misread as light sleep.
2. The Optical Photoplethysmogram (PPG) Sensor: The Heartbeat Listener
This is the technology behind heart rate monitoring on most wearables. A small LED (usually green) shines light into the skin, and a photodiode measures the amount of light reflected back.
How it Works: Blood absorbs green light more effectively than surrounding tissue. With each heartbeat, blood volume in the capillaries increases briefly, absorbing more light. The photodiode detects these tiny, rhythmic fluctuations in reflected light, which are translated into a pulse wave.
What it Tells the Algorithm:
Heart Rate (HR): The beats per minute. During sleep, HR generally decreases as you move into deep sleep and becomes more variable and elevated during REM sleep, similar to wakefulness.
Heart Rate Variability (HRV): This is the critical derivative. HRV is the measure of the subtle variations in time intervals between consecutive heartbeats. It’s a powerful, non-invasive window into your autonomic nervous system. High HRV (more variability) is associated with parasympathetic ("rest-and-digest") dominance, typical of deep, restorative sleep. Low HRV suggests sympathetic ("fight-or-flight") activation, which occurs during stress, illness, or light sleep. The algorithm uses trends in HRV, in concert with HR and movement, to pinpoint transitions between light, deep, and REM sleep.
The Limitation: PPG is notoriously sensitive to motion artifact. A poor fit or a sleeping position that puts pressure on the sensor can create noise, leading to gaps or inaccuracies in the heart rate data. This is one reason why form factors like rings, which are worn on a finger with denser vascularity and less bending, can sometimes provide more consistent nocturnal readings than wrist-worn devices.
3. The Skin Temperature Sensor: The Thermal Regulator
Often a simple, precise thermistor, this sensor monitors the temperature at the surface of your skin.
How it Works: Your core body temperature follows a circadian rhythm, dropping in the evening to initiate sleep and reaching its nadir in the early morning hours. This core temperature drop is facilitated by vasodilation—widening of blood vessels in the extremities (like hands and feet) to release heat. A wearable sensor tracks this distal skin temperature.
What it Tells the Algorithm: A detectable drop in skin temperature correlates with sleep onset. Furthermore, temperature trends can help corroborate other data; for instance, REM sleep is associated with more variable temperature regulation (your body temporarily loses some ability to thermoregulate). Long-term trends in nocturnal temperature can also be a leading indicator of illness, ovulation in women, or changes in metabolic health.
The Limitation: It measures skin temperature, not core temperature, which is influenced by ambient room temperature and bedding. The algorithm must account for these external factors, which isn't always perfect.
4. The Pulse Oximeter (SpO2): The Oxygen Analyst
A more advanced cousin of the PPG sensor, pulse oximetry typically uses red and infrared LEDs. Hemoglobin with oxygen (oxyhemoglobin) absorbs infrared light differently than hemoglobin without oxygen (deoxyhemoglobin).
How it Works: By comparing the absorption of red and infrared light, the sensor can calculate the percentage of oxygen-saturated hemoglobin in your blood—your blood oxygen saturation (SpO2).
What it Tells the Algorithm: In healthy sleep, SpO2 remains stable. The primary use in consumer sleep tracking is to screen for significant nocturnal desaturations—drops in blood oxygen—which can be indicative of sleep-disordered breathing like sleep apnea. Some algorithms also use subtle, cyclical variations in SpO2 (which may correlate with breathing effort) to estimate respiratory rate.
The Limitation: Consumer-grade SpO2 is less accurate and precise than medical devices, especially during movement or with poor perfusion (cold hands). It is best used for identifying trends and significant events rather than for absolute medical diagnosis.
5. The Galvanic Skin Response (GSR) Sensor: The Stress Gauge
Less common but present in some advanced devices, GSR measures the electrical conductivity of your skin.
How it Works: Skin conductivity increases with sweat secretion, which is controlled by the sympathetic nervous system.
What it Tells the Algorithm: Sudden spikes in GSR can indicate moments of arousal, stress, or excitement—even during sleep. This can help the algorithm identify disturbances or micro-awakenings that might be missed by other sensors.
The Limitation: It is highly sensitive and can be triggered by many factors, including ambient humidity, making it a challenging signal to interpret in isolation.
No single sensor is the star. The magic—and the accuracy—of a modern sleep tracker comes from the sensor fusion. The algorithm cross-references the story told by your heart with the story told by your movement and the story told by your temperature. When all signals align—low movement, dropping heart rate, rising HRV, cooling skin—the confidence in scoring "deep sleep" is high. When signals conflict, the algorithm uses weighted probabilities and its trained model to make the best call. For those interested in how these sensors are integrated into a seamless user experience, you can discover how Oxyzen's approach to sensor fusion aims for holistic accuracy on their main site.
Beyond the Beat: The Critical Role of Heart Rate Variability (HRV)
We touched on HRV as a key output of the PPG sensor, but it deserves its own deep dive. If you're serious about understanding your sleep data, HRV is the metric to watch. It’s not just another number; it’s considered one of the most powerful, non-invasive biomarkers for overall resilience, autonomic nervous system balance, and recovery status.
What is HRV, Really? Contrary to popular belief, a healthy heart does not beat with the metronomic regularity of a drum machine. The time between successive heartbeats (the R-R interval) constantly fluctuates by milliseconds. These fluctuations are orchestrated by the continuous tug-of-war between your sympathetic (SNS) and parasympathetic (PNS) nervous systems.
The SNS (Gas Pedal): Releases adrenaline and noradrenaline, preparing the body for action. It decreases HRV and increases heart rate.
The PNS (Brake): Primarily via the vagus nerve, releases acetylcholine, promoting rest, recovery, and digestion. It increases HRV and can slow heart rate.
High HRV indicates a heart that is responsive and adaptable—a system with strong "vagal tone" that can apply the brake effectively. It is consistently associated with better cardiovascular health, stress resilience, and athletic recovery. Low HRV suggests a system under stress, fatigued, or potentially inflamed, where the gas pedal is slightly stuck on.
How Sleep Trackers Measure HRV Consumer devices don't measure HRV directly; they calculate it from the pulse wave (PPG) or, in rare cases, from an ECG signal. The most common method used is RMSSD (Root Mean Square of Successive Differences), which is well-suited for the shorter, noisier data samples collected overnight. The device collects inter-beat intervals over a period (e.g., a 5-minute window during a sleep phase), filters out noise from movement or arrhythmias, and runs the RMSSD calculation.
HRV’s Nocturnal Narrative During Sleep Your HRV follows a distinct pattern through the night that is instrumental for sleep staging algorithms:
Wakefulness & Sleep Onset: HRV is relatively low as the mind is active. As you drift off, the PNS begins to engage, and HRV starts to rise.
Light Sleep (N1 & N2): HRV continues to increase as the body settles into sleep.
Deep Sleep (N3 - Slow-Wave Sleep): This is the peak of physical restoration. The PNS is dominantly active, leading to the highest HRV of the night and the lowest heart rate. The algorithm looks for this signature combination—low movement, low HR, high HRV—to label a period as deep sleep.
REM Sleep: The brain is active, dreaming occurs, and the body is paralyzed. Autonomic activity becomes more chaotic and "awake-like." HR increases and becomes more variable, while HRV drops significantly, sometimes to near-waking levels. This stark contrast to deep sleep is a major clue for the algorithm.
Cycling: This pattern repeats through 4-5 sleep cycles each night, creating a recognizable "sawtooth" pattern of HRV that the algorithm learns to map onto the sleep architecture.
By tracking your nightly average HRV and its long-term baseline, your sleep tracker isn't just judging last night's sleep; it's assessing your overall recovery and readiness. A sharp drop below your personal baseline can be an early warning sign of impending illness, overtraining, or excessive stress, often before you feel symptoms. This is why many holistic wellness platforms, like those discussed in the Oxyzen blog, emphasize HRV trend analysis over daily scores. You can find deeper dives into interpreting this vital metric in their resource library.
The Invisible Architect: The Sleep Staging Algorithm
We now have a stream of raw data: movement counts, heart rate points, inter-beat intervals, temperature readings. This is the chaotic, noisy input. The sleep staging algorithm is the brilliant translator that turns this cacophony into a coherent story—your sleep hypnogram. This process is a multi-stage feat of data science.
Step 1: Data Preprocessing & Cleaning
The raw sensor data is messy. The first job of the algorithm is to clean it up.
Filtering Noise: It applies digital filters to remove high-frequency noise (e.g., from sensor jitter) and low-frequency drift (e.g., slow temperature changes from the room cooling).
Motion Artifact Rejection: For PPG data, this is crucial. The algorithm identifies periods of high accelerometer activity and either attempts to correct the heart rate signal or flags it as "unreliable," potentially interpreting it as a wake period.
Smoothing and Averaging: Data is often smoothed (e.g., using rolling averages) to reveal underlying trends, not momentary blips.
Step 2: Feature Extraction
This is where the cleaned data is transformed into meaningful "features" that represent physiological states. The algorithm doesn't process every single heartbeat; it looks at summaries over short epochs (typically 30 seconds to 5 minutes, matching clinical standards). For each epoch, it might calculate:
Movement: Mean and variance of accelerometer data.
Cardiac: Average heart rate, RMSSD HRV, breathing rate (derived from rhythmic patterns in the PPG or HR signal).
Other: Rate of skin temperature change, SpO2 baseline and any dips.
Step 3: The Classification Engine (Machine Learning Model)
This is the core of the system. Modern sleep staging relies on supervised machine learning models.
The Training Phase: During development, the company collects a massive "ground truth" dataset. They have thousands of people wear their prototype device while simultaneously undergoing a clinical PSG study in a lab. For every 30-second epoch, they have the true sleep stage from the PSG (the label) and all the sensor features from their device (the input).
Model Training: A machine learning model (commonly a Random Forest, Gradient Boosting model, or neural network) is "trained" on this data. It iteratively learns the complex, non-linear relationships between the combination of features (e.g., "low movement + HR drop of 10% + HRV increase of 25%") and the correct sleep stage label (e.g., "N3 - Deep Sleep").
The Output: The result is a trained model that contains a probabilistic map. When it sees a new set of features from your night, it doesn't "remember" the training data. Instead, it runs your features through its learned map and outputs probabilities: "This epoch has a 75% chance of being N2, a 20% chance of being N3, and a 5% chance of being REM."
Step 4: Temporal Smoothing and Rule-Based Polish
Sleep has structure; it's not random. You don't typically jump from deep sleep directly to REM, and awakenings are usually brief. The raw probabilities from the model are fed into a Hidden Markov Model (HMM) or similar post-processing logic. This applies rules of sleep architecture: "If the previous epoch was Wake and the current is high-probability Deep Sleep, maybe re-evaluate because that transition is rare." It smooths the hypnogram into the logical, cyclical stages you see in your app.
It’s vital to remember that this is an estimation, not a measurement. The algorithm is making a best guess based on correlates of sleep (autonomic arousal) rather than a direct measure (brain waves). Its accuracy is highest in distinguishing Wake from Sleep and often good at detecting Deep Sleep due to its strong physiological signature. The toughest challenge remains accurately differentiating between Light Sleep (N2) and REM sleep, as their autonomic profiles (heart rate, movement) can be very similar. This is an area of intense innovation, with companies continually refining their models with more and better data. For users curious about the specific approaches and validation behind different devices, frequently asked questions about accuracy and methodology are often addressed in detail on support pages like Oxyzen's FAQ.
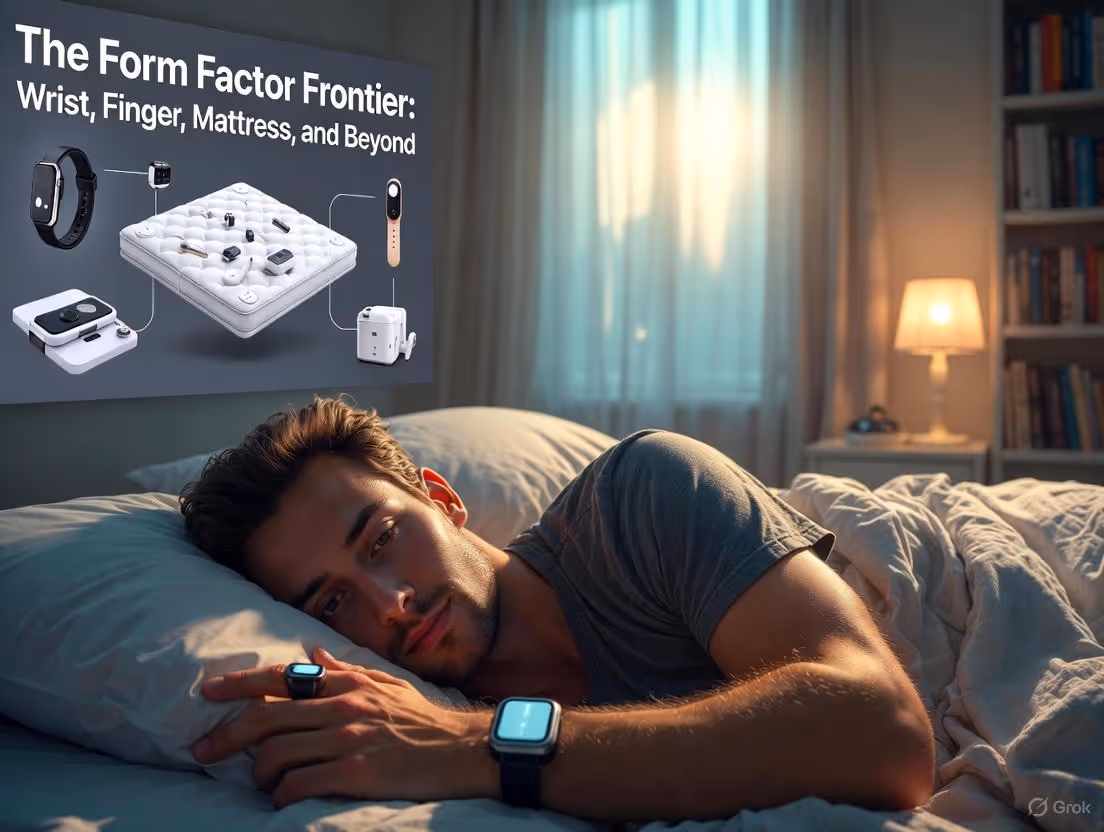
The Form Factor Frontier: Wrist, Finger, Mattress, and Beyond
The sensors and algorithm form the brain of a sleep tracker, but its body—the form factor—profoundly influences what data it can collect and how accurately it can collect it. Each design choice involves a trade-off between convenience, comfort, and data fidelity.
Wrist-Worn Devices (Smartwatches & Fitness Bands)
The Standard: This is the most common form, popularized by Fitbit, Apple Watch, Garmin, and others.
Advantages: High convenience (many people already wear a watch), always-on presence, rich daytime activity and notification features.
Data Challenges: The wrist is a suboptimal location for nocturnal physiology.
Motion Artifact: The wrist moves frequently during sleep, especially if you shift positions, which can corrupt PPG heart rate data.
Anatomical Limitations: Vascularity is less dense than in the finger, and the bones and tendons can allow the device to shift, breaking sensor contact ("the gap").
Consistency: A loose fit degrades data. The "military strap" or wearing it higher on the wrist is often recommended for better sleep tracking.
Smart Rings (The Discrept Sleep Specialist)
The Challenger: Pioneered by Oura and now offered by newer entrants like Oxyzen, the smart ring is designed explicitly with 24/7 biometrics in mind.
Advantages:
Superior Sensor Contact: The finger, particularly the base, has dense capillaries and less connective tissue, providing a stronger, cleaner PPG signal.
Reduced Motion Noise: Fingers generally move less than the wrist during sleep. The ring is also less likely to experience inertial movement from arm motions.
All-Night Consistency: A properly sized ring stays in place, ensuring continuous skin contact without the need for a tight band.
Dedicated Focus: Rings are often built first as wellness devices, prioritizing sensor quality and battery life over screens and apps.
Considerations: Sizing is critical for comfort and accuracy. It lacks a screen for immediate feedback, relegating all interaction to a smartphone app.
Under-Mattress Pads & Bedside Devices
The Non-Wearable: Devices like Withings Sleep Analyzer or Emfit mats sit under the mattress or on the bedside table.
How They Work: They use ballistocardiography (BCG) or piezoelectric sensors to detect the micro-vibrations caused by heartbeat, breathing, and body movement through the mattress. Some use bioimpedance or sonar.
Advantages: Zero wearability concerns—you forget it exists. Can often accurately determine sleep vs. wake, respiration rate, and even cardiac rhythm (AFib detection) without touching the body.
Limitations: They struggle with individual tracking if two people share a bed. They cannot measure localized metrics like skin temperature or detailed HRV from the pulse waveform. Their sleep staging, while improving, is generally derived from movement and breathing patterns alone.
The Future: Multi-Modal and Ambient Sensing
The next wave moves beyond a single device. Imagine a system that combines:
A wearable (ring or watch) for core physiology (HR, HRV, temperature).
An under-mattress pad for precise breathing analysis and macro-movement.
A low-power radio device (like an FCC-approved radar sensor) to monitor presence, breathing, and sleep position without any wearables.
Smartphone microphones (with privacy safeguards) to analyze ambient sound for snoring or sleep talking.
Sensor fusion across multiple points will provide a more complete, robust picture, allowing algorithms to cross-validate data and fill in gaps. The choice of form factor ultimately depends on your priorities: all-day convenience (watch), dedicated sleep and recovery accuracy (ring), or absolute minimalism (bed sensor). Reading real user experiences and testimonials can provide valuable insight into how these different form factors perform in everyday life. You can find such firsthand accounts on Oxyzen's testimonials page.
Decoding the Morning Report: Understanding Your Sleep Metrics
You wake up, grab your phone, and open your sleep app. A score appears—an 82, a 92%, a "Fair." Behind that headline number lies a dashboard of metrics. Let's translate what each one truly means, where it comes from, and how much weight you should give it.
The Composite Sleep Score
Most platforms boil your night down to a single number. This is a user-friendly abstraction, but it's a weighted composite.
Typical Components: The score is often a blend of:
Total Sleep Time: Heavily weighted. Missing your target duration severely impacts the score.
Sleep Efficiency: (Time Asleep / Time in Bed) x 100. High efficiency (>90%) is rewarded.
Sleep Architecture: The amount of Deep and REM sleep relative to your personal baseline or population averages.
Restfulness: Based on prolonged awakenings or excessive movement.
Timing: How well your sleep window aligns with your circadian rhythm (e.g., consistent bedtime).
The Takeaway: Don't fetishize the score. A drop of 5 points doesn't necessarily mean worse sleep; it could mean you had shorter but higher-quality cycles. Use it as a general trend indicator, not a daily verdict.
Sleep Stages: Light, Deep, and REM
Light Sleep (N1 & N2): Often 50-60% of your night. This is the gateway sleep and is crucial for memory consolidation and cognitive function. Don't dismiss it as "bad" sleep.
Deep Sleep (N3 - Slow-Wave Sleep): The physically restorative phase. This is when tissue repair, growth hormone release, and immune system strengthening peak. It's prioritized in the first half of the night. Tracker Insight: This is the stage most consistently identified by wearables due to its strong autonomic signature (high HRV, low HR, minimal movement). Seeing a consistent deep sleep block early in your night is a good sign.
REM Sleep: The mentally restorative phase. Essential for emotional processing, creativity, and long-term memory. It dominates the later cycles of the night. Tracker Insight: The hardest stage to estimate accurately. If your tracker shows no REM until the very end of your sleep, it may be conflating it with light sleep. Focus on the trend over weeks, not the nightly minute count.
Key Supporting Metrics
Resting Heart Rate (RHR): The lowest average heart rate during sleep. A low and trending-down RHR is a sign of improving cardiovascular fitness. A sudden spike can indicate stress, dehydration, illness, or incomplete recovery.
Heart Rate Variability (HRV): As discussed, your nightly average HRV and its balance score are paramount. This is arguably more informative than the sleep score itself for overall readiness.
Respiratory Rate: The number of breaths per minute during sleep. Typically between 12-20 for adults. A consistent, steady rate is ideal. A significant increase overnight or a high baseline can be a sign of stress or respiratory issues.
Sleep Latency: The time it takes you to fall asleep. Ideally 10-20 minutes. Consistently under 5 minutes may indicate severe sleep debt; consistently over 30 minutes may suggest insomnia or poor sleep hygiene.
Awake Time / Restlessness: The total minutes scored as awake after sleep onset. Some is normal (15-20 minutes across a night). Frequent, prolonged awakenings fragment sleep and reduce its restorative quality.
The goal is pattern recognition, not perfectionism. Did your deep sleep plummet after two nights of heavy drinking? Did your HRV crash the night before you came down with a cold? Did a consistent 10 PM bedtime increase your sleep efficiency? These cause-and-effect insights are the true power of tracking. For more on how to interpret these patterns and apply them to your lifestyle, a wealth of additional resources and related articles can be found on our dedicated blog.
The Gold Standard vs. The Estimator: How Accurate Are Consumer Sleep Trackers?
This is the million-dollar question. The answer is nuanced: They are surprisingly accurate for what they are, but they are not medical-grade PSG and should not be used for diagnostic purposes.
Let's break down the evidence and the caveats.
What the Research Says
Independent validation studies, published in peer-reviewed journals like Sleep, Journal of Clinical Sleep Medicine, and Nature, generally find:
High Agreement for Sleep vs. Wake: Modern multi-sensor devices can accurately distinguish between periods of sleep and wakefulness about 85-95% of the time compared to PSG. This is a massive improvement over old actigraphy.
Good-to-Moderate Agreement for Sleep Staging:
Deep Sleep: Agreement is often the highest, in the range of 70-80%. The physiological markers are distinct.
Light vs. REM Sleep: This is the battleground. Agreement can drop to 50-65%. The algorithms frequently confuse N2 (light) and REM sleep because their autonomic profiles overlap significantly. One common error is "REM sleep underestimation"—the tracker scores periods of actual REM as light sleep, especially in the middle of the night.
Excellent for Tracking Trends: Where consumer devices shine is in relative, longitudinal tracking. While the absolute number of minutes of REM sleep on Tuesday night may be off by 10-15 minutes, the trend across weeks—whether your deep sleep is increasing, your HRV is recovering, your latency is improving—is highly reliable and actionable.
The Inherent Limitations (Why They Can't Be 100% Accurate)
The Proxy Problem: They measure proxies (heart, movement) for a neurological state (brain sleep). There is no direct 1:1 mapping. Two people with identical heart rate patterns could be in different sleep stages due to individual neurophysiology.
The Individual Variability: Algorithms are trained on population averages. Your personal physiology might be an "outlier." For example, someone with naturally high vagal tone might have elevated HRV during REM, confusing the model.
The "Quiet Wakefulness" Problem: Lying perfectly still in bed, awake but relaxed, is almost indistinguishable from light sleep based on movement and heart rate alone. This can artificially inflate your total sleep time.
Sensor Placement Issues: As discussed, poor fit equals poor data. A loose wrist strap or a ring on a cold finger degrades signal quality, forcing the algorithm to guess.
How to Use Your Tracker Intelligently
Trust the Trends, Not the Absolute Numbers. Look at your 7-day and 30-day averages. Is your HRV baseline climbing? Is your deep sleep percentage stable?
Calibrate with How You Feel. This is the most important step. If your tracker says you had a "Poor" night with 45 minutes of REM but you woke up feeling refreshed and alert, trust your body. The score is wrong for you that night. Use the data to explain your feelings, not define them.
Don't Chase Arbitrary Targets. Striving for "2 hours of deep sleep" because it's a nice round number can create sleep anxiety. Focus on behaviors that improve sleep quality overall: consistency, a dark cool room, winding down.
Use It for Experimentation. It's a brilliant biofeedback tool. Test: Does a hot bath 90 minutes before bed increase my deep sleep? Does alcohol really trash my HRV? (Spoiler: yes). Does my 7 AM workout yield better sleep than my 7 PM workout? The tracker provides data to answer these questions.
For those considering a device and wanting to understand its validation, companies that are transparent about their science will often share white papers or research summaries. You can learn more about one company's commitment to this transparent, science-backed approach by exploring their story.
More Than Just Sleep: The 24/7 Wellness Ecosystem
The most advanced sleep trackers understand that sleep cannot be isolated from the other 23 hours of the day. What you do while awake—how you move, stress, eat, and recover—profoundly shapes your night. This has given rise to the 24/7 wellness ecosystem, where sleep data is integrated with daytime metrics to provide a holistic "Readiness" or "Recovery" score.
Daytime Metrics That Inform Night
Activity & Strain: High-intensity or long-duration exercise creates a physiological strain that demands recovery. The algorithm expects to see corresponding increases in deep sleep and a potential temporary dip in HRV the following night. If it doesn't, it might flag inadequate recovery.
Stress Monitoring: Some devices now offer continuous daytime stress tracking via HRV analysis. A day of high sympathetic drive can predict a more fragmented, less restorative sleep, even if you spend 8 hours in bed.
Body Temperature: Continuous temperature monitoring can detect deviations that may indicate the onset of illness, menstrual cycle phases, or metabolic changes, all of which impact sleep architecture.
Circadian Rhythm Tracking: By combining sleep timing, daytime light exposure (often inferred from activity), and body temperature rhythm, some platforms build a model of your circadian phase, helping to optimize the timing of sleep, exercise, and even meals.
The Readiness Score: Your Daily Guide
This is the morning answer to "How hard can I push today?" It's a synthesis of:
Sleep Quality: Did you get enough restorative sleep to repair yesterday's strain?
Recovery Status: What do your HRV and RHR trends say about your autonomic balance?
Acute Strain: How much load did you accumulate yesterday?
Circadian Alignment: Are you in sync with your natural rhythm?
A high Readiness score suggests your body is primed for performance—a good day for that intense workout or important meeting. A low score is a recommendation for focus on recovery: prioritize light activity, meditation, hydration, and an early bedtime.
This closed-loop system—Activity -> Strain -> Sleep -> Recovery -> Readiness -> Activity—is where wearable technology transitions from a passive sleep logger to an active health advisor. It encourages a proactive, preventive approach to wellness, using last night's sleep to guide today's choices for better sleep tomorrow. To see how this holistic philosophy is put into practice, you can learn more about Oxyzen's integrated wellness platform on their homepage.
The Neuroscience of Slumber: What Your Brain is Actually Doing
To fully grasp what your sleep tracker is attempting to measure, we must journey inside the sleeping brain itself. The stages of sleep—Light, Deep, and REM—are not arbitrary categories invented by sleep trackers. They are distinct neurological states, each with its own unique electrical signature and biological purpose, evolved over millions of years. Your tracker’s algorithm is, in essence, trying to eavesdrop on this intricate neural concert from outside the skull.
The Electrochemical Symphony of Sleep Stages
Sleep is not a passive shutdown but an active, highly organized process governed by complex interactions between brainstem nuclei, the thalamus, and the cerebral cortex. The primary tool for observing this is the electroencephalogram (EEG), which measures the summed electrical activity of millions of neurons firing in sync.
Wakefulness: Characterized by fast, low-amplitude Beta waves (13-30 Hz) when alert, and slightly slower Alpha waves (8-12 Hz) when relaxed with eyes closed. The brain is processing external stimuli, engaged in focused thought.
N1 (Light Sleep – Transition): As you drift off, Alpha waves give way to even slower Theta waves (4-7 Hz). This is the hypnagogic state, often accompanied by fleeting dream-like images or sudden muscle jerks (hypnic jerks). Consciousness begins to disengage.
N2 (Light Sleep – True Sleep): The brain produces two defining features visible on EEG:
Sleep Spindles: Brief (0.5-2 second) bursts of rhythmic 11-16 Hz activity. These are believed to be crucial for memory consolidation—the process of transferring short-term memories from the hippocampus to the long-term storage of the neocortex. They also act as a "gatekeeper," suppressing external stimuli to protect sleep stability.
K-Complexes: High-amplitude, slow dip-and-spike waves. They are thought to be a response to internal or external stimuli (e.g., a noise), serving as a "does-not-compute" signal to keep the brain asleep. N2 makes up the bulk of our sleep and is the foundational stage for physical and mental restoration.
N3 (Deep Sleep – Slow-Wave Sleep): The brain erupts in slow, high-amplitude Delta waves (0.5-4 Hz). This is the most restorative phase.
The "Power Washer" of the Brain: Cerebrospinal fluid (CSF) pulses through the brain more vigorously during deep sleep, flushing out metabolic waste products like beta-amyloid, a protein associated with Alzheimer's disease.
Physical Restoration: Growth hormone secretion peaks, driving tissue repair, muscle growth, and immune function strengthening.
Cognitive Decluttering: Synaptic connections that were strengthened during the day's learning are selectively "pruned," while important ones are reinforced, improving neural efficiency. This is why a tracker's detection of deep sleep—via low heart rate and high HRV—is so strongly linked to feelings of physical recovery.
REM (Rapid Eye Movement) Sleep: The brain becomes paradoxically active. The EEG resembles wakefulness, with fast, low-amplitude Beta and Gamma waves. However, the body is paralyzed (save for the eyes, diaphragm, and middle ear muscles) due to potent inhibition of motor neurons.
The Emotional and Creative Engine: The limbic system (emotion center) and the visual-association cortices are highly active, while the prefrontal cortex (logic center) is relatively offline. This creates the illogical, emotional narrative of dreams.
Memory Integration: REM is critical for procedural memory (skills), emotional memory processing, and creative problem-solving. It helps integrate new experiences with existing knowledge, stripping away the emotional charge from memories. The tracker’s challenge is that the autonomic state of REM—elevated heart rate, variable breathing—mimics stress or light wakefulness, making it a frequent source of algorithmic confusion.
The Master Regulators: Circadian and Homeostatic Drives
Two primary biological systems govern the timing and pressure for sleep:
Circadian Rhythm ("The Clock"): Your ~24-hour internal clock, located in the suprachiasmatic nucleus (SCN) of the hypothalamus. It is entrained primarily by light, especially blue wavelengths hitting intrinsically photosensitive retinal ganglion cells. The SCN drives the release of melatonin from the pineal gland in the evening, signaling "darkness = sleep time." It also orchestrates the nightly drop in core body temperature. A misaligned circadian rhythm (e.g., from jet lag or late-night screen use) directly fragments sleep architecture, often reducing deep sleep. Your tracker's skin temperature and timing metrics are indirect proxies for assessing this rhythm.
Sleep-Wake Homeostasis ("The Pressure Tank"): This is the body's simple accounting system for sleep debt. The longer you are awake, the more the sleep-promoting substance adenosine accumulates in the brain. Caffeine works by blocking adenosine receptors, tricking you into feeling alert. Deep sleep is particularly sensitive to homeostatic pressure; after sleep deprivation, the brain will prioritize deep sleep in the next opportunity, a phenomenon called "slow-wave sleep rebound." Your tracker's measurement of total sleep time and efficiency is a gauge of how well you're relieving this pressure.
The elegant dance between these two systems determines not just when you sleep, but how well you cycle through the necessary stages. A modern sleep tracker, by monitoring timing, movement, and autonomic arousal, is building a rough model of this dance—inferring the state of the brain by observing the body it controls. For a deeper exploration of how daily habits influence these biological drives, our blog features numerous articles on circadian health and sleep hygiene here.
The Autonomic Nervous System: The Bridge Between Brain and Tracker
This is the critical link. Since consumer trackers cannot read brain waves, they read the output of the autonomic nervous system (ANS)—the involuntary control system for visceral functions. The ANS has two branches, and their balance shifts dramatically throughout the sleep cycle, leaving fingerprints on your heart and skin that the sensors can detect.
The Sympathetic Nervous System (SNS): The "fight-or-flight" system. Activates during stress, excitement, or activity. It increases heart rate, blood pressure, and respiration while decreasing HRV. It also triggers sweat (GSR) and shunts blood away from the extremities.
The Parasympathetic Nervous System (PNS): The "rest-and-digest" system. Promotes calm, recovery, and digestion. It slows heart rate, steadies breathing, and, crucially, increases HRV via the vagus nerve. It promotes vasodilation in the extremities, releasing heat.
A Nightly Journey Through the ANS:
Sleep Onset: As you transition from wake to light sleep, the PNS begins to gain dominance. This is the initial rise in HRV your tracker sees.
Deep Sleep (N3): PNS dominance is at its peak. This is the state of maximal physical restoration. The heart rate is at its lowest, HRV at its highest, and skin temperature often drops as blood vessels dilate to release heat. The tracker's algorithm is most confident here because the signal is strong and clean.
REM Sleep: The ANS becomes chaotic and "sympathetically activated." The brain is active, the heart rate rises and becomes variable (similar to stress), HRV plummets, and temperature regulation is suspended. However, because the skeletal muscles are paralyzed, there is no movement. This creates the confusing signature for algorithms: a wake-like heart in a motionless body.
Brief Awakenings: The SNS spikes briefly, causing a heart rate jump, a movement, and a dip in HRV. Most of these are so short you don't remember them.
By continuously monitoring HR, HRV, and movement, your sleep tracker is essentially charting the ebb and flow of your ANS throughout the night. It translates this chart into a best-guess map of your brain's sleep stages. This is why HRV is not just a trendy metric; it is the most direct window into autonomic balance that consumer technology can provide, a fact emphasized in the development philosophy behind science-focused wearables like those from Oxyzen, whose mission is built on actionable biometric insights. You can learn more about their approach here.
The Limitations of Inference: Where Trackers (Still) Struggle
Understanding the neuroscience and autonomic bridge exposes the inherent ceilings of current consumer technology. Here are specific scenarios where even the best trackers can be led astray:
The Meditator's Paradox: An experienced meditator lying in bed practicing mindfulness may have a slowed heart rate, high HRV, and zero movement—a physiological profile nearly identical to deep sleep. The tracker will almost certainly score this as sleep, even though the individual is fully, consciously awake. This is the fundamental "quiet wakefulness" problem.
The Insomniac's Frustration: Someone with insomnia may lie still for hours, their body exhausted and showing sleep-like ANS signs, while their mind races. The tracker may report hours of "light sleep," contradicting the subjective experience of being awake. This can create a damaging psychological feedback loop where the user distrusts their own perception.
REM vs. Light Sleep Conflation: As noted, the autonomic signatures overlap. A period of REM with particularly vivid but non-physical dreams may show lower heart activity, pushing the algorithm toward a Light Sleep classification. Conversely, a period of light sleep with minor stress or digestion occurring could show elevated heart rate, pushing the algorithm toward a Wake or REM classification.
Individual Physiological Differences: People have natural variations in baseline HRV, heart rate, and thermoregulation. An algorithm trained on a population average may systematically over- or under-estimate sleep stages for an individual at the statistical extremes.
Sleep Disorders: Consumer devices are screening tools, not diagnostic devices.
Sleep Apnea: They can detect the consequences—blood oxygen dips (SpO2), heart rate spikes, and movement from arousal—flagging "possible disturbances." But they cannot distinguish central from obstructive apnea or quantify the apnea-hypopnea index (AHI) with medical precision.
Periodic Limb Movement Disorder (PLMD): Accelerometers can detect the movements, but cannot determine if they are causing cortical arousals (disrupting sleep) without an EEG.
REM Sleep Behavior Disorder: Where the muscle paralysis of REM fails, the tracker will see large movements during a period it has scored as REM sleep—a red flag worth discussing with a doctor.
The informed user understands these limitations. The value isn't in clinical-grade accuracy, but in the powerful trend data and biofeedback these devices provide over time, allowing you to observe the impact of lifestyle on your nervous system's nocturnal behavior. For common questions on accuracy and best-use practices, many users find detailed guidance in a company's FAQ section, such as the one available here.
Advanced Biomarkers: The Next Frontier in Nocturnal Insights
The core metrics of HR, HRV, and movement are now table stakes. The cutting edge of sleep technology lies in deriving deeper, more predictive insights from these signals and incorporating new sensor modalities.
HRV Dynamics: Beyond the Average
The nightly average HRV (RMSSD) is useful, but the real story is in its dynamics throughout the night.
Deep Sleep HRV Peak: The magnitude and duration of the HRV peak during deep sleep cycles are potent indicators of recovery quality. A shallow or truncated peak may suggest the recovery process was incomplete.
REM Sleep HRV Drop: The depth of the HRV drop during REM can indicate the intensity of autonomic activation. An extremely low drop might correlate with intense dreaming or subconscious stress processing.
Ultradian Rhythm Analysis: Viewing HRV as a wave that cycles with your 90-minute sleep stages can reveal the strength and regularity of your sleep architecture. Disrupted, chaotic HRV waveforms correlate with poor sleep quality, even if total sleep time is adequate.
Nocturnal Heart Rate Trends
Similarly, the contour of your heart rate through the night is rich with information.
Sleep Onset Slope: How quickly does your heart rate drop in the first 30-60 minutes of sleep? A steep drop is associated with efficient sleep onset and higher sleep pressure (good sleep debt). A shallow slope may indicate circadian misalignment or hyperarousal.
Morning Rise: The natural, cortisol-mediated rise in heart rate in the last 90 minutes before waking is part of the body's preparation for the day. A tracker can analyze if this rise is smooth and gradual (ideal) or jagged and steep (suggesting fragmented late-stage sleep or an alarm cutting off a deep sleep cycle).
Respiratory Rate and Its Nuances
Breathing rate is more than just a number.
Breathing Regularity: The consistency of breath-to-breath intervals. High regularity in deep sleep is a sign of strong PNS drive. Increased irregularity can signal transitions into lighter sleep or REM.
Coupling with Heart Rate: Respiratory Sinus Arrhythmia (RSA) is the natural phenomenon where heart rate increases slightly on inhalation and decreases on exhalation. The strength of this coupling is a direct measure of vagal tone. Strong RSA during deep sleep is a marker of excellent autonomic health and recovery. Advanced algorithms are beginning to analyze this relationship.
The Promise of Core Body Temperature
While current wearables measure skin temperature, the holy grail is non-invasive core temperature monitoring.
Circadian Phase Precision: The core body temperature minimum (CBTmin) is the most reliable marker of circadian phase. Knowing your personal CBTmin could allow for hyper-personalized sleep and wake time recommendations.
Fertility and Hormonal Tracking: The biphasic pattern of a woman's core temperature is a key indicator of ovulation. A wearable that could track this continuously would revolutionize fertility awareness.
Metabolic Insight: Nocturnal temperature metabolism is linked to metabolic health. Aberrant patterns could provide early signals of metabolic dysfunction.
Biomarkers on the Horizon
Blood Pressure: Nocturnal "dipping" (a 10-20% drop in blood pressure during sleep) is crucial for cardiovascular health. "Non-dippers" are at higher risk. Emerging technologies using pulse wave velocity or bioimpedance may offer nightly estimates.
Glucose Trends: While continuous glucose monitors (CGMs) are separate devices, integrating nocturnal glucose stability data with sleep stages could reveal how sleep quality affects metabolic control, and vice-versa.
Cortisol Awakening Response: The first 30-60 minutes after waking see a sharp spike in cortisol. The magnitude and timing of this spike are linked to stress resilience and energy. While not yet measurable directly, a combination of heart rate, HRV, and movement data upon waking may one day model this critical biomarker.
These advanced analyses move sleep tracking from a descriptive report ("you got 1.5h of deep sleep") to a diagnostic and predictive tool for overall health. They form the basis of the sophisticated "Readiness" scores offered by leading platforms, which synthesize these nuanced signals into a daily action plan. For those fascinated by where this technology is headed, the Oxyzen blog often explores emerging trends in biometric sensing here.
The Invisible Architects: How Lifestyle and Environment Sculpt Your Sleep Data
Your sleep tracker’s report is not merely a log of what happened between the sheets; it is a detailed receipt for your waking life. Every choice—from your afternoon coffee to the glow of your bedroom clock—interacts with your biology to shape the architecture of your night. Understanding these levers turns your tracker from a passive observer into an active tool for experimentation and optimization.
The Chemical Curators: Substances and Sleep Architecture
Alcohol: The Deep Sleep Saboteur Perhaps no substance has a more deceptively damaging effect on sleep. While a nightcap may induce faster sleep onset (via sedation), its impact on sleep architecture is profoundly negative.
The Tracker Will Show: A predictable pattern. Initial increased deep sleep in the first half of the night (as alcohol is a nervous system depressant). However, this is followed by a catastrophic second-half rebound. As the body metabolizes the alcohol, it causes a sympathetic surge. Your tracker will reveal severely fragmented sleep, multiple awakenings, elevated heart rate, and crushed HRV in the later cycles. REM sleep is often suppressed entirely early on, leading to an unbalanced, non-restorative night. The morning report will likely show a decent "Total Sleep" but a poor "Sleep Quality" or "Restfulness" score, with low HRV—a classic signature of alcohol consumption.
Caffeine: The 12-Hour Shadow Caffeine’s half-life is 5-6 hours, meaning 25% of the caffeine from a 3 PM coffee may still be in your system at midnight. It works by competitively blocking adenosine receptors.
The Tracker Will Show: Increased sleep latency (time to fall asleep), reduced sleep efficiency (more tossing and turning), and a notable reduction in slow-wave deep sleep. The brain is literally prevented from entering its most restorative state. Furthermore, caffeine can elevate nocturnal heart rate and lower HRV, mimicking a state of low-grade stress. For individuals sensitive to caffeine, even morning consumption can leave a discernible fingerprint.
Cannabis: A Double-Edged Sword Effects vary widely by strain (THC vs. CBD dominance), tolerance, and individual biology.
THC-Dominant: Often decreases REM sleep latency (you reach REM faster) but can significantly suppress overall REM duration. This may explain reports of less dream recall. It may increase deep sleep initially but can lead to tolerance and rebound insomnia upon cessation.
CBD-Dominant: Appears to have a more anxiolytic effect, potentially reducing sleep-onset anxiety and improving sleep continuity without the strong REM suppression.
The Tracker’s Clue: Look for changes in your REM sleep percentage and resting heart rate. A sustained drop in REM or an altered HRV pattern may be linked to regular use.
Nicotine: A Powerful Stimulant A stimulant that increases heart rate and blood pressure. Smokers and vapers often experience nicotine withdrawal during the night, leading to arousals.
The Tracker Will Show: Fragmented sleep, increased awakenings (often in the later half of the night), and an elevated resting heart rate compared to non-smoking baselines.
The Environmental Orchestra: Light, Temperature, and Sound
Light: The Master Circadian Driver Light is the primary zeitgeber (time-giver) for your SCN. Exposure dictates melatonin timing and strength.
Blue Light at Night: Suppresses melatonin, delaying sleep onset and shifting your circadian phase later. Your tracker may show a longer sleep latency and reduced deep sleep in the first cycle.
Morning Light: Exposure to bright, ideally natural, light within an hour of waking strengthens your circadian signal, improving sleep drive for the following night. It can help normalize sleep timing metrics.
Pitch Darkness: Even small amounts of light (from a charger LED, a crack in the blinds) can cause micro-awakenings and shallow sleep, potentially captured by your tracker as increased restlessness or a higher-than-normal awake time.
Temperature: The Sleep Switch The circadian-driven drop in core body temperature is a prerequisite for sleep onset. Your environment must facilitate this.
The Goldilocks Zone: Most research points to a cool room, around 65-68°F (18-20°C). This allows your body to efficiently dissipate heat through vasodilation in the extremities, which your tracker’s skin temperature sensor may detect as a gradual evening decline.
Too Hot or Too Cold: Both force the body to work to thermoregulate, increasing awakenings and reducing deep and REM sleep. A hot room is particularly damaging, often showing as a flatter, less dynamic skin temperature curve and increased movement.
Sound: The Sleep Disruptor Even if you don’t consciously wake up, noise causes micro-arousals—brief shifts to a lighter sleep stage.
The Tracker’s Evidence: Irregular spikes in heart rate, movement, or GSR (if available), often without a full "awake" classification. This fragments sleep, reducing its restorative quality. The "sleep score" may be lower despite adequate time in bed. Consistent white or pink noise, conversely, can mask disruptive sounds and may be associated with smoother, less fragmented heart rate curves.
The Behavioral Architects: Exercise, Food, and Stress
Exercise: The Timing Matters Physical activity is one of the best promoters of deep sleep, but its timing is key.
Morning/Afternoon Exercise: Strengthens the circadian rhythm and builds healthy sleep pressure. Expect to see a corresponding increase in deep sleep percentage and a stronger dip in resting heart rate that night.
Vigorous Evening Exercise (within 2-3 hours of bed): Elevates core temperature and stimulates sympathetic activity (adrenaline). For many, this leads to increased sleep latency and can reduce sleep efficiency. However, some individuals are not affected. Your tracker is the perfect tool to discover your personal cutoff time.
Food: The Nocturnal Digestive Burden Eating a large, rich, or spicy meal close to bedtime forces your digestive system to work when it should be winding down.
The Data Shows: Elevated nocturnal heart rate as the body diverts energy to digestion. It can also cause more frequent movements, reflux-related arousals, and potentially less deep sleep. A tracker might show a less pronounced dip in your heart rate curve for the first few hours of sleep.
Chronic Stress and Anxiety: The Hyperarousal State This is arguably the most common thief of good sleep in the modern world. It creates a state of physiological and cognitive hyperarousal that persists into the night.
The Unmistakable Signature: High resting heart rate, low HRV (both day and night), increased sleep latency, frequent awakenings, and a reduction in deep sleep. The sleep architecture looks shallow and jagged. The tracker quantifies what you feel: your nervous system cannot fully disengage. This is where tools like daytime stress tracking and evening wind-down routines, validated by improving nocturnal HRV, become powerfully transformative. Witnessing how practices like meditation can directly improve your biometrics is a compelling motivator, as shared in many user testimonials on platforms like Oxyzen's here.
By methodically altering one variable at a time and observing the multi-night trends on your tracker, you move from guesswork to data-driven self-knowledge. You become the scientist of your own sleep.
Inside the Black Box: A Comparative Look at Major Device Algorithms
While most high-end sleep trackers use similar PPG, accelerometer, and temperature sensors, the "secret sauce"—the proprietary algorithm that translates this data into sleep stages and scores—varies significantly between companies. This is why the same person can get different results from different devices on the same night. Let's demystify the approaches of some key players.
Oura Ring: The Recovery-First Pioneer
Oura helped define the modern smart ring category with a relentless focus on recovery and readiness.
Algorithm Philosophy: Biometric-first, movement-second. Oura’s algorithm places heavy weight on HRV (measured via PPG), heart rate, and body temperature trends. The accelerometer is used, but more to confirm wakefulness and refine stage timing than as a primary driver. This makes it less prone to scoring "quiet wakefulness" as sleep.
Key Differentiators:
Nighttime HRV: It calculates HRV from a 5-minute sample during your longest period of deep sleep, aiming for the cleanest, most comparable reading each night.
Temperature Trend: It tracks baseline deviation (0.1°C precision) over weeks, not just absolute nighttime values, useful for illness prediction and cycle tracking.
Three-Score System: Separate scores for Sleep, Readiness, and Activity, emphasizing that they are interrelated but distinct aspects of health.
Potential Blind Spots: Its scoring can be conservative; it may label periods of light sleep as "awake" if biometrics show arousal, potentially under-reporting total sleep time for light sleepers.
Whoop Strap: The Strain-and-Recovery Athlete
Whoop’s entire ecosystem is built on the relationship between daily Strain and nightly Recovery.
Algorithm Philosophy: Performance-oriented and coach-like. Its algorithm is finely tuned to assess how well your sleep is repairing the physiological damage (Strain) from training and daily life. It uses a 5-band PPG sensor and aims for high-frequency data collection.
Key Differentiators:
Sleep Need & Debt: Whoop dynamically calculates how much sleep you need based on recent strain and sleep history, not just a fixed 8-hour target.
Respiratory Rate Focus: It tracks this metric closely as a key vital sign for overtraining and illness.
Journal Feature: Allows for logging 50+ behaviors (alcohol, late food, mindfulness) and correlates them against your Recovery score, providing powerful personalized insights.
Potential Blind Spots: As a wrist-worn device, it is susceptible to motion artifact, especially for side sleepers. Its performance focus may be less nuanced for non-athletes focused solely on general wellness.
Apple Watch (with Apple Health / Third-Party Apps): The Ubiquitous Platform
Apple provides core sensor data (HR, HRV, motion) via its APIs, which apps like AutoSleep, Pillow, and Athlytic use to build their own sleep models.
Algorithm Philosophy: Decentralized and app-dependent. Apple itself uses a relatively simple algorithm focused on sleep/wake detection and time-in-bed. The sophistication comes from third-party developers.
AutoSleep: Known for its automatic detection (no need to start a "sleep mode") and deep customization options. It uses movement and heart rate dips very effectively.
Athlytic: Mimics the Whoop model, creating Recovery and Strain scores from Apple Watch data, emphasizing HRV and resting heart rate.
Key Differentiators: Integration. Sleep data sits alongside a universe of other health metrics (mindfulness minutes, cardio fitness, etc.) in the Apple Health ecosystem. The user can choose the interpretation app that best fits their philosophy.
Potential Blind Spots: Battery life requires nightly charging for sleep tracking. Sensor placement (wrist) and the lack of a dedicated temperature sensor limit the biometric inputs compared to a ring.
Garmin: The Outdoor Enthusiast's Powerhouse
Garmin devices use the proprietary Firstbeat Analytics algorithms (which Garmin now owns) for both sleep and daytime body battery/ stress tracking.
Algorithm Philosophy: Physiological analytics and endurance. Garmin’s sleep tracking is part of a larger suite focused on training load, altitude acclimation, and endurance performance.
Key Differentiators:
Pulse Ox: Many Garmin models include this, allowing for sleep altitude acclimation tracking and rudimentary breathing disturbance monitoring.
Body Battery: A 0-100 score that combines stress, sleep, and activity to estimate energy reserves throughout the day.
Sleep Score Breakdown: Provides a detailed breakdown of what contributed to or detracted from the score (duration, deep/REM, stress, awakenings).
Potential Blind Spots: Historically, Garmin’s sleep staging was considered less accurate than Oura or Whoop, though recent updates have significantly improved it. The form factor is, again, a wrist-worn watch.
The Smart Ring Newcomers (e.g., Circular, Ultrahuman, Oxyzen): The Evolving Challengers
A new wave of smart rings is entering the market, each with its own algorithmic twist on the form factor’s advantages.
Common Philosophy: Leverage the superior finger-based PPG signal and 24/7 wearability to provide more consistent biometric baselines. Many focus on metabolic health and personalized feedback loops.
Emerging Differentiators: Some are exploring continuous SpO2, non-invasive blood pressure trends, and deeper glucose/metabolic integrations (via partnerships with CGMs). The focus is often on actionable nudges rather than just data presentation. For instance, understanding a company's unique approach to turning this data into daily wellness guidance can be found by exploring their story and mission, such as the one behind Oxyzen.
The Takeaway: There is no single "best" algorithm. The choice depends on your primary use case (athletic recovery, general wellness, sleep disorder screening, women’s health), your preferred form factor, and which data presentation you find most intuitive and actionable. The most important factor is consistency—using the same device over time to track your personal trends is far more valuable than comparing absolute numbers across platforms.
The Horizon: The Future of Sleep Technology (2025 and Beyond)
We are on the cusp of a transformation in sleep technology, moving from informative tracking to integrated diagnosis and intervention. The future lies in multi-modal sensing, advanced biomarkers, and closed-loop systems that don't just report problems—they help solve them.
1. Multi-Modal Sensor Fusion & Ambient Sensing
The next generation won't rely on a single wearable. It will be a sensor network.
Wearable + Bed Sensor + Ambient: A ring (for precise physiology) will sync with an under-mattress pad (for precise breathing, heart rhythm, and sleep position) and a low-power, privacy-safe radar or RF sensor in the room (for presence, gross movement, and respiration validation). This cross-validation drastically improves accuracy, as the system can ignore a momentary PPG artifact if the bed sensor and radar show continuous, regular breathing.
Earable Tech: Sleep earbuds with built-in PPG, EEG, and bone-conduction speakers could provide sleep staging and deliver personalized soundscapes or gentle auditory stimuli to enhance deep sleep or lucid dreaming.
2. Non-Contact, Camera-Based Monitoring
Advanced computer vision, using infrared and time-of-flight cameras, can already track breathing rate and gross body movement without any wearables. Future algorithms may be able to detect sleep posture changes linked to apnea or measure pupillary response during micro-awakenings, all from a device on your nightstand. Privacy will be the paramount concern and design challenge here.
3. Advanced Biomarker Integration
Core Temperature: Patches or next-gen rings using dual-heat-flux technology or calibrated sensors promise accurate, non-invasive core temperature tracking, unlocking precise circadian phase mapping and hormonal cycle insights.
Blood Pressure: Techniques like pulse transit time (PTT)—measuring the delay between the heartbeat (ECG) and the pulse arrival at the periphery (PPG)—could enable continuous, cuffless blood pressure estimation during sleep, identifying non-dippers at risk.
Real-Time Glucose + Sleep Integration: The synchronization of CGM data with sleep-stage data will reveal how sleep quality affects nocturnal glucose stability and how blood sugar spikes from late eating disrupt sleep architecture.
4. Closed-Loop Stimulation Systems
This is the most futuristic and promising frontier: devices that detect and correct sleep in real time.
Acoustic Stimulation: Systems that monitor your brain waves via simplified EEG headbands (like Dreem) and deliver precisely timed "pink noise" bursts during deep sleep to enhance slow-wave oscillations, improving memory consolidation.
Thermal Stimulation: Wearable pads that gently warm the extremities or cool the core at optimal times to strengthen the circadian temperature drop and solidify sleep onset.
Transcranial Stimulation: Non-invasive methods like transcranial alternating current stimulation (tACS) could one day be used to gently guide the brain into specific sleep frequencies to boost deficient stages.
5. AI-Powered Hyper-Personalization & Predictive Health
The future of sleep software is a true AI sleep coach.
Predictive Insights: Instead of telling you how you slept, it will predict how you will sleep tonight based on your day's activity, stress, light exposure, and meal timing, offering pre-emptive behavioral adjustments.
Personalized Sleep Recipes: The AI will learn what works for you. "For Jane, a 20-minute meditation at 9 PM, with the room at 67°F, after a light protein snack at 7 PM, results in a 12% average increase in deep sleep." It will generate and refine these personalized protocols over time.
Early Disease Risk Detection: By establishing a hyper-detailed longitudinal baseline of your physiology, subtle deviations—in breathing patterns, heart rate rhythm, or oxygen variance—could serve as early warning systems for conditions like sleep apnea, atrial fibrillation, or metabolic syndrome, prompting earlier clinical investigation. This proactive, preventive approach is at the heart of the vision for many next-generation wellness companies, a philosophy you can delve into further on Oxyzen's about page.
The goal is no longer just a score, but a seamless, intelligent system that integrates into your environment and life, working quietly to protect and enhance one of your most vital health assets: your sleep.