The Health Metrics That Validate Your Wellness Habits
The metrics that confirm your healthy habits are working.
The Health Metrics That Validate Your Wellness Habits
For decades, wellness was a landscape of good intentions and vague feelings. You “felt” more energetic after a week of early nights. You “believed” your meditation was making you calmer. You “hoped” those daily walks were strengthening your heart. Our pursuit of health was guided by intuition and delayed, often subtle, feedback. We were navigating a complex biological system with little more than a hunch and a bathroom scale.
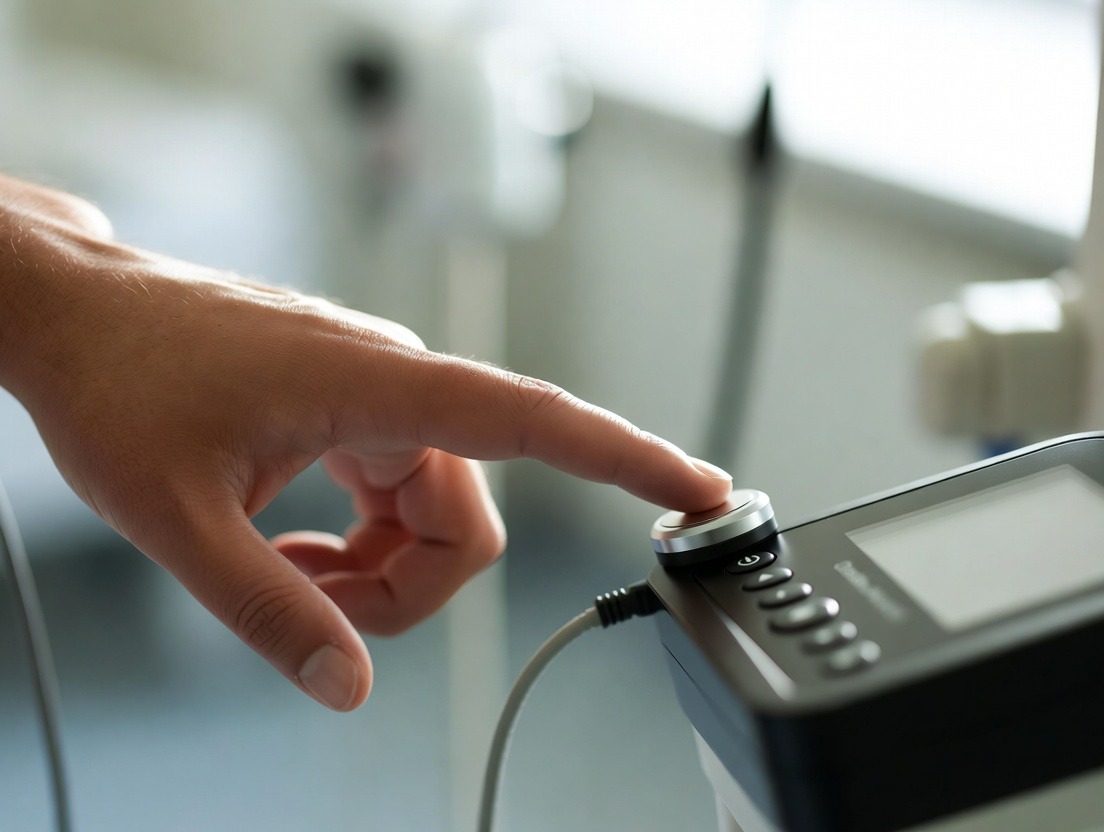
But a revolution is underway. We are transitioning from an era of wellness guesswork to an age of biometric certainty. The rise of personal health technology, particularly the sophisticated sensors packed into devices like the Oxyzen smart ring, has given us a direct line to our body’s inner workings. Suddenly, the opaque becomes transparent. Those intentions can now be validated, quantified, and optimized with hard data.
This is not just about tracking steps; it’s about understanding the profound language of your physiology. Your body is constantly speaking through a symphony of metrics—heart rate variability, blood oxygen saturation, skin temperature, and sleep stages. Each data point is a verse in the story of your health, revealing how your habits, stress, nutrition, and exercise truly impact your system at a foundational level.
This article is your guide to decoding that story. We will move beyond vanity metrics and dive deep into the key health biomarkers that serve as the ultimate validators for your wellness journey. These are the numbers that don’t lie, offering an unbiased report card on your lifestyle choices. By learning what these metrics mean and how to influence them, you shift from simply doing healthy things to knowing they are working. You move from hope to evidence, from effort to insight.
Welcome to the new paradigm of personalized health. Let’s begin by understanding the very foundation of it all: the crucial difference between simply tracking activity and measuring your body’s actual physiological response.
From Activity Tracking to Physiological Insight: Why Your Body’s Response is the True Metric
The fitness tracker on your wrist buzzes with congratulations: “10,000 steps achieved!” It’s a satisfying moment, a checked box in the daily pursuit of health. But this milestone, while motivational, tells an incomplete story. It records an output—a physical action you performed. The far more compelling narrative lies in your body’s input: its physiological response to that activity and everything else you do.
This is the critical evolution from first-generation wellness tech to the sophisticated biomonitoring we have today. Early devices were excellent logbooks. They counted steps, estimated calorie burn based on generic algorithms, and tracked workout duration. They answered the question, “What did I do?”
Modern technology, embodied in continuous health monitors like the Oxyzen smart ring, asks a deeper question: “How did my body react?”
Think of it this way: Two people can complete the same 30-minute run. Person A finishes with a moderately elevated heart rate that recovers quickly to their baseline, sleeps deeply that night, and shows balanced stress markers the next day. Person B finishes utterly drained, their heart rate stays elevated for hours, their sleep is restless, and their body shows signs of elevated stress. The activity log for both reads “30-min run.” But the physiological story is radically different. For Person A, the run was a beneficial stressor (a concept known as hormesis). For Person B, it may have been a strain that their body wasn’t ready for, perhaps due to underlying fatigue, poor recovery, or illness.
The metrics that reveal this story are not about motion; they are about your internal state.
Key Physiological Insights vs. Basic Activity Tracking:
Heart Rate Variability (HRV) vs. Steps: Steps measure volume of movement. HRV measures the subtle variations in time between your heartbeats, a powerful indicator of your autonomic nervous system balance and recovery status. A high HRV generally suggests your body is resilient and ready for stress. A low or dropping HRV is a flag that you may be overreaching, fatigued, or fighting an illness.
Resting Heart Rate (RHR) & Recovery vs. Exercise Minutes: Exercise minutes log duration. Your resting heart rate trend—especially how quickly your heart rate drops after exertion (heart rate recovery)—is a direct marker of cardiovascular fitness and parasympathetic (“rest-and-digest”) nervous system health.
Sleep Stages & Restoration vs. Sleep Duration: A basic tracker might tell you you slept 8 hours. A physiological sensor analyzes how much of that was deep sleep (critical for physical repair and immune function), REM sleep (essential for memory consolidation and mood), and light sleep. You can spend 8 hours in bed with poor sleep architecture and wake up feeling unrefreshed.
Body Temperature & Respiratory Rate vs. Calories Burned: Calorie estimates are notoriously imprecise. Your nocturnal core body temperature trend and respiratory rate, however, are fundamental vital signs. A elevated baseline temperature can signal the onset of illness, inflammation, or hormonal changes. An increased respiratory rate during sleep can be a sign of sleep apnea or other disturbances.
The shift to physiological insight empowers you to practice body literacy. You learn to connect cause and effect not through guesswork, but through data. That late-night meal didn’t just “feel” heavy; you can see it raised your nocturnal body temperature and reduced your deep sleep. That intense workweek didn’t just “feel” stressful; you can observe a steady decline in your HRV and a rise in your resting heart rate.
This is the validation we’ve been missing. It transforms wellness from a one-size-fits-all prescription into a personalized dialogue with your own body. To start this dialogue, we must first listen to one of the body’s most eloquent and telling signals: the rhythm of your heart, beyond just the beat.
The Heart of the Matter: Decoding HRV, Resting Heart Rate, and Cardiovascular Health
If you had to choose one organ as the maestro of your wellness symphony, it would be the heart. Its steady beat is the drum of life, but within that rhythm lies a complex language of health, resilience, and balance. For generations, we’ve understood a basic truth: a lower resting heart rate (RHR) is generally good. But now, with the ability to measure the subtle spaces between beats, we have access to a far richer story written by our autonomic nervous system.
Heart Rate Variability (HRV): The Gold Standard of Recovery and Resilience
HRV is not your heart rate. While your heart rate counts the number of beats per minute, HRV measures the precise, millisecond variations in the time intervals between consecutive heartbeats. This might sound like a technicality, but it is arguably the single most powerful non-invasive metric for assessing your body’s readiness and adaptability.
Why is variability a good thing? Think of a skilled drummer. They keep a steady tempo but with subtle, expressive fluctuations—they are responsive and adaptable. A metronome, by contrast, is perfectly rigid and unchanging. Your healthy heart is like the skilled drummer. High HRV indicates a strong, responsive autonomic nervous system, where the sympathetic (“fight-or-flight”) and parasympathetic (“rest-and-digest”) branches are in harmonious balance. Your body can efficiently ramp up to meet a challenge and then gracefully calm down to recover.
What Your HRV Tells You:
High or Improving HRV: A sign of good fitness, strong recovery, effective stress management, and overall resilience. It suggests your body is well-prepared to handle physical and mental stressors.
Low or Declining HRV: This is a potent warning signal. It can indicate overtraining, chronic stress, inadequate sleep, dehydration, poor nutrition, or the onset of illness. It’s your body’s way of saying, “I’m under too much strain and need a break.”
Validating Habits with HRV: This is where the magic happens. You can directly see how your lifestyle choices affect this core metric.
After a restful day of mindfulness and an early night: You’ll likely see an HRV increase the following morning.
Following a night of poor sleep or high alcohol consumption: You’ll often see a pronounced HRV dip.
As you build consistent cardio fitness over weeks: Your baseline HRV will typically trend upward.
Resting Heart Rate (RHR): The Baseline of Cardiovascular Fitness
While HRV speaks to nervous system balance, your RHR is a straightforward gauge of your heart’s efficiency. A well-conditioned heart muscle pumps more blood with each beat (higher stroke volume), so it doesn’t need to beat as often at rest.
Tracking RHR for Validation:
Long-Term Trend: A gradual decrease in your average RHR over months of consistent aerobic exercise is one of the clearest validations that your fitness routine is working.
Acute Spikes: A sudden, unexplained increase of 5-10 bpm above your personal baseline can be an early indicator of dehydration, fatigue, excessive stress, or illness—often before you feel symptoms.
Heart Rate Recovery (HRR): The Instant Report Card
Perhaps the most immediate cardiovascular validation comes from Heart Rate Recovery. This measures how quickly your heart rate drops in the first minute after peak exercise. A rapid drop (e.g., a decrease of 20+ beats in the first minute) is a strong sign of good cardiovascular health and efficient parasympathetic reactivation. If your recovery is slower, it can signal a need for more foundational aerobic work or better recovery practices.
By monitoring this trio—HRV, RHR, and HRR—you move far beyond “I worked out hard.” You can say, “My workout improved my heart’s efficiency,” or “My body needs an easy day today based on my recovery metrics.” This level of insight, available 24/7 from a device like the Oxyzen smart ring, turns your heart into a trusted coach, providing daily feedback on whether your habits are building you up or wearing you down. As we listen to the heart, we must also tune into the restorative process that profoundly affects it: sleep.
The Silent Healer: How Sleep Metrics Quantify Your Nightly Recovery
We spend roughly a third of our lives asleep, not as a passive state of inactivity, but in a state of intense biological activity. Sleep is the foundation upon which all other wellness habits are built. You cannot exercise effectively, manage stress, or think clearly on a foundation of poor sleep. Until recently, understanding sleep meant guessing based on how groggy we felt in the morning. Now, biometric sensors illuminate the architecture of our sleep, transforming it from a mysterious black box into a detailed blueprint for recovery.
Beyond Duration: The Four Pillars of Sleep Quality
While total sleep time matters, it is only the first chapter. True sleep quality is a multi-dimensional construct, best understood through these four pillars:
Sleep Stages (Architecture): A full sleep cycle lasts about 90 minutes and includes Light Sleep, Deep Sleep (Slow-Wave Sleep), and REM (Rapid Eye Movement) Sleep. Each stage has a non-negotiable role.
Deep Sleep: The physical restoration phase. This is when tissue growth and repair occur, energy is restored, and the immune system is strengthened. It’s crucial for physical recovery from exercise.
REM Sleep: The mental restoration phase. This is when the brain processes emotions, consolidates memories, and fosters learning and creativity. It’s essential for cognitive and emotional resilience. A healthy sleep architecture balances these stages throughout the night. Disruptions—like those from alcohol, late-night screen time, or an irregular schedule—skew this balance, robbing you of specific types of recovery.
Sleep Consistency (Timing): Your body thrives on rhythm. Going to bed and waking up at consistent times—even on weekends—strengthens your circadian rhythm. This internal clock regulates not just sleepiness, but hormone release, body temperature, and digestion. Inconsistent sleep times force your body to constantly readjust, leading to poorer quality sleep even if the duration is the same.
Sleep Efficiency: This is the percentage of time you spend actually asleep while in bed. Tossing and turning for an hour reduces sleep efficiency. A high efficiency (typically >85%) means you’re falling asleep relatively quickly and staying asleep, which is a sign of good sleep hygiene and low sleep-onset stress.
Restorative Power: This is a composite score that many advanced devices, including Oxyzen, calculate by analyzing the interplay of your sleep stages, heart rate, HRV, and movement during the night. It answers the question: “How restorative was this sleep session for my specific body?”
Validating Habits with Sleep Data
Your sleep metrics are a ruthless and honest auditor of your daytime and evening choices.
Validating Wind-Down Routines: See a boost in Deep Sleep after starting a “no screens 60 minutes before bed” policy? That’s validation. Notice your sleep efficiency improve after introducing a magnesium supplement or meditation? The data confirms it.
Exposing Sleep Saboteurs: That evening glass of wine may help you fall asleep, but the data will likely show it suppresses crucial REM sleep and leads to more wake-ups in the second half of the night. A late, heavy meal can raise your nocturnal body temperature, disrupting sleep architecture.
Connecting Exercise & Sleep: Observe how different types and timings of exercise affect your sleep. You might find that intense evening workouts delay sleep onset for you, while morning workouts lead to more Deep Sleep. The data personalizes these guidelines.
Catching Illness Early: A significant deviation from your normal sleep pattern—especially a spike in restless sleep or a change in your nighttime vital signs—can be one of the earliest signs of an oncoming cold or flu, often before you feel symptoms.
By quantifying sleep, we stop treating it as lost time and start recognizing it as our most potent performance-enhancing, health-building “activity.” To get the full picture of what happens during this restorative period, we must also monitor the vital signs that whisper our body’s secrets throughout the night.
The Nocturnal Narrative: Understanding Nightly Blood Oxygen (SpO2) and Respiratory Rate
While you are adrift in the world of dreams, your body is engaged in the critical work of maintenance and surveillance. Two of the most telling vital signs it broadcasts during this time are Blood Oxygen Saturation (SpO2) and Respiratory Rate. Monitored during the day, they are simple health snapshots. Tracked continuously throughout the night, they become a dynamic, diagnostic film revealing the quality of your breathing and oxygenation—a process so fundamental we rarely give it a second thought.
Nocturnal Blood Oxygen Saturation: The Oxygen Pipeline
SpO2 measures the percentage of hemoglobin in your blood that is carrying oxygen. For most healthy individuals at sea level, this sits comfortably between 95-100% during the day. At night, it’s normal for it to dip slightly. However, significant or frequent drops, known as desaturations, are a key indicator of sleep-disordered breathing.
What Your Nightly SpO2 Trend Reveals:
Stable, High SpO2: Suggests clear, unobstructed breathing and efficient oxygenation throughout the night—a sign of good respiratory and cardiovascular health during sleep.
Frequent Desaturations: These are often the “smoke” pointing to the “fire” of sleep apnea or hypopnea (shallow breathing). When your airway partially or fully collapses during sleep, you stop breathing momentarily, and your oxygen levels fall. Your brain then briefly rouses you to restart breathing, fragmenting your sleep. You may never remember these micro-awakenings, but they devastate sleep quality and strain your cardiovascular system.
Validation Through Data: If you’ve made a change to address suspected snoring or poor sleep—like using a nasal strip, changing sleep position, or losing weight—a stabilizing overnight SpO2 trend is powerful, objective validation that the intervention is working.
Respiratory Rate: The Rhythm of Breath
Your respiratory rate is the number of breaths you take per minute. Like heart rate, it has a natural circadian rhythm and is influenced by sleep stages. It typically slows and becomes very regular during Deep Sleep. An elevated average nighttime respiratory rate, or erratic spikes, can be a red flag.
Interpreting the Rhythm:
Consistent, Low Rate (~12-20 breaths/minute during sleep): Indicates efficient, relaxed breathing and a calm autonomic state.
Chronically Elevated Rate: Can be associated with sleep apnea, anxiety, heart failure, or other medical conditions. It suggests your body is working harder than it should be to breathe during rest.
Acute Spikes: Can correlate with periods of disturbed sleep, REM sleep (where breathing can become irregular), or the micro-awakenings from apneic events.
The Powerful Combination: Connecting the Dots
When analyzed together, SpO2 and respiratory rate tell a compelling story. A pattern of SpO2 drops followed by a spike in respiratory rate is the classic signature of your body struggling to breathe and then gasping to catch up. Monitoring these metrics provides a critical, at-home screening tool for sleep apnea—a condition that affects millions, often undiagnosed, and is a major risk factor for hypertension, heart disease, and stroke.
Beyond Apnea: A Window into Overall Health These metrics aren’t just for sleep disorders. A sudden change in your baseline nocturnal respiratory rate or SpO2 can be an early signal of respiratory infections (like the common cold or more serious illnesses), allergic reactions, or changes in cardiovascular fitness.
By paying attention to this nocturnal narrative, you are no longer in the dark about what happens when your head hits the pillow. You gain a proactive tool for safeguarding one of your most basic life functions: breathing. As we understand our breath, we must also feel the subtle thermal currents of the body, which provide another deep layer of insight.
The Body’s Thermostat: What Skin Temperature Trends Reveal About Health
Your body is a master of thermoregulation, working tirelessly to maintain a core temperature within a narrow, healthy range. This balance is governed by your circadian rhythm and is deeply influenced by your health, habits, and hormones. While a single temperature reading can tell you if you have a fever, tracking your nocturnal skin temperature trend provides a nuanced, dynamic picture of your internal state, revealing patterns invisible to a traditional thermometer.
The Circadian Rhythm of Temperature
In a healthy, rhythmically-aligned body, your temperature follows a predictable 24-hour wave:
Late Afternoon/Early Evening: Core temperature peaks.
As Bedtime Approaches: Your body begins to shed heat through your extremities (hands and feet). This drop in core temperature is a critical signal that initiates sleepiness.
During Sleep: Temperature reaches its lowest point, typically in the early hours of the morning.
Upon Waking: It begins to rise again to prepare you for the day.
When you track skin temperature continuously through the night with a device like a smart ring, you’re not measuring absolute core temperature, but you are capturing the relative trends and fluctuations of this cycle, which are incredibly informative.
Decoding the Thermal Trends: What Changes Mean
Elevated Nocturnal Baseline: A consistent upward shift in your average nighttime temperature can be one of the earliest signs of:
Illness Onset: Your body raises its temperature to create a less hospitable environment for pathogens, often 24-48 hours before other symptoms appear.
Inflammation: The body’s inflammatory response releases cytokines that can act as pyrogens, raising body temperature.
Hormonal Changes: For women, a sustained temperature shift is a key marker of ovulation and part of the natural menstrual cycle. It can also be indicative of peri-menopausal changes.
Blunted or Disrupted Temperature Drop: If your body fails to cool down effectively at night, it can directly impair sleep onset and quality. This can be caused by:
Late Exercise: Intense workouts too close to bedtime can keep core temperature elevated.
Alcohol Consumption: While alcohol may make you feel drowsy, it disrupts thermoregulation and often leads to a temperature spike later in the night, fragmenting sleep.
Sleeping Environment: A room that’s too warm or bedding that doesn’t allow heat to dissipate.
Increased Temperature Variability: A restless night with frequent awakenings often shows up as a jagged, variable temperature line, as the process of waking and falling back asleep interferes with smooth thermoregulation.
Validating Lifestyle with Thermal Data
Your temperature data serves as a superb biofeedback tool:
Diet & Digestion: Notice a temperature spike after a late, rich meal? The data validates the wisdom of finishing eating 2-3 hours before bed.
Recovery & Overtraining: In conjunction with HRV, a creeping upward temperature trend can be a sign of systemic fatigue and the body working harder to repair itself, suggesting a need for more rest.
Cycle Syncing: For women, this data is transformative. It provides objective confirmation of ovulation and distinct cycle phases, allowing for the validation of habit changes tailored to energy levels throughout the month (a practice known as cycle syncing).
Your skin temperature trend is a silent, continuous readout of your metabolic and hormonal engine. It connects the dots between your external habits and your internal physiological state, offering yet another layer of objective validation. While temperature speaks to our internal energy regulation, another set of metrics captures our external energy expenditure and its quality.
Movement with Meaning: From Steps to Active Heart Rate Zones and Recovery
The “10,000 steps” mantra served a purpose: it got us moving. But in the era of physiological insight, we must evolve from counting movements to qualifying them. Not all steps are created equal, and not all movement serves the same purpose in your wellness portfolio. The goal is to move with intention, using your body’s real-time response to guide the type, intensity, and duration of your activity for maximum benefit and minimal risk.
The Limitation of the Step Count
A step is a step, whether it’s a leisurely stroll or a sprint. The metric lacks context. It doesn’t differentiate between a cardio-strengthening workout and incidental movement (which is still valuable, but for different reasons). Relying solely on steps can lead to “junk volume”—a lot of movement that doesn’t necessarily improve fitness—and can potentially encourage overuse injuries.
The Power of Heart Rate Zones: Exercising with Purpose
Training by heart rate zone shifts the focus from external output (“I ran 5K”) to internal response (“I spent 20 minutes in Zone 2”). Each zone targets different physiological adaptations:
Zone 1 (Very Light / Recovery): 50-60% of max HR. Promotes active recovery, boosts circulation without stress.
Zone 2 (Light / Aerobic Base): 60-70% of max HR. This is the cornerstone of metabolic fitness. It improves mitochondrial density, teaches your body to burn fat for fuel, and builds endurance with low systemic fatigue. Validation: A lower heart rate at the same pace over time shows your aerobic base is improving.
Zone 3 (Moderate / Aerobic): 70-80% of max HR. Still aerobic but more challenging. Improves cardiovascular capacity.
Zone 4 (Hard / Threshold): 80-90% of max HR. Increases lactate threshold, allowing you to sustain a harder pace for longer.
Zone 5 (Maximum): 90-100% of max HR. Builds peak performance and power, but is highly fatiguing and should be used sparingly.
By tracking time in zones, you ensure your workouts have a clear purpose. Are you building your aerobic engine today (Zone 2), or are you working on speed (Zone 4/5)? The data validates that you executed the intent of your workout correctly.
The Critical Metric: Post-Exercise Recovery
Perhaps more important than the workout itself is what happens after. How quickly does your body return to homeostasis?
Heart Rate Recovery (HRR): As discussed, a fast drop is a sign of fitness.
Impact on Nocturnal Metrics: A well-tolerated workout will result in a night of high sleep efficiency and strong HRV. A workout that was too intense or poorly timed may show up as elevated resting heart rate, lower HRV, and disturbed sleep.
This is the ultimate validation loop: You perform a workout (stimulus) and use recovery metrics (response) to gauge if it was appropriate. If your recovery is severely compromised, it was likely too much, and you should adjust future sessions. This is the essence of data-driven periodization, preventing overtraining and promoting consistent progress.
Non-Exercise Activity Thermogenesis (NEAT) – The Unsung Hero
While focused training is crucial, don’t discount the power of NEAT—the calories you burn through all activity except sleeping, eating, and exercise. This includes walking, fidgeting, standing, and household chores. Tracking overall daily activity levels (beyond steps) can validate habits like taking walking meetings, using a standing desk, or pacing while on the phone. These small, consistent movements significantly impact metabolic health and are foundational to a holistic movement practice.
By moving from steps to zones and prioritizing recovery data, you transform movement from a blind ritual into a strategic, evidence-based tool for building a more resilient body. This strategic approach to physical output is mirrored by the need to manage our physiological input from the world around us: stress.
The Stress Signature: Measuring Your Body’s Load Through HRV, Sleep, and RHR
Stress is not a feeling; it is a measurable physiological state. It’s the body’s nonspecific response to any demand placed upon it, from a hard workout (eustress) to a looming deadline (distress). The problem in modern life is rarely acute stress, but chronic, low-grade distress that keeps our nervous system in a perpetual state of low-level alarm. This “hidden load” can erode health silently—until we learn to measure its signature.
Your body doesn’t differentiate between a bear chasing you and an overflowing inbox; it triggers the same cascade of hormones (like cortisol and adrenaline) to prepare for “fight or flight.” While essential for survival, when this state becomes chronic, it leaves a clear fingerprint on your biometrics.
The Triad of Stress Indicators
Heart Rate Variability (HRV): The Stress Canary HRV is your most sensitive real-time stress gauge. The sympathetic nervous system (stress response) decreases HRV, making your heart rhythm more rigid. The parasympathetic system (rest state) increases HRV, adding healthy variability. A sustained drop in your HRV baseline is one of the clearest objective signs that your total stress load—physical, mental, emotional—is exceeding your capacity to recover. For a deeper dive into how different stressors affect your nervous system, explore our dedicated resources on the Oxyzen.ai blog.
Resting Heart Rate (RHR): The Strain Gauge Chronic stress activates the sympathetic nervous system, which can elevate your resting heart rate. If your RHR trends upward over days or weeks without an increase in training load, it’s a strong signal that your body is under systemic strain. It’s working harder, even at rest.
Sleep Architecture: The Nightly Reckoning Stress and sleep have a vicious bidirectional relationship. Stress disrupts sleep, and poor sleep elevates stress hormones. Biometrically, you’ll see this as:
Difficulty falling asleep (elevated heart rate at bedtime).
Reduced Deep Sleep: The body prioritizes lighter, more alert sleep states when it perceives threat.
Increased nighttime awakenings or restless sleep.
Elevated nocturnal heart rate overall.
Distinguishing Good Stress from Bad Stress
This is where validation becomes profound. The goal is not to eliminate stress, but to manage your stress + recovery balance.
A Hard Workout (Good Stress): May cause a temporary dip in HRV and a slight RHR increase that night, but if followed by good recovery habits, it rebounds strongly by the next morning or the day after, often to a higher baseline. This is adaptation.
Chronic Work Stress (Bad Stress): Causes a gradual, sustained decline in HRV, a creeping rise in RHR, and persistently poor sleep scores. There is no rebound, only depletion. This is strain.
Validating Your Stress-Management Habits
Your biometrics are the perfect lab for testing de-stressing techniques.
After a 20-minute meditation: Does your HRV show an acute rise? Does your real-time heart rate drop?
Following a digital detox weekend: Do you see a notable improvement in your sleep scores and morning HRV?
When you practice breathing exercises before bed: Does your sleep onset time improve?
Seeing concrete data that a mindfulness app, a walk in nature, or a therapy session improves your physiological markers is the ultimate motivation to maintain those habits. It turns abstract self-care into a tangible, results-driven practice. Understanding this stress signature allows you to consciously influence it, often starting with the most fundamental tool we have: our breath. For practical guidance on leveraging your biometrics for stress management, our FAQ page offers helpful starting points.
The Breath-Body Connection: Using Respiratory Rate and HRV for Real-Time Calm
If your nervous system is the orchestra of your stress response, then your breath is the conductor’s baton. It is the one autonomic function that is both automatic and instantly accessible to conscious control. This unique position makes it a powerful bridge between the mind and the body, and now, with real-time biometric feedback, we can close the loop and see exactly how intentional breathing shifts our physiology from a state of stress to a state of calm.
The Direct Line to Your Autonomic Nervous System
When you are stressed or anxious, your breathing becomes shallow, rapid, and erratic—originating from the chest. This directly stimulates the sympathetic (“fight-or-flight”) nervous system. Conversely, slow, deep, and rhythmic diaphragmatic breathing stimulates the vagus nerve, the main highway of the parasympathetic (“rest-and-digest”) system, triggering a relaxation response.
What You Can Measure in Real-Time:
Respiratory Rate (RR): The most immediate change. A conscious effort to slow your breathing from, say, 18 breaths per minute to 6-8 breaths per minute is instantly quantifiable.
Heart Rate (HR): As you slow your breath, your heart rate will begin to drop in tandem. This is called respiratory sinus arrhythmia—a healthy phenomenon where the heart rate increases slightly on the inhale and decreases on the exhale.
Heart Rate Variability (HRV): This is the gold-standard outcome. A successful breathing session will cause an acute, measurable increase in HRV, indicating a direct boost to parasympathetic tone and nervous system balance.
Biofeedback in Action: Turning Data into Calm
This is where technology transforms an ancient practice into a precision tool. Imagine this scenario:
You feel anxious before a meeting.
You open your companion app for your Oxyzen ring and start a guided breathing session.
On your screen, you see a visual pacer for inhalation and exhalation.
More importantly, you see a live graph of your heart rate and HRV.
As you follow the pacer, you watch your heart rate line fall and your HRV line rise in real-time.
This is powerful biofeedback. It removes all doubt. You are no longer hoping the breathing is working; you are seeing it work in your own body’s data. This creates a potent positive reinforcement loop, strengthening the mind-body connection and making the practice more engaging and effective.
Validating Different Breathing Techniques
Not all breathing exercises are the same, and their effects can be personalized:
Coherent or Resonant Breathing (~5.5 breaths per minute): Often found to maximize HRV increase and create a strong sense of calm. The data can validate if this pace is optimal for you.
Box Breathing (4-4-4-4): Excellent for focus and managing acute stress. You might see a sharper, more immediate heart rate drop.
Extended Exhalation (e.g., 4-in, 6-out): Prioritizes parasympathetic activation. The data can show how a longer exhale specifically impacts your HRV spike.
By using your respiratory rate and HRV as guideposts, you can experiment and discover which breathing practice delivers the most significant physiological shift for you. This turns stress management from a generic recommendation into a personalized, data-validated skill. The story of your breath is intimately tied to another daily rhythm that governs your energy, focus, and overall health: your circadian cycle.
Circadian Rhythm Alignment: How Temperature and Sleep Data Optimize Your Daily Cycle
You are not the same person physiologically at 9 AM as you are at 9 PM. Your body operates on a finely tuned 24-hour internal clock known as your circadian rhythm. This master clock, located in the brain’s hypothalamus, orchestrates the timing of virtually every process in your body: hormone secretion, metabolism, cell repair, cognitive function, and, of course, sleep and wakefulness. Aligning your habits with this rhythm—a practice known as circadian hygiene—is one of the most powerful things you can do for your health. And now, we can measure our alignment objectively.
Your Biometric Circadian Report Card
Two metrics are paramount for assessing circadian health:
Core Body Temperature Rhythm: As discussed, your temperature has a distinct wave. The timing of the drop in the evening and the rise in the morning are key circadian markers. A well-aligned rhythm shows a predictable, smooth curve. A disrupted rhythm shows a blunted drop, a shifted peak, or excessive variability.
Sleep-Wake Consistency: The timing of your sleep, especially your wake-up time, is the most powerful “zeitgeber” (time-giver) for your internal clock. Consistent sleep and wake times, even on weekends, anchor your rhythm.
The Consequences of Misalignment
When your external behavior conflicts with your internal clock—known as social jet lag—you create metabolic and cognitive chaos. This happens with:
Erratic sleep schedules
Late-night exposure to blue light (screens)
Eating late at night
Inconsistent workout times
Biometrically, misalignment manifests as:
Poor sleep efficiency and fragmented sleep.
Lower HRV and higher resting heart rate.
A flattened or shifted temperature rhythm.
Reduced daytime energy and focus.
Validating Circadian-Aligned Habits
Your data provides direct feedback for syncing with your rhythm:
Morning Light Exposure: Do you see an earlier, sharper temperature rise and better daytime energy metrics after making a habit of getting morning sunlight?
Consistent Meal Times: Does eating your last meal earlier and at a consistent time lead to a deeper temperature drop and better deep sleep?
Digital Sunset: Does implementing a “no screens” rule 90 minutes before bed improve your sleep onset time and heart rate dip at night?
Optimized Workout Timing: The data can reveal if you sleep better and recover faster with morning workouts versus evening ones, based on your personal temperature and recovery curves.
By treating your circadian rhythm as a core health metric to be optimized, you move from fighting your natural biology to working with it. This synergy reduces systemic stress and enhances the efficiency of all other wellness habits. For those interested in the science of chronobiology and our founding philosophy on holistic health tracking, you can learn more about our story and mission here.
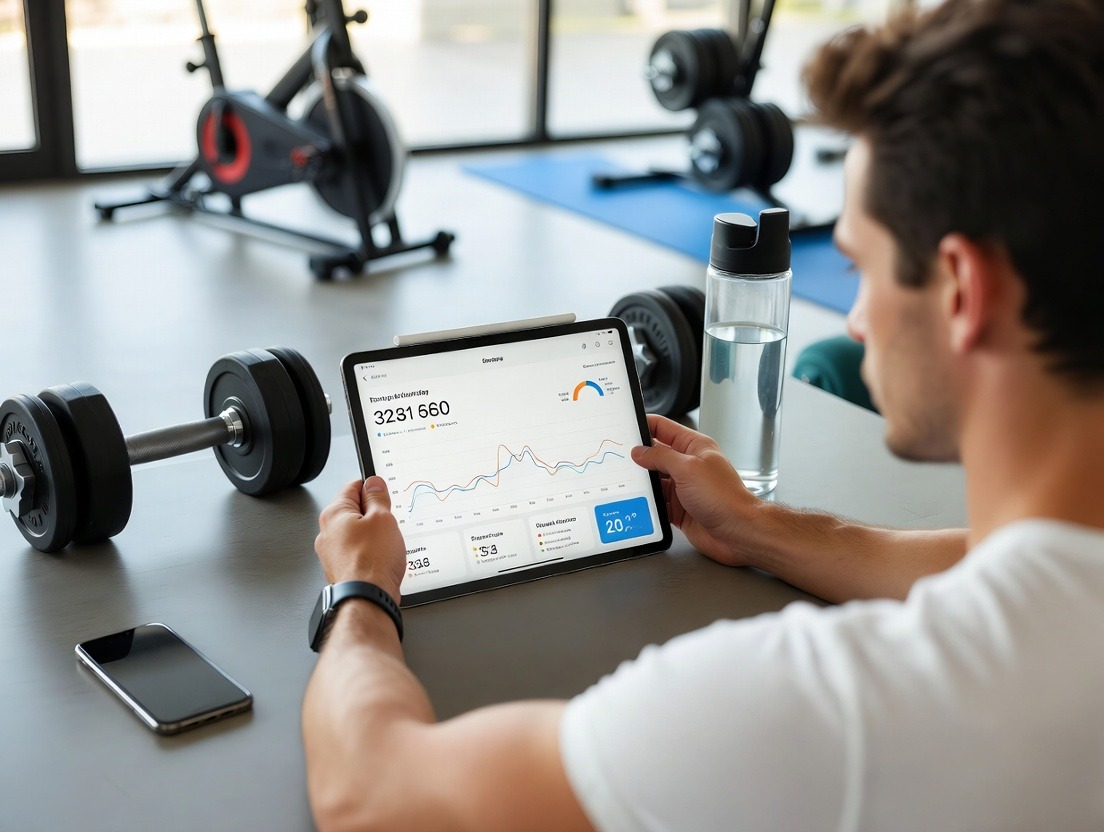
The Holistic Dashboard: Integrating Metrics for a Complete Picture of Wellness
We’ve now explored the individual instruments in your biometric orchestra: the heart (HRV, RHR), the breath (SpO2, RR), the rhythm (sleep, temperature), and movement. But the true magic, the symphony itself, emerges only when you listen to them all together. A single metric in isolation can be misleading. A low HRV might signal overtraining, or it might signal an oncoming illness. But when you see that low HRV combined with an elevated nighttime temperature and a higher resting heart rate, the picture becomes clear: your body is fighting something.
This integrated, holistic view is the superpower of continuous health monitoring. It allows you to perform contextual analysis, moving from “What is this number?” to “What is my body trying to tell me?”
The Power of Correlations: Connecting the Dots
Stress & Sleep Correlation: A stressful day (low HRV, high RHR) leading to a poor night’s sleep (low efficiency, high restless sleep) is a common pattern. The validation? Improving daytime stress management should improve sleep scores. You can now prove it.
Exercise & Recovery Correlation: A hard workout (time in high heart rate zones) followed by excellent recovery (quick HRR, high sleep HRV, increased deep sleep) validates your fitness and recovery protocols. If the recovery is poor, it signals a need to adjust intensity or prioritize rest.
Diet & Vital Signs Correlation: That late-night pizza may show up as a elevated nocturnal temperature, a dip in SpO2 due to inflammation, and reduced deep sleep. The holistic dashboard makes the cost visible.
Identifying Your Personal Baselines and “Normal”
The most important benchmarks are not population averages; they are your personal baselines. What is a “good” HRV for you? What is your typical temperature drop? It’s the deviations from your own normal that are most meaningful. Over time, you learn your body’s unique language:
“A 10% drop in my HRV with a stable temperature usually means I need a lighter training day.”
“A 0.3°C rise in my nighttime temperature for two nights means I’m likely getting sick.”
The Cycle Syncing Advantage: Leveraging Data for Hormonal Balance and Women’s Health
For women, the standard, linear model of health tracking—where each day is expected to be roughly the same—is fundamentally flawed. It ignores the powerful, predictable, yet highly individual monthly rhythm orchestrated by sex hormones. Estrogen and progesterone don’t just regulate reproduction; they influence everything from metabolism, energy, and temperature to sleep architecture, stress resilience, and recovery capacity. A one-size-fits-all approach to wellness not only fails women but can leave them feeling broken when their body doesn’t conform to a static plan. Biometric data is the key to moving from frustration to fluency in the language of your cycle.
Seeing the Invisible: Metrics That Mirror Your Cycle
A continuous health monitor acts like a hormonal seismograph, picking up the subtle shifts that define each phase.
Basal Body Temperature (BBT): The classic signifier. A sustained rise in waking or nocturnal skin temperature of about 0.3-0.5°C (0.5-1.0°F) confirms that ovulation has occurred, marking the transition from the follicular phase (lower temp) to the luteal phase (higher temp). This is invaluable data for understanding fertility, confirming ovulation, or simply tracking your phase without guesswork.
Resting Heart Rate (RHR): Often follows a similar pattern to temperature. RHR is typically lowest during menstruation, begins to rise in the follicular phase, and peaks in the mid-luteal phase before dropping again if pregnancy doesn’t occur.
Heart Rate Variability (HRV): Research and user data show HRV often follows an inverse pattern to RHR. It may be higher in the follicular phase (under the influence of rising estrogen) and lower in the luteal phase (as progesterone and its metabolites can have a calming, sometimes sedative effect, and the body works harder metabolically).
Sleep Patterns: Progesterone is a soporific and thermogenic hormone. In the luteal phase, you might see:
Increased deep sleep early in the phase (due to progesterone’s sedating effect).
Potential for more sleep disturbances and lighter sleep as the phase progresses and progesterone falls.
A slightly elevated nocturnal core temperature throughout.
Validating Cycle-Synced Habits: From Theory to Proof
The concept of “cycle syncing”—aligning diet, exercise, and work with your hormonal phases—moves from trendy theory to a data-validated practice.
Exercise Validation: The data powerfully supports modulating your training.
Follicular Phase (Post-Period to Ovulation): With rising estrogen, energy and insulin sensitivity often improve. You might find your body tolerates higher-intensity workouts (HIIT, heavy strength training) exceptionally well, with strong performance metrics and quick recovery (good HRV rebound). The data validates pushing harder here.
Luteal Phase (Post-Ovulation to Period): Rising progesterone increases core temperature and shifts the body to prefer fat for fuel. You may see your heart rate is higher at the same workout intensity, and recovery is slower. The data validates shifting to moderate, “feel-good” movement like strength maintenance, yoga, Pilates, or Zone 2 cardio, reducing systemic stress.
Nutrition & Recovery Validation: Cravings for carbohydrates in the luteal phase are physiologically driven as the body’s metabolic rate increases. Seeing a higher resting heart rate and temperature can be your cue to honor your body’s need for more complex carbohydrates and to prioritize extra sleep and stress-reduction techniques. You can track how these choices impact your sleep quality and next-day energy metrics.
Identifying Deviations: Consistently anovulatory cycles (no temperature shift), extremely short luteal phases, or severe metric disruptions (like terrible sleep and low HRV throughout the luteal phase) can provide objective data to discuss with a healthcare provider, moving the conversation from subjective symptoms (“I feel awful”) to measurable patterns.
For women, this isn’t just wellness optimization; it’s a reclaiming of agency. It provides a framework for self-compassion and strategic action, turning a source of potential confusion into a powerful, predictable tool for planning and performance. As we master the rhythms within, we must also learn how to strategically apply effort and recovery—the fundamental dance of progress known as periodization.
The Science of Adaptation: Using Metrics to Guide Effective Training Periodization
In the pursuit of fitness, more is not always better. Progress is not a straight line upward; it’s a wave of stimulus and response, stress and recovery. This intentional undulation is called periodization—the systematic planning of training to maximize adaptation while minimizing injury and overtraining. Historically, periodization relied on prescribed workout plans and subjective “feel.” Now, with biometrics, you have a real-time window into your body’s readiness to accept the stress of a workout and its capacity to recover from it. This allows for autoregulation: letting your body’s data dictate the day’s plan.
From Prescribed Plans to Dynamic Readiness
A traditional plan might say: “Monday: Heavy Squats.” But what if Monday morning your HRV is 15% below your baseline, your resting heart rate is elevated, and your sleep score was poor? The prescribed heavy squats are now a high-risk, low-reward endeavor, likely to dig you deeper into a recovery hole.
A readiness score—a composite algorithm often used by devices like Oxyzen that considers HRV, RHR, sleep, and temperature—flips the script. It answers the question: “How prepared is my body to handle stress today?”
High Readiness Score: Your body is resilient, recovered, and primed for a challenging stimulus. This is the day to go for that personal record, do the high-intensity interval session, or tackle a demanding cognitive project.
Low Readiness Score: Your body is signaling fatigue, strain, or potential illness. This is the day for active recovery (a walk, light mobility), strict stress management, hydration, and an early bedtime. Pushing hard today is counterproductive.
Validating Your Training Blocks
Biometrics provide the ultimate validation for your periodization strategy across weeks and months.
Building Phase (Progressive Overload): As you gradually increase training volume or intensity, you should see a corresponding long-term trend of improving fitness metrics: a lower resting heart rate, a higher HRV baseline, faster heart rate recovery. This confirms the stress is “eustress”—it’s making you better.
Taper & Recovery Phase: As you deliberately reduce training load before an event or after a hard block, you should see your readiness scores and recovery metrics (sleep HRV, deep sleep) sharply improve. This validates that the taper is working and you are “peaking” for performance.
Identifying Overtraining (Non-Functional Overreaching): This is the critical warning system. A prolonged period where your training load stays high but your metrics consistently trend in the wrong direction—chronically low HRV, elevated RHR, poor sleep, elevated temperature—is the hallmark of overtraining syndrome. The data provides an objective off-ramp long before injury or burnout occurs.
The Personalization of Recovery
Just as the optimal training stimulus is personal, so is recovery. Your data helps you identify your most effective recovery tools:
Does an extra 30 minutes of sleep move your HRV more than a meditation session?
Does an Epsom salt bath lower your evening heart rate and improve sleep depth?
Does a 20-minute nap effectively reboot your afternoon HRV?
By using metrics to guide periodization, you stop fighting your body and start collaborating with it. You train smarter, not just harder, ensuring that every ounce of effort is invested at the right time for the maximum return. This scientific approach to building physical resilience is the final piece in understanding how to use data not just to track health, but to actively and strategically build a more robust, vibrant, and validated life.
Building Your Bio-Individual Blueprint: Personal Baselines and Meaningful Deviations
In the world of health metrics, the most dangerous number is the population average. A “normal” resting heart rate of 72 BPM is meaningless if your personal, healthy baseline is 58. A “good” HRV of 60 ms is irrelevant if you typically thrive at 40 ms or 100 ms. The true power of continuous tracking isn't in comparing yourself to others; it’s in the profound act of getting to know yourself. This process of establishing your bio-individual blueprint—your unique set of normal ranges—is the foundational step that turns raw data into actionable, personal wisdom.
Why Averages Lie and Personal Baselines Tell the Truth
Physiological metrics are influenced by a myriad of factors: genetics, age, sex, fitness history, and even the size of your heart. Two equally fit individuals can have HRV values that differ by 50% and both be perfectly healthy. Therefore, the only benchmark that matters is you versus you.
Establishing a baseline requires consistent tracking over time—typically a minimum of 30 days to account for natural cycles (like menstruation or seasonal changes) and to smooth out daily noise. During this observation phase, you’re not trying to “optimize”; you’re gathering data on your unique, unforced rhythm.
What to Establish:
Resting Heart Rate (RHR) Baseline: Your typical range (e.g., 54-58 BPM) when well-recovered.
HRV Baseline: Your personal midpoint and range. Is it 35 ms ± 5, or 85 ms ± 10? The trend is more important than any single number.
Sleep Baseline: Your typical sleep efficiency, deep/REM sleep percentages, and wake-up times.
Temperature Baseline: Your typical nocturnal range and the pattern of your circadian dip.
The Art of Interpreting Deviations: Signals vs. Noise
Once you know your normal, you can spot the abnormal. The key is distinguishing meaningful signals from everyday noise.
Noise: A single-day dip in HRV after one poor night’s sleep. A slight temperature blip. These are normal fluctuations.
Signal: A sustained deviation—a trend moving in one direction for 3+ days, or a sharp, acute change that correlates with a clear event.
A Positive Signal: A gradual, sustained rise in your HRV baseline over months of consistent training and good sleep.
A Negative Signal: A steady 5-day decline in HRV coupled with a rising RHR and restless sleep, indicating accumulating stress or illness onset.
The “Why” Behind the “What”: Context is King
Your blueprint comes alive when you annotate it. This is the practice of logging context—the “why” behind the “what.”
Tag Your Days: Use your app’s journal feature or notes to mark: “Hard Leg Day,” “Client Presentation,” “Dinner Out w/ Alcohol,” “Started Feeling Scratchy Throat,” “Vacation Started.”
Correlate, Don’t Just Collect: After 60-90 days, patterns emerge that are uniquely yours. You’ll learn:
“For me, two consecutive days of high-intensity training drops my HRV by 20%. I need a full rest day after.”
“My temperature reliably rises 0.4°C 12 days after my period starts, confirming ovulation.”
“Even one glass of wine reduces my REM sleep by 15%.”
“My optimal sleep occurs when I finish eating before 7:30 PM.”
This bio-individual blueprint transforms you from a data collector into a self-expert. You develop an intuitive sense, backed by evidence, of what your body needs. It empowers you to make proactive, personalized decisions, moving from reactive healthcare to proactive self-care. To learn more about how to start building your own blueprint with the right tools, you can explore the Oxyzen approach to personalized insights.
From Data to Decisions: Actionable Frameworks for Common Goal Scenarios
Knowledge without action is merely trivia. The ultimate value of your biometric dashboard is its ability to inform daily, weekly, and monthly decisions that directly align with your goals. Let’s translate insights into action with frameworks for three common wellness objectives.
Goal 1: Enhancing Energy and Reducing Fatigue
The Data Focus: Sleep architecture, HRV, and resting heart rate.
The Framework:
Prioritize Sleep Consistency: Use your data to find your ideal sleep window. Lock in a consistent bedtime and wake-up time, even on weekends. Watch your sleep efficiency score rise and morning resting heart rate stabilize.
Optimize Sleep Quality: If your data shows low deep sleep, experiment with evening habits: a hot bath 90 minutes before bed (aids the temperature drop), magnesium supplementation, or eliminating blue light. Validate with improved deep sleep percentage.
Manage Daytime Stress Load: Use your daytime HRV trend as a gauge. If you see a steep afternoon drop, implement a 5-minute breathing session. The goal is to finish the day with your nervous system not in overdrive, which will reflect in better sleep-onset metrics.
Fuel for Sustained Energy: Notice if large carbohydrate-heavy lunches cause an afternoon energy crash correlated with a heart rate spike and HRV drop. Experiment with balanced meals of protein, fat, and fiber to see if they promote more stable afternoon metrics.
Goal 2: Optimizing Fitness and Body Composition
The Data Focus: Heart Rate Zones, HRV/RHR Recovery, Nocturnal Temperature.
The Framework:
Train by Zones, Not Just Feel: Ensure 80% of your weekly cardio is in Zone 2 (aerobic base). Validate this by seeing a lower heart rate at the same pace/rpm over 6-8 weeks. This builds metabolic efficiency for fat utilization.
Let Recovery Dictate Intensity: Never do a high-intensity session on a “Low Readiness” day. Use those days for Zone 1 recovery or mobility. Save high-intensity work for “High Readiness” days to ensure quality stimulus and minimize injury risk.
Use the Nightly Report Card: The most important workout metric is the next morning’s recovery data. A successful, well-tolerated workout should result in a strong HRV and good deep sleep. If it doesn’t, the workout was too intense, too long, or too poorly timed.
Connect Nutrition to Recovery: Post-workout, monitor how different recovery meals/proteins affect your nocturnal temperature and sleep. Inflammation from poor food choices can slow recovery, visible in your data.
Goal 3: Building Stress Resilience and Emotional Balance
The Data Focus: HRV, Resting Heart Rate, Sleep Onset Latency.
The Framework:
Establish a Biofeedback Breathing Practice: As outlined earlier, use real-time HRV and heart rate displays during guided breathing. Aim for 5-10 minutes daily, not just when stressed. Track the long-term impact on your baseline HRV.
Identify and Mitigate Stressors: Use journal tags. If you consistently see poor metrics on days with back-to-back meetings, it’s a data-driven mandate to build in 10-minute buffers. If social events spike your temperature and wreck your sleep, you can plan for them strategically with better next-day recovery.
Validate “Soft” Practices: Does your 20-minute meditation cause an acute HRV rise? Does a nature walk lower your average heart rate for the afternoon? The data turns these from “should-do’s” into “must-do’s” because you see their tangible, physiological benefit.
Protect Sleep as Your Non-Negotiable Reset: Stress resilience is impossible with poor sleep. Use sleep data to defend your wind-down routine fiercely. A high sleep score is your armor against the next day’s stressors.
These frameworks are starting points. Your bio-individual blueprint will refine them into a perfectly customized operating manual. For more scenario-specific strategies and user experiences, our community often shares their journeys on the Oxyzen blog.
The Longevity Lens: Tracking Metrics That Predict Long-Term Health
Wellness is not just about feeling good today; it’s about investing in a healthier, more vibrant future. Many of the biomarkers we’ve discussed are not merely indicators of daily readiness; they are powerful predictive biomarkers of longevity and healthy aging. By optimizing them now, you are directly influencing your healthspan—the number of years you live in good health.
The Hallmarks of Aging, Measurably
Several key metrics tracked by advanced wearables correlate strongly with systemic aging and disease risk.
Resting Heart Rate (RHR): A longitudinal study of healthy adults published in the Journal of the American Medical Association found that a rising RHR over decades was associated with a significantly higher risk of death from ischemic heart disease. Maintaining a low, stable RHR is a hallmark of cardiovascular resilience.
Heart Rate Variability (HRV): HRV is perhaps the single best non-invasive measure of biological age at the system level. Age-related decline in HRV is well-documented, as the autonomic nervous system becomes less flexible. However, this decline can be slowed, halted, or even reversed through lifestyle. A high HRV for your chronological age suggests a “younger”, more resilient nervous system.
Nocturnal Blood Oxygen (SpO2): Frequent nocturnal desaturations, even mild ones not diagnosed as sleep apnea, are associated with increased oxidative stress, systemic inflammation, and higher long-term risk of hypertension, atrial fibrillation, and cognitive decline. Maintaining stable nighttime SpO2 is critical for cellular health.
Sleep Consistency and Deep Sleep: The depth and regularity of sleep are fundamental to the body’s repair processes. Consistently poor deep sleep is linked to the accumulation of amyloid plaques in the brain (associated with Alzheimer’s), impaired glymphatic system clearance (the brain’s waste-removal system), and weakened immune function. A stable, robust sleep architecture is a pillar of longevity.
Circadian Rhythm Stability: As we age, circadian rhythms can become blunted and desynchronized, contributing to metabolic disorders, cognitive decline, and inflammation. A strong, consistent temperature rhythm and sleep-wake cycle are indicators of a robust internal clock, which is foundational for healthy aging.
The Lifestyle Leverage: Investing in Your Healthspan
Tracking these metrics provides a feedback loop for the most impactful longevity interventions:
Aerobic Exercise (Zone 2): Directly improves RHR, HRV, and sleep quality. The data validates that you’re doing enough to stimulate mitochondrial biogenesis (the creation of cellular energy factories) without causing excessive stress.
Dietary Patterns: Observing how your nocturnal temperature and inflammation markers (like elevated resting heart rate) respond to different foods guides you toward an anti-inflammatory, longevity-supporting diet. Does a 16-hour fast improve your morning HRV and lower your RHR? The data can tell you.
Stress Mastery: Chronic stress accelerates cellular aging via telomere shortening. By using HRV to guide daily stress-management practices, you are actively protecting your cells from this premature aging.
By viewing your dashboard through a longevity lens, every daily choice becomes an investment in your future self. You are no longer just “getting through the day”; you are architecting a decades-long trajectory of vitality. This proactive, data-informed approach to healthspan naturally leads to a more collaborative and informed relationship with the traditional healthcare system.
Bridging the Gap: Integrating Biometric Data with Professional Healthcare
The rise of personal biometrics represents a seismic shift in the patient-provider relationship. You are no longer a passive subject describing symptoms in a 15-minute annual visit. You arrive as an engaged partner, armed with a longitudinal dataset that reveals trends, triggers, and baseline deviations often invisible in a clinical snapshot. This integration, however, requires a thoughtful approach to be truly effective.
Empowering the Patient: From Subjective to Objective
Gone are the days of “I feel tired a lot.” Now, you can say: “Over the past three months, my resting heart rate has trended up from an average of 58 to 68 BPM, my HRV has dropped 25%, and my deep sleep has decreased by 30% despite being in bed longer. This decline started during a period of high work stress, but has not resolved.”
This is powerful. It moves the conversation from vague complaints to specific, measurable dysfunction. It helps differentiate between possible causes (is it thyroid? anemia? anxiety? sleep apnea?) by providing context.
Creating a Clinically Useful Data Narrative
To make your data valuable to a healthcare provider, curation is key.
Focus on Trends, Not Every Blip: Don’t show a doctor 90 days of raw graphs. Prepare a summary. “Here’s a 2-week average of my key metrics when I feel well vs. this 2-week average during my symptomatic period.”
Correlate with Symptoms: Note specific events. “See this sharp temperature rise and SpO2 drop on this night? That’s when I woke up gasping for air. It happens 2-3 times a week.”
Highlight Key Red Flags: Point out sustained deviations in core vitals: chronic elevated RHR, persistent low HRV, frequent nocturnal desaturations.
Applications in Specialized Care
Cardiology: Long-term RHR and HRV trends are invaluable for assessing autonomic function, medication efficacy (like beta-blockers), and general cardiovascular risk.
Sleep Medicine: Providing a month of nocturnal SpO2, respiratory rate, and movement data is a powerful pre-screening tool for sleep apnea, far more indicative than a subjective Epworth sleepiness scale.
Endocrinology: For women, cyclical temperature and RHR data can provide objective evidence of ovulation and luteal phase length, aiding in discussions about hormonal health.
Mental Health: HRV data can objectively demonstrate the physiological impact of anxiety and the efficacy of therapeutic interventions (therapy, meditation, medication) on nervous system regulation.
A Note on Limitations and Partnership
It is crucial to remember: Your wearable provides data, not a diagnosis. It measures trends and prompts questions; it does not provide medical answers. Always partner with a qualified healthcare professional for interpretation and diagnosis.
The goal is a collaborative model: you manage daily optimization and provide continuous data; your provider offers diagnostic expertise and treatment plans. This synergy represents the future of personalized, preventive medicine. For answers to common questions about how this data integration works in practice, you can visit our comprehensive FAQ page.
The Future of Validation: Emerging Metrics and the Road Ahead
The technology of physiological insight is not static; it is accelerating. The metrics we discuss today—HRV, SpO2, skin temperature—are the foundational language. The next decade will see this vocabulary expand dramatically, bringing even more profound layers of validation and personalization to our wellness habits.
On the Horizon: The Next Generation of Biomarkers
Continuous Glucose Monitoring (CGM) Integration: While currently a separate device, the integration of non-invasive or minimally invasive glucose sensing into wearable rings is a fervent area of R&D. This would provide a direct, real-time window into metabolic health, showing how different foods, meals, stress, and exercise uniquely impact your blood sugar stability—the ultimate validation for nutritional choices.
Advanced Hydration & Electrolyte Status: Future sensors may use bioimpedance or optical methods to assess hydration levels at a tissue level, moving beyond simple reminders to drink water. You could see how your workouts, sauna sessions, or caffeine intake affect your cellular hydration and recovery metrics.
Cortisol Trend Detection: While real-time, continuous cortisol monitoring remains a challenge, detecting patterns indicative of chronic HPA-axis dysregulation through proxy metrics (HRV, RHR, sleep) is already happening. More direct sensing would revolutionize stress management.
Blood Pressure Trends: Research into pulse wave velocity and pulse arrival time using optical PPG sensors aims to provide estimates of blood pressure trends, not replacements for cuff-based measurements, but for tracking relative changes throughout the day and in response to lifestyle.
Advanced Sleep Staging & Disorder Detection: Algorithms will move beyond simple sleep stages to identify more subtle sleep disorders, like UARS (Upper Airway Resistance Syndrome), and provide more granular insight into sleep quality disruptions.
The AI Health Coach: From Insight to Prescription
The future lies not just in more data, but in smarter interpretation. We will see the rise of true AI health coaches that synthesize your multi-metric data, your journal entries, and even external data (like local pollen counts or your calendar stress) to provide:
Predictive Alerts: “Based on your declining HRV and elevated temperature, there’s an 85% probability you are fighting a virus. Recommend increasing sleep by 60 minutes and prioritizing hydration today.”
Hyper-Personalized Recommendations: “Your data shows you recover best from strength training when you consume 30g of protein within 45 minutes. For your 4 PM workout today, here’s a recipe you can prepare.”
Dynamic Habit Integration: The system will learn what works for you and nudge you at the right time: “You usually meditate after dropping the kids at school. It’s 8:45 AM. Want to start your session?”
The Ethical and Personal Frontier
As technology advances, so do the questions. Data privacy, security, and ownership will be paramount. The line between helpful guidance and health anxiety must be carefully managed. The ultimate goal is not to create a population obsessed with every biometric flutter, but to empower individuals with knowledge that fosters agency, compassion, and sustainable well-being. The journey of Oxyzen and similar pioneers is rooted in this ethical commitment to empowerment, a story you can discover more about here.
The road ahead is one of deeper integration, smarter analytics, and a more seamless, personalized partnership between you and your health data. The objective remains constant: to turn the art of wellness into a validated science, uniquely tailored to you.
Conclusion to Part One: The Empowered Path Forward
We began this exploration in the fog of guesswork—where wellness was a landscape of good intentions without validation. We end this portion standing on the solid ground of physiological insight. The journey from counting steps to understanding your heart’s nuanced variability, from hoping you slept well to quantifying your deep sleep architecture, represents a fundamental shift in human self-awareness.
You now hold the map to a new kind of health literacy. It is a literacy written in the language of your own body:
Your Heart Rate Variability is the poem of your nervous system’s balance.
Your sleep stages are the chapters of your nightly restoration.
Your temperature rhythm is the tide of your circadian health.
Your nocturnal oxygen is the steady rhythm of your life-sustaining breath.
These metrics are not just numbers; they are conversations. They answer back when you ask, “Is this working?” They provide the validation that turns discipline into discovery and effort into evidence.
This is not about achieving perfection in every metric every day. That is a path to frustration. It is about trends, understanding, and course correction. It’s about knowing that a low HRV day isn’t a failure; it’s a valuable signal to choose recovery. It’s about seeing a positive response to a new habit and feeling the reinforced motivation that only hard data can provide.
You are no longer a passenger in your health journey. You are the pilot, with a sophisticated dashboard built just for you. The habits you cultivate—the early night, the mindful breath, the nourishing meal, the intentional movement—now have witnesses in your very cells, and they report back with clarity.
The path forward is empowered, personalized, and proactive. It begins with listening to the story your body has been telling all along, finally with the technology to understand it. This is just the beginning. The next phase of this guide will dive even deeper into advanced optimization, community stories of transformation, and building a sustainable, data-informed life of vitality.
Start by observing. Learn your baselines. Connect one habit to one metric. Become the expert on you. Your most valuable health asset is not a device or an app; it is the wisdom they help you unlock about your one, irreplaceable body.
To see how others have begun this transformative journey, you can read their real-world experiences and testimonials here.