How Sleep Scores Are Calculated (The Algorithm Revealed)
Sleep scores are calculated by algorithms weighing factors like duration, depth, timing, interruptions, and sometimes heart rate/HRV.
The Magic Number: How Your Sleep Score Unlocks a Healthier You
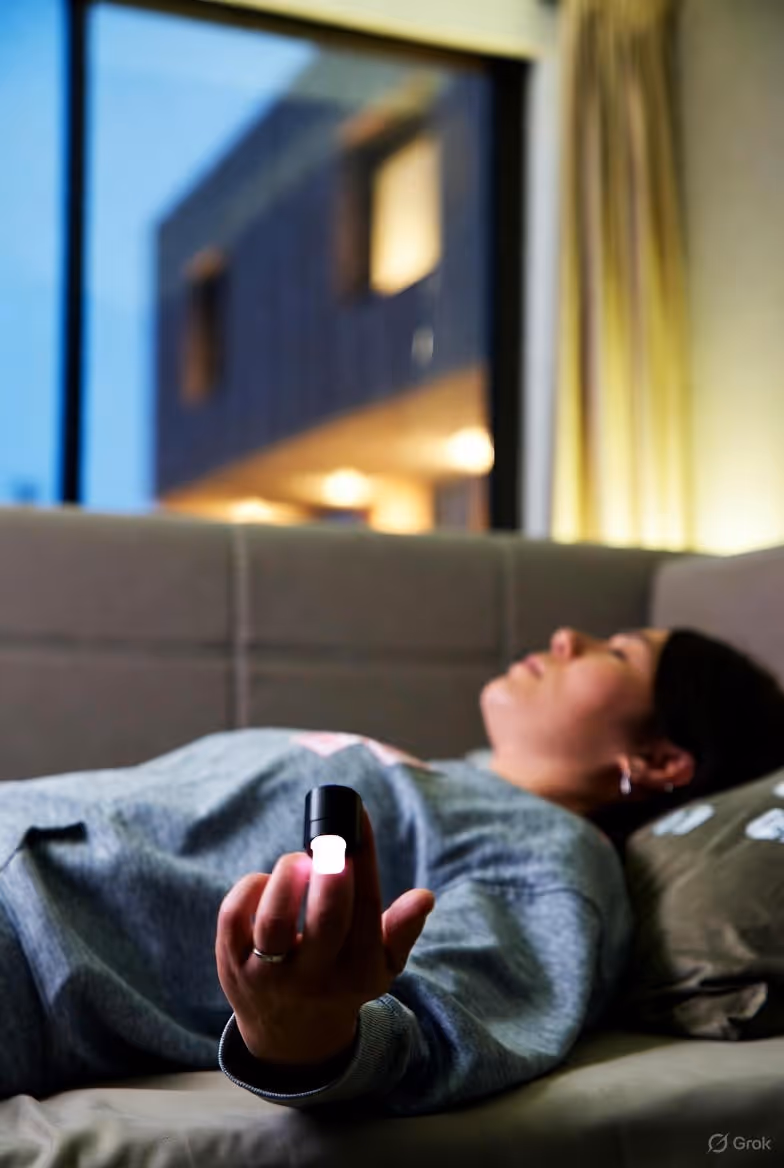
You wake up, reach for your phone, and there it is: a single, seemingly all-knowing number. Your sleep score. An 82. A 76. A pristine 92. It feels definitive, a verdict on your night’s journey into oblivion. For millions using smart rings, fitness trackers, and health apps, this score has become the morning’s first metric of self—a digital pulse on our restorative health. But where does this number truly come from? Is it a simple tally of hours in bed, or is there a sophisticated algorithm working behind the scenes, translating the cryptic language of your sleep into a digestible digit?
The truth is far more fascinating. Your sleep score is not a mere opinion; it’s the output of a complex, multi-layered analysis that rivals modern medical diagnostics. It’s a story told in data—a narrative of your heart’s rhythms, your body’s whispers of movement, and the silent physiological battles fought between stress and recovery. For brands like Oxyzen, which harness this technology in sleek, unobtrusive smart rings, the mission is to move beyond simple tracking into the realm of genuine understanding and actionable insight.
This journey into the algorithm isn't just about satisfying curiosity. It’s about empowerment. By demystifying how your sleep score is calculated, you transform from a passive recipient of data into an active participant in your wellness. You learn to interpret the nuances, question the numbers, and make tangible changes that elevate not just your sleep, but your energy, focus, and long-term health. Consider this your backstage pass. We’re pulling back the curtain on the sensors, the statistical models, and the sleep science to reveal exactly how your device quantifies your slumber. From the raw biometric signals captured by a device on your finger to the final score on your screen, we will explore every variable, every weighting, and every secret behind the most important number you’ll see today.
Decoding the Digital Sleuth: An Introduction to Sleep Tracking Technology
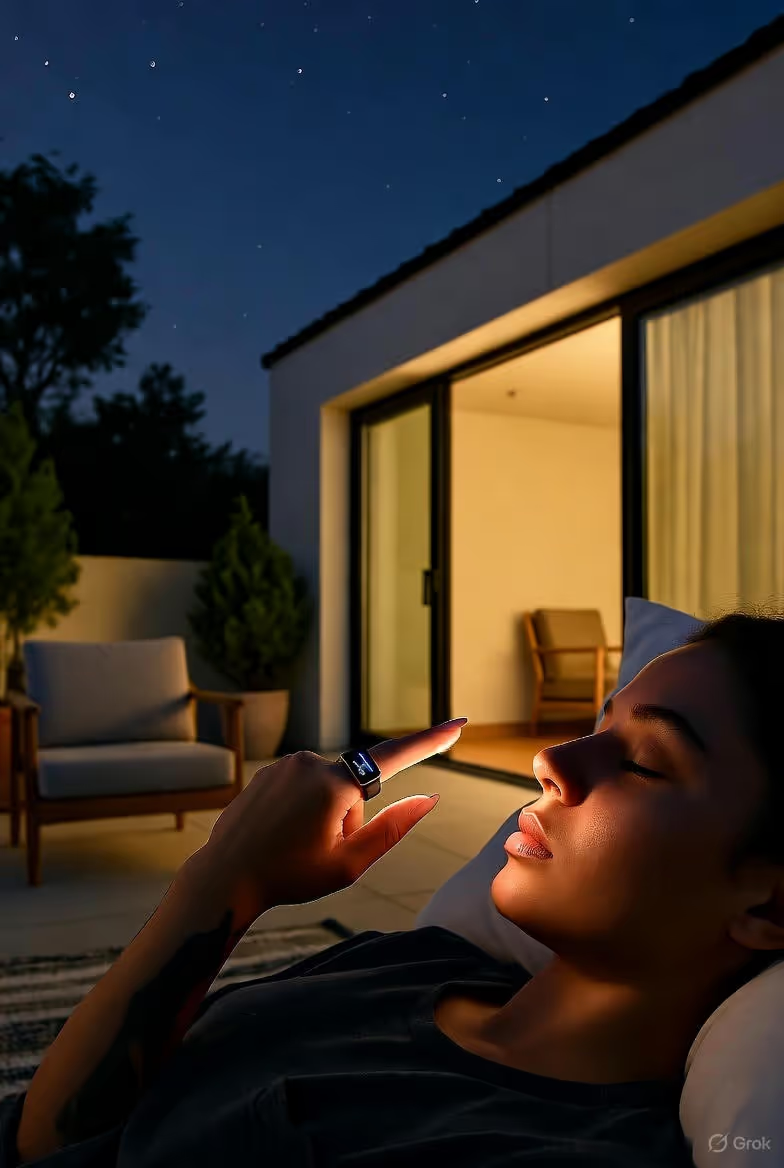
Before we can understand the score, we must understand the scribe. The modern sleep tracker, especially the advanced form found in smart rings, is a miniaturized biomedical laboratory. Unlike the polysomnography (PSG) machines used in sleep labs—which involve a web of wires and electrodes—consumer devices must perform a technological ballet of inference and precision using a limited set of sensors. The genius lies not in replicating the clinical gold standard, but in approximating its conclusions through sophisticated proxy measurements.
At the heart of most advanced wearables, including the Oxyzen ring, are three primary sensors working in concert:
1. Photoplethysmography (PPG): This is the core technology for measuring cardiovascular activity. A tiny green LED light shines into the capillaries in your finger. As your heart beats, blood volume in these vessels changes slightly, which alters how much light is absorbed. The sensor detects these minuscule fluctuations, creating a waveform called a photoplethysmogram. This raw signal is the Rosetta Stone for decoding your Heart Rate (HR) and, more importantly for sleep, your Heart Rate Variability (HRV)—the nuanced time variation between beats that is a profound indicator of your nervous system state.
2. A 3D Accelerometer: This micro-electromechanical system measures movement (acceleration) in three dimensions. It’s what counts your steps, but for sleep, its role is far more subtle. It detects gross body movements (tossing, turning) and, with high sensitivity, the micromovements of your limbs that correspond to different sleep stages. Crucially, it identifies periods of absolute stillness, which are key markers for deep sleep.
3. A Temperature Sensor: Perhaps the most underrated yet revolutionary sensor in modern sleep tech. Your distal body temperature (in your fingers and toes) follows a distinct circadian rhythm. Core body heat is dissipated through the extremities to facilitate the drop in core temperature necessary for sleep onset and maintenance. By continuously monitoring skin temperature, the device can pinpoint your circadian rhythm phase, detect disturbances, and even predict potential illness through subtle fever signatures.
The magic isn’t in the individual sensors, but in their sensor fusion. The algorithm doesn’t look at heart rate or movement or temperature in isolation. It layers them, like a detective cross-referencing alibis. For example, a period of low movement plus a lowered heart rate plus a stable, low temperature is a strong signature of deep sleep. A spike in heart rate coinciding with a movement and a slight temperature rise might indicate a brief awakening. This multi-pronged approach dramatically increases accuracy compared to early trackers that relied on movement alone.
This technological symphony happens on your finger—a location chosen for good reason. The finger provides a strong PPG signal due to good capillary density, and it’s less prone to motion artifacts during sleep compared to a wrist (which can tuck under your head or pillow). The result is a rich, continuous stream of biometric data, silently collected throughout the night, waiting to be translated. For a deeper dive into how this technology is seamlessly integrated into daily life, you can explore our blog for more on wearable tech innovation.
The Four Pillars of Sleep: Deconstructing the Score’s Foundation
Your final sleep score is not a single measurement; it’s a weighted composite of several critical sleep dimensions. Think of it as a report card with four main subjects, each contributing a percentage to your final grade. Different platforms may use slightly different terminology, but the core pillars are remarkably consistent across the industry: Duration, Quality, Timing, and Restoration. Understanding what each pillar represents is the first step to mastering your sleep.
1. Sleep Duration: The Non-Negotiable Baseline This is the most straightforward pillar: the total time you spend asleep. But the algorithm isn’t just counting minutes from bedtime to alarm. It uses movement, heart rate, and sometimes breathing patterns to distinguish time in bed from actual sleep time. The National Sleep Foundation and other health bodies provide age-based recommendations (e.g., 7-9 hours for adults), which form the benchmark. Your score in this category typically follows a curve: too little sleep yields a low score, meeting your personal target range yields a high score, and excessively long sleep may paradoxically lower the score, as it can be associated with fragmentation or underlying issues.
2. Sleep Quality: The Architecture of Your Night If duration is the quantity, quality is the architecture. This pillar assesses the structure of your sleep cycles. Human sleep progresses in roughly 90-minute cycles through four stages: Light Sleep (N1 & N2), Deep Sleep (N3, or Slow-Wave Sleep), and REM (Rapid Eye Movement) sleep. Each stage serves a vital purpose:
Deep Sleep: The physically restorative phase. Tissue repair, immune function, and growth hormone release occur here.
REM Sleep: The mentally restorative phase. Essential for memory consolidation, learning, and emotional processing.
The algorithm uses HRV, movement, and heart rate patterns to estimate your time in each stage. A "high quality" score requires a healthy balance—sufficient deep sleep early in the night and adequate REM sleep, which dominates the later cycles. This pillar also heavily penalizes fragmentation: frequent awakenings (arousals) or long periods of restless tossing and turning that disrupt the natural cycle progression.
3. Sleep Timing: Aligning with Your Circadian Rhythm This is the "when" of sleep. Your body has a master clock—the suprachiasmatic nucleus—that thrives on consistency. The timing pillar evaluates two factors:
Consistency: Do you go to bed and wake up at roughly the same time every day, even on weekends? Erratic schedules confuse your internal clock, a phenomenon known as "social jetlag."
Alignment: Does your sleep window align with your body’s natural circadian dip in alertness? Falling asleep during your biological night (typically late evening to early morning) yields a higher score than sleeping during the day.
The temperature sensor is particularly crucial here, as your distal temperature rhythm is a direct output of your circadian clock. By tracking its daily pattern, the device learns your personal rhythm and scores you on how well your behavior aligns with it.
4. Sleep Restoration: The Physiological Payoff This is the most advanced and insightful pillar. It moves beyond "what happened" to ask, "How effective was it?" Restoration measures how well your body and nervous system recovered during sleep. The primary metrics here are:
Nighttime Heart Rate (HR): Your heart rate should dip significantly below your daytime resting average. A high or elevated nighttime HR suggests your body is under stress (physical, psychological, or immunological) and isn’t fully switching into recovery mode.
Heart Rate Variability (HRV): This is the crown jewel of restoration metrics. HRV represents the balance between your sympathetic ("fight or flight") and parasympathetic ("rest and digest") nervous systems. During truly restorative sleep, your parasympathetic system should dominate, leading to a higher, more variable HRV. A low nighttime HRV indicates your body is stuck in a state of stress or exhaustion, unable to achieve deep recovery.
The restoration score synthesizes these signals to tell you not just that you slept, but how you slept from your nervous system’s perspective. It’s the difference between being unconscious and being genuinely restored. To see how real users interpret their restoration data, you can read genuine experiences in our customer testimonials.
From Biometrics to Stages: How Algorithms Detect REM, Deep, and Light Sleep
This is where the algorithm performs its most impressive act of translation. It must take a stream of noisy, real-world physiological data and map it onto the clinically-defined stages of sleep. While consumer devices cannot diagnose sleep disorders like a PSG can, their staging algorithms have become remarkably sophisticated through machine learning trained on massive datasets of combined PSG and wearable data.
Here’s a simplified breakdown of how the algorithm interprets signals for each stage:
Wakefulness:
Signatures: High and variable heart rate, high movement (gross or micromovements), low HRV (due to conscious stress or activity), and a temperature signal that isn’t following the sleep-specific cooling trend.
Algorithm Logic: The accelerometer is the first line of defense. Sustained movement = awake. But the algorithm is smart enough to know you can lie still and be awake. So, it cross-references: still body but high/erratic heart rate? Likely a wakeful period or very light sleep.
Light Sleep (N1 & N2):
Signatures: The transition zone. Heart rate begins to descend and stabilize. Movement becomes infrequent. HRV starts to increase as the parasympathetic system engages. Body temperature begins its deliberate decline.
Algorithm Logic: This is often the default stage—the algorithm assigns light sleep when conditions for wake, deep, or REM are not clearly met. It’s characterized by the absence of strong defining signals from other stages, combined with a clear departure from wakefulness.
Deep Sleep (Slow-Wave Sleep):
Signatures: This stage has the clearest physiological fingerprints.
Heart Rate: Reaches its lowest point of the night, often 20-30% below resting day rate.
HRV: Shows a characteristic pattern, but can sometimes be lower than in REM due to the dominance of slow, regular bodily rhythms.
Movement: Minimal to none. The body is paralyzed by sleep physiology to prevent acting out dreams. The accelerometer shows prolonged stillness.
Breathing: Becomes very slow, deep, and regular.
Algorithm Logic: The algorithm looks for synchronized periods of low heart rate + high stillness + regular breathing patterns. These typically occur in the first half of the night. The confidence in detecting deep sleep is high because the signals are so strong and distinct.
REM Sleep:
Signatures: A paradox—the brain is active, but the body is inert.
Heart Rate & HRV: Becomes variable and can spike upward, similar to awake states. This is due to brain activity and dreaming. HRV often shows complex patterns.
Movement: Gross body movement is absent (muscle atonia), but the accelerometer may detect tiny, rapid twitches in the fingers (phasic REM bursts).
Breathing: Becomes irregular, fast, and shallow.
Eyes: Though wearables can’t detect eye movement, the characteristic cardiorespiratory patterns are strong proxies.
Algorithm Logic: The key identifier is a wake-like heart rate pattern in the absence of body movement. The algorithm looks for this dissonance: "The heart says 'active,' but the body says 'paralyzed.'" This signature becomes more pronounced and prolonged in the sleep cycles of the second half of the night.
The algorithm doesn’t stage each minute in isolation. It uses a probabilistic model that considers the sequence. For example, you typically enter light sleep before deep sleep, and REM sleep usually follows a deep sleep period. The algorithm uses these rules of sleep architecture to smooth the data and correct improbable sequences (like jumping from REM directly to deep sleep). This continuous analysis, which you can learn more about in our detailed FAQ, creates the hypnogram—the visual graph of your night’s journey that is the primary input for the Quality pillar of your score.
The Heart of Recovery: Demystifying Heart Rate Variability (HRV) and Nighttime Heart Rate
If sleep quality is the architecture, then Heart Rate Variability (HRV) and nighttime heart rate are the building inspectors, assessing the integrity of the structure. These two metrics form the empirical core of the Restoration pillar and offer a direct, unfiltered window into your autonomic nervous system (ANS)—the autopilot controlling your stress and recovery.
Nighttime Heart Rate: The Baseline of Calm Your resting heart rate (RHR) during the day is a decent health metric, but your nighttime heart rate is a purer signal. When you remove the variables of posture, activity, and mental stress, what remains is your body’s baseline metabolic and recovery rate.
What It Tells You: A successfully descending heart rate at night is a sign of strong parasympathetic activation. Your body feels safe enough to dial down energy consumption and focus on repair. A persistently elevated nighttime heart rate is a red flag. It can indicate acute stressors (like a hard workout too close to bedtime, alcohol consumption, or psychological anxiety), chronic stress, or the early stages of illness as your immune system revs up.
In the Algorithm: The score doesn’t just look at the average. It looks at the trend. A healthy pattern shows a steep drop after sleep onset, a low, stable plateau through the night, and a gentle rise toward morning. The algorithm compares your nightly nadir (lowest point) and trend to your personal baseline. Consistently hitting new lows is a sign of improving fitness and recovery; consistently running high triggers a lower restoration score.
Heart Rate Variability (HRV): The Symphony of Your Nervous System HRV is often misunderstood. It is not about having an irregular heartbeat (arrhythmia). It is the beat-to-beat variation in time intervals. If your heart beats like a monotonous metronome (low HRV), it suggests your sympathetic nervous system is dominant—you’re in a state of "high alert." If your heart beats with a complex, adaptable rhythm (high HRV), it indicates a strong, responsive parasympathetic tone and greater resilience. Think of it as the difference between a rigid, stiff system and a flexible, adaptable one.
The Science of Measurement: Devices like smart rings typically measure HRV using a metric called rMSSD (the root mean square of successive differences), which is particularly good at capturing short-term, parasympathetic-driven variance. This is calculated from the precise timings between heartbeats (RR intervals) derived from the PPG signal.
What It Tells You: Your nighttime HRV is your best single-number metric for recovery status. A high HRV score suggests you are well-rested, not overly stressed, and physiologically prepared for challenge. A low or dropping HRV suggests cumulative fatigue, overtraining, emotional stress, or illness. It’s your body’s way of whispering, "I need a break."
In the Algorithm: The algorithm calculates your average nighttime HRV and, more importantly, its trend. It establishes a personal baseline over weeks of data. The restoration score heavily weights how your current night’s HRV compares to this baseline. A night with HRV significantly above your baseline contributes to a high score, indicating superb recovery. A sharp drop below baseline will tank the restoration score, serving as an early warning system long before you feel overtrained or sick.
Together, these metrics tell a story no other sleep parameter can. They answer the critical question: Was my sleep restorative? You can have 8 hours of "sleep" with terrible architecture, but if your HRV is high and heart rate low, your body still found a way to recover. Conversely, you can have a perfect-looking hypnogram but if your HRV is suppressed, it indicates an underlying stressor preventing true physiological rest. Understanding this interplay is key to moving from sleep tracking to sleep mastery, a philosophy central to Oxyzen's mission for holistic wellness.
The Chronobiology Factor: How Body Temperature and Circadian Rhythms Shape Your Score
While movement and heart tell the story of what happened during sleep, body temperature writes the prologue and the epilogue. It sets the stage for sleep and defines its timing. The inclusion of continuous temperature sensing in devices like advanced smart rings represents a quantum leap in personal circadian science, directly feeding into the Timing pillar of your sleep score.
The Circadian Thermostat: A Delicate Dance Your core body temperature follows a 24-hour rhythm, orchestrated by your master clock in the brain. To initiate sleep, your core temperature must drop by about 1-2 degrees Fahrenheit. This is achieved through a clever process: your body increases blood flow to the extremities (hands and feet), which act as radiators, dissipating heat. This is why you might have cold hands or feet when you’re tired—it’s a biological signal, not a coincidence.
The Finger as a Sensor: The smart ring, positioned on your finger, is ideally located to measure this distal skin temperature flux. As you prepare for sleep, your finger temperature rises (as warm blood is shunted to it) and then stabilizes. Throughout the night, it maintains a specific pattern linked to sleep stages.
What Temperature Data Tells the Algorithm:
Sleep Onset Prediction & Detection: A sustained rise in distal temperature, especially when coupled with a dropping heart rate, is a powerful signal that your body is initiating its sleep sequence. The algorithm uses this to more accurately pinpoint the moment you actually fell asleep, not just when you got in bed.
Circadian Rhythm Phase Assessment: By tracking your temperature minimum (which usually occurs in the second half of the night) and its daily pattern over weeks, the algorithm can map your personal circadian phase. Are you an early bird with an early temperature drop? A night owl with a delayed curve? This personal rhythm becomes your benchmark. Your Sleep Timing score is then based on how well your actual sleep window aligns with this unique biological rhythm. Sleeping against your rhythm (e.g., an early bird forced to work night shifts) results in a lower score, quantifying your biological discord.
Sleep Quality Insights: Temperature disturbances are linked to sleep fragmentation. A sudden drop or erratic temperature during the night can correlate with awakenings or shifts into lighter sleep. The algorithm cross-references these temp blips with movement and heart rate data to confirm disturbances.
Unique Health Insights: This is where it gets groundbreaking. A sustained elevation in your baseline nighttime temperature, even by a few tenths of a degree, is one of the earliest and most reliable signs of onsetting illness, inflammation, or immune activation. It can appear 24-48 hours before you feel symptoms. For women, the temperature data, when analyzed over a month, can vividly illustrate the circadian rhythm shifts across the menstrual cycle, providing insights into energy, recovery needs, and sleep patterns linked to hormonal phases.
In the scoring algorithm, consistent temperature rhythm is a silent but powerful contributor. It validates the other signals. A night with good duration, structure, and restoration that is also perfectly aligned with your personal temperature rhythm will receive the highest possible Timing score. It’s the algorithm’s way of confirming you slept in harmony with your deepest biological programming. This commitment to deep biometric insight is part of the innovative story behind technologies like Oxyzen.
Movement & Restlessness: The Accelerometer’s Role in Measuring Sleep Fragmentation
The accelerometer is the veteran of sleep tracking. While early devices used it crudely (no movement = asleep, movement = awake), its role in modern algorithms is more nuanced and forensic. Today, it is the primary tool for quantifying sleep fragmentation—the enemy of consolidated, restorative sleep. Fragmentation, not just short duration, is what often leaves people feeling unrefreshed.
From Gross Movement to Micromovements: Modern 3D accelerometers are incredibly sensitive. They don’t just detect you turning over; they can sense the subtle limb jerks of a hypnic jerk at sleep onset, the repetitive leg movements of periodic limb movement disorder, and the tiny finger twitches of REM sleep.
Gross Body Movements: These are clear events—shifting position, tossing, turning. The algorithm tags these and assesses their frequency and duration. A few per hour is normal; dozens suggest restless sleep.
Micromovements/Brief Arousals: More importantly, the accelerometer detects very brief bursts of movement that often correspond to cortical arousals—momentary shifts to a lighter stage of sleep or near-waking, often without you being consciously aware. These are critical detriments to sleep continuity.
How Fragmentation Ruins the Score (The Quality Pillar):
Sleep is not a light switch; it’s a progressive dive into deeper stages. To achieve deep sleep and REM, you need sustained, uninterrupted periods. Each time you have a gross movement or a micro-arousal, you potentially reset the clock on that progression.
You may be ascending out of deep sleep back into light sleep.
Your heart rate may spike.
The natural sleep cycle is interrupted.
The algorithm quantifies this in several ways:
Arousal Index: It estimates the number of arousal events per hour of sleep. A low index is good; a high index severely penalizes the Sleep Quality score.
Sleep Efficiency: This is calculated as (Total Sleep Time) / (Total Time in Bed) * 100. Fragmentation increases time spent awake in bed, driving efficiency down. While efficiency is a separate metric, it is directly caused by fragmentation and is a key input.
Restlessness Percentage: Some platforms provide a metric showing the percentage of your sleep time spent "restless" or moving. This is a direct output of the accelerometer data.
The Cross-Validation Imperative: The accelerometer is powerful, but it can be fooled. Lying perfectly still while awake (trying to fall asleep) could be mis-scored as sleep. This is where sensor fusion is vital. The algorithm asks:
"The accelerometer says ‘still,’ but is the heart rate still high and variable? Yes? Then likely still awake."
"There was a small movement. Was it accompanied by a simultaneous heart rate spike? Yes? Then confirm as an arousal."
Furthermore, the pattern of movement matters. The clustering of movements can indicate external disturbances (noise, partner movement, poor bedding) or internal issues (sleep apnea events often end with a gasp and a movement). By analyzing movement in the context of other signals, the algorithm can provide more nuanced feedback than "you moved 12 times."
In essence, the accelerometer’s job is to police the continuity of your sleep. It ensures that the beautiful architecture built by your heart rate and temperature data isn’t constantly being demolished by interruptions. A high sleep quality score is a testament to a quiet night, not just in your bedroom, but in your nervous system—a story you can explore further through community experiences and reviews.
The Weighting Game: How Different Factors Combine into a Single Score
Now we arrive at the algorithm’s final act: synthesis. It has gathered terabytes of proxy data, staged your sleep, calculated metrics for duration, quality, timing, and restoration. But how does it weigh a bad night of deep sleep against a great HRV? How much does a late bedtime penalize you compared to a high resting heart rate? This is the proprietary "secret sauce" of each platform, but the general principles follow established sleep science priorities.
While exact weightings are trade secrets, we can infer a logical hierarchy based on scientific impact on next-day functioning and long-term health:
Tier 1: The Non-Negotiables (Highest Weight)
Sleep Duration & Continuity: You simply cannot be healthy without sufficient, consolidated sleep. Most algorithms place a very high initial weight on hitting your personal duration target (e.g., 7+ hours for most adults) and maintaining low fragmentation. If these are severely lacking, the score has a low ceiling, regardless of other factors. Think of it as the foundation of a house—if it’s cracked, the rest of the structure is compromised.
Tier 2: The Quality of Restoration (Very High Weight)
Sleep Architecture (Deep/REM Balance) & Restoration Metrics (HRV/Nighttime HR): Once sufficient duration is established, the question becomes, "What was the nature of that sleep?" A night rich in deep and REM sleep is profoundly more restorative than an equal length of light, fragmented sleep. Similarly, physiological restoration (HRV, low HR) is the ultimate proof of sleep’s effectiveness. These factors typically carry the next highest weights, directly determining if a good score becomes a great one.
Tier 3: The Behavioral Alignment (Significant Weight)
Sleep Timing & Consistency: This is about sleep hygiene and circadian alignment. A consistent sleep schedule that matches your internal clock optimizes all the above factors. Therefore, it’s weighted significantly. Erratic timing or sleeping against your rhythm may not tank your score if you still get 8 hours of great sleep, but it will prevent you from reaching the highest echelons (e.g., scores above 90). It’s the fine-tuning of the sleep engine.
Tier 4: The Ancillary Indicators (Contextual Weight)
Time to Fall Asleep (Sleep Latency), Time Awake After Sleep Onset (WASO), and Environmental Factors: These are often components of the larger pillars. Long latency or high WASO reduces Sleep Efficiency, hurting the Quality score. Some algorithms may incorporate other data (like audio snippets for snoring or ambient noise) to adjust scores contextually, but these are usually modifiers rather than primary drivers.
The Mathematical Model: The final score is likely the result of a multiplicative or weighted additive model. It’s not simply (Duration Score + Quality Score + Timing Score) / 3.
A poor score in a high-tier category (e.g., 4 hours of sleep) might apply a multiplier that caps the total score.
The model may have non-linear scoring curves. For example, the difference between 6.5 and 7 hours of sleep might yield a bigger point jump than the difference between 8 and 8.5 hours, reflecting the diminishing returns and potential negatives of excessive sleep.
Personalized Baselines: This is critical. The algorithm doesn’t score you against a rigid, universal standard forever. Over the first few weeks, it learns you. It establishes your normal HRV range, your typical deep sleep percentage, your natural bedtime window. Your nightly score is then a measure of deviation from your own baseline. This is why a night with an 85 might be excellent for one person but mediocre for another who consistently scores in the 90s.
Understanding this weighting is empowering. It tells you what to prioritize. If your score is low, you can diagnose the cause: Is it the red "Duration" segment, or the orange "Restoration" segment? This targeted insight transforms the score from a judgment into a diagnostic tool, guiding you toward specific, high-impact changes. For a comprehensive look at how these insights are delivered and acted upon, our blog offers numerous guides and case studies.
Beyond the Night: How Daytime Behavior and Lifestyle Feed the Algorithm
Your sleep score is not an island. The algorithm’s intelligence extends beyond the night, understanding that the quality of your waking hours fundamentally sculpts the architecture of your sleep. This is where modern sleep tracking transcends mere monitoring and enters the realm of holistic system analysis. The device doesn't just record what happens between 10 PM and 6 AM; it contextualizes it within the 24-hour cycle of your life. Your score, therefore, becomes a reflection of your daily choices.
The Feedback Loop of Strain and Recovery: The core principle is homeostatic sleep pressure and circadian rhythm—the two-process model of sleep regulation. Everything you do influences these processes.
Physical Activity: Exercise is a primary driver. It increases sleep pressure (the body’s need for recovery), which should promote deeper, more consolidated sleep. The algorithm often notes the timing and intensity of your workouts. A vigorous workout too close to bedtime, however, can elevate core temperature and sympathetic nervous system activity, potentially delaying sleep onset and lowering the initial restoration score. Consistent daytime activity, on the other hand, is strongly correlated with higher sleep quality scores.
Daytime Heart Rate & HRV: Your waking physiology sets the baseline. A day filled with stress, evidenced by a consistently elevated daytime heart rate and suppressed HRV, tells the algorithm your nervous system is on high alert. This makes it harder to achieve the profound parasympathetic shift needed for restorative sleep. The algorithm may anticipate a lower restoration score or, upon seeing a poor one, point back to daytime stress as a likely culprit.
Nutrition & Substance Timing: While most wearables don’t directly track your meals, they track the physiological consequences. A large, heavy meal, alcohol, or caffeine close to bedtime leaves clear fingerprints:
Alcohol: It’s a sedative, not a sleep aid. It may help you fall asleep faster, but it reliably suppresses REM sleep in the first half of the night and causes rebound arousal and fragmentation in the second half, leading to a depressed sleep quality score and often a lower HRV.
Caffeine: Its long half-life can delay circadian phase, increase sleep latency, and lighten sleep stages, even if you feel you "slept through the night."
Late Eating: Can elevate metabolism and core temperature during the early sleep phase, interfering with the natural cooling process.
Contextual Scoring and "Readiness" Metrics: Advanced platforms don’t stop at a sleep score; they synthesize it with daytime data to produce a Daily Readiness or Recovery Score. This is the algorithm’s recommendation for how much stress you should take on today.
The Logic: A night with a high sleep score and a positive daytime activity balance yields a high readiness score, suggesting you’re primed for intense training or high cognitive load.
The Warning: A low sleep score, especially one driven by poor restoration (low HRV, high night HR), combined with significant recent training load, will generate a low readiness score. The algorithm is essentially saying, "Your body hasn’t recovered from yesterday’s stress. Prioritize rest today or risk overtraining, injury, or burnout."
This feedback loop creates a powerful narrative. You can see the direct line from a stressful workday (high daytime HR) to a restless night (high fragmentation) to a low readiness score the next morning. It moves sleep from being a separate health category to the central pillar of a connected biofeedback system. By understanding these connections, you learn to prime your day for better sleep and respect your sleep data when planning your day—a core tenet of the integrated approach you can learn more about through Oxyzen’s resources.
The Personalization Engine: How Your Baseline Becomes Your Benchmark
The most significant evolution in sleep scoring is the move from a one-size-fits-all model to a deeply personalized algorithm. Your score is not—and should not be—compared to your spouse’s, your friend’s, or a generic "optimal" target. It is a measure of you, against yourself, over time. This personalization is what makes the data meaningful and actionable.
Establishing the Baseline: The Learning Phase During the first two to four weeks of consistent wear, the device is in a dedicated learning mode. It’s not just collecting data; it’s building a statistical model of you.
It calculates your personal averages: What is your typical deep sleep percentage? What is your normal range for nighttime HRV (which can vary wildly between individuals based on age, fitness, and genetics)? What time does your body temperature naturally begin to drop?
It identifies your patterns: Are you naturally a 6.5-hour sleeper who feels great, or do you consistently need 8.5? Does your HRV dip predictably during your menstrual luteal phase? Do you always have more restless sleep after evening social engagements?
Dynamic Adjustments and Trending Once your baseline is established, the algorithm shifts to monitoring deviations from this norm. This is where true insight emerges.
The "Normal" Range: Your scores are interpreted within your personal confidence intervals. A HRV of 45 might be disastrously low for one person but a normal high for another. The algorithm knows this.
Trend Analysis: The score is a snapshot, but the trend is the story. The platform doesn’t just show you last night’s 75; it shows you that your 7-day average has dropped from 82 to 75. This trend analysis is crucial. It can alert you to creeping sleep debt, the onset of overtraining, or a persistent stressor before you consciously notice its effects.
Life Event Context: Sophisticated systems allow you to add tags or notes (e.g., "intense workout," "drank alcohol," "stressful work day," "started a meditation practice"). Over time, the algorithm can learn to correlate these subjective inputs with your objective data, reinforcing the cause-and-effect relationships in your personal life.
Adaptive Goals and Intelligent Nudges Personalization culminates in adaptive guidance. Instead of telling everyone to "get 8 hours," the platform might learn that you specifically need to focus on a consistent bedtime because your data shows timing inconsistency is your primary score limiter. For another user, the nudges might center on winding down earlier to improve sleep latency.
The score becomes a conversation. A low restoration score might prompt the app to ask: "Had a tough workout yesterday? Your recovery is low. Consider a lighter day today."
It celebrates your victories. Improving your personal sleep consistency by 15 minutes a night is a bigger win than hitting an arbitrary 8-hour target.
This personal engine ensures the technology serves you, not the other way around. It acknowledges the beautiful complexity of human biology, where the only valid comparison is who you were yesterday. This philosophy of individualized health is central to the vision and values behind personalized wellness tech.
Debunking the Myths: What Your Sleep Score Can and Cannot Tell You
With great data comes great responsibility—both for the algorithm and for the user. Misinterpretation of sleep scores is common and can lead to unnecessary anxiety, a condition sometimes called "orthosomnia" (an unhealthy preoccupation with perfect sleep data). Let’s establish clear boundaries around the capabilities of consumer sleep tracking.
What Your Sleep Score CAN Do (Its Superpowers):
Track Relative Changes and Trends with High Precision: It is exceptionally good at showing you change. Did your sleep become more fragmented this week compared to last? Did your HRV rise after you started a new meditation routine? The direction and magnitude of these changes are highly reliable, even if the absolute stage labels have a margin of error.
Provide Objective Feedback on Lifestyle Interventions: It answers the "what if" questions. What if I stop drinking coffee after 2 PM? What if I start a 10 PM digital curfew? The score gives you immediate, objective feedback, turning sleep hygiene from a vague concept into a measurable experiment.
Serve as an Early-Warning System for Health and Recovery: A sustained, unexplained dip in your restoration scores (HRV down, nighttime HR up) is one of the earliest signs of physical strain, impending illness, or chronic stress. It’s a canary in the coal mine for your nervous system.
Increase Self-Awareness and Accountability: It makes the invisible visible. Many people are shocked to see how their perceived "good night’s sleep" was riddled with awakenings or how their alcohol nightcap decimates their deep sleep. This awareness is the first, most critical step toward change.
Validate Subjective Feelings: That groggy, unrested feeling is now paired with a 68 Sleep Score. The data validates your experience, empowering you to take it seriously rather than just "pushing through."
What Your Sleep Score CANNOT Do (Its Limitations):
Diagnose Sleep or Medical Disorders: It cannot diagnose sleep apnea, insomnia, narcolepsy, or any other clinical condition. While it may suggest patterns consistent with a disorder (e.g., frequent awakenings and oxygen desaturation spikes could indicate apnea), it is not a medical device. A sleep score is not a substitute for a professional evaluation. If you have persistent, severe concerns, see a doctor.
Provide Clinically Accurate Sleep Staging: The hypnogram from your ring is an estimate based on proxy signals. It will never be as accurate as a PSG’s EEG, which measures brain waves directly. It can generally distinguish "awake," "light," "deep," and "REM" with good but not perfect accuracy. Discrepancies of 10-20% in stage timing compared to PSG are common in validation studies, though the technology improves yearly.
Be Perfectly Accurate Every Single Night: External factors can confuse it. A very loose ring can produce noisy PPG data. An illness that causes fever and tachycardia can make sleep staging erratic. The algorithm is robust, but not infallible.
Define "Perfect Sleep" for You: A score of 100 is not a realistic or necessary goal. The algorithm’s perfect score is a mathematical ideal based on its weighting. Your personal "optimal" is the score range where you consistently feel alert, energized, and healthy. For some, that’s an 85; for others, it’s a 92. How you feel is the ultimate metric. The score is a guide, not a gospel.
Ignore the Placebo/Nocebo Effect: If you see a score of 65, you might psychologically feel worse that day, potentially creating a self-fulfilling prophecy. It’s important to use the data as a neutral observer, not as a deterministic verdict on your day.
The key is intelligent interpretation. Use the score as a compass, not a map. It shows direction, not destiny. For common questions on how to best use and interpret this technology, our comprehensive FAQ is an invaluable resource.
From Data to Action: How to Use Your Sleep Score to Actually Improve Your Sleep
This is the entire purpose of the exercise. The score, the algorithm, the beautiful graphs—they are all meaningless unless they inspire positive change. Here is a strategic framework for transforming your sleep data into a concrete action plan for better rest.
Step 1: Diagnose the Primary Limiter Don’t just look at the total number. Drill into the sub-scores (Duration, Quality, Timing, Restoration). Which one is the lowest? Which one is most often low? This is your primary leverage point.
Low Duration? Your action is behavioral: protect your sleep window. Schedule it like an important meeting. Use incremental adjustments—aim for 15 minutes earlier to bed, not a full hour.
Low Quality (Fragmentation/Architecture)? Investigate your sleep environment and pre-sleep routine.
Environment: Is your bedroom cool (65-68°F), dark (blackout curtains), and quiet (white noise machine)? Is your mattress/pillow supportive?
Routine: Implement a consistent 60-90 minute "wind-down" ritual. Dim lights, disconnect from screens (blue light blocks melatonin), and engage in calming activities (reading, light stretching, meditation).
Low Timing? Focus on circadian hygiene. Get bright, natural light exposure first thing in the morning to reset your clock. Be militant about a consistent wake-up time, even on weekends (within an hour). Avoid bright light, especially blue light, after sunset.
Low Restoration (HRV/Night HR)? This points to systemic stress management.
Daytime: Incorporate stress-reducing practices like mindfulness, breathwork, or walking in nature.
Evening: Avoid intense exercise, heavy meals, and emotional discussions too close to bed. Consider techniques like a warm bath (the rise and subsequent fall in body temperature can promote sleepiness) or gratitude journaling to calm the mind.
Step 2: Run Single-Variable Experiments Change one thing at a time for at least a week while holding other factors as constant as possible. This allows you to see the clear impact of that variable on your score.
Experiment 1: For one week, implement a strict 10 PM digital curfew. Observe changes in Sleep Latency and Quality score.
Experiment 2: The next week, add a 10-minute evening meditation. Observe changes in your Restoration (HRV) score.
Experiment 3: The following week, try eliminating alcohol on weeknights. Observe the change in your Deep Sleep and Restoration scores.
Step 3: Leverage the Trend, Not the Daily Fluctuation Don’t get discouraged by a single bad score. Life happens. Look at your 7-day and 30-day averages. Is the trend line moving in the right direction? That’s success. A rising trend in your average Restoration score is a more powerful indicator of improved health than any single night’s 95.
Step 4: Integrate with Readiness Metrics If your platform offers a Daily Readiness score, let it guide your activity. On a low-readiness day, swap the high-intensity interval training for yoga or a walk. This is called sleep-informed training and is a hallmark of professional athletes. It prevents digging a deeper recovery hole and allows your body to fully absorb the benefits of your hard work.
Step 5: Close the Loop with Subjective Feelings Keep a simple journal note: "Score: 82. Felt: Great energy all morning, slight dip at 3 PM." Or "Score: 88. Felt: Surprisingly groggy." Over time, you’ll calibrate. You’ll learn that for you, a Quality score below 80 always correlates with next-day brain fog, or that your best creative days often follow nights with high REM percentages.
By following this framework, you become the co-pilot of your own health, using the algorithm as your instrument panel. The data becomes a source of empowerment, not anxiety. It’s the difference between being a passenger and a pilot on your journey to better sleep. To see how others have successfully implemented these strategies, you can find inspiration in real user stories and testimonials.
The Future of the Algorithm: AI, Predictive Insights, and Personalized Sleep Medicine
The sleep score algorithm is not static. It is on a rapid trajectory of evolution, fueled by advances in artificial intelligence, larger datasets, and deeper integration with human biology. The next generation of sleep tracking will move from descriptive analytics to predictive and prescriptive intelligence.
1. From Detection to Prediction: Current algorithms tell you what happened. Future algorithms will tell you what will likely happen and how to prevent it.
Illness Prediction: By analyzing subtle shifts in baseline temperature, resting heart rate, and HRV trends, AI models will be able to predict the likelihood of catching a common cold or flu 24-48 hours before symptom onset, with increasing accuracy. You might receive an alert: "Your biometrics suggest your immune system is activated. Prioritize rest and hydration."
Performance Forecasting: Beyond daily readiness, algorithms will predict your cognitive and physical performance windows for the coming days based on sleep debt and circadian phase, helping you schedule important meetings, creative work, or key workouts at your personal peak times.
2. Hyper-Personalized Sleep Staging and Disorder Screening: Machine learning models trained on massive, diverse datasets (including clinical PSG) will continue to improve staging accuracy. More importantly, they will become personalized.
Individual Sleep Fingerprints: The algorithm will learn that your unique signature for REM sleep looks slightly different from the population average, refining its accuracy for you specifically.
Passive, Longitudinal Screening: By monitoring night-to-night patterns over months and years, the device could identify developing patterns highly suggestive of disorders like sleep apnea or insomnia, prompting a timely referral to a specialist with a rich data history in hand. This is the bridge to personalized sleep medicine.
3. Closed-Loop Environmental and Behavioral Integration: The algorithm will stop being a passive observer and start becoming an active optimizer of your sleep ecosystem.
Smart Home Integration: Your sleep tracker could communicate with your smart thermostat to begin cooling your bedroom at the optimal time based on your personal temperature rhythm. It could sync with smart lights to gradually dim in the evening and simulate sunrise in the morning, perfectly aligned with your circadian phase.
Adaptive Wind-Down Guidance: Instead of generic tips, your app could analyze your day’s stress (via daytime HRV) and evening physiology to prescribe a personalized wind-down routine: "Your stress levels are elevated tonight. We recommend the 15-minute anxiety reduction meditation instead of reading."
4. The Expansion of "Restoration" Metrics: Future sensors may allow for non-invasive tracking of additional biomarkers during sleep.
Nocturnal Blood Glucose Trends: Fluctuations can disrupt sleep. Tracking this could provide dietary insights for better sleep stability.
Blood Oxygen (SpO2) Profiling: Already present in some devices, this will become more precise, providing detailed maps of oxygen saturation throughout the night, a key metric for respiratory health.
Advanced Nervous System Analysis: Deeper analysis of the HRV waveform could provide insights into specific branches of the autonomic nervous system, offering even finer-grained stress and recovery metrics.
The endpoint of this evolution is a seamless, 24/7 health guardian that doesn’t just track sleep but actively curates an environment and lifestyle conducive to optimal recovery and long-term resilience. It’s a future where technology understands your biology so intimately that it can nudge you toward health with uncanny precision. This visionary future is what drives continuous innovation at the forefront of wellness technology, a journey you can follow and learn more about here.