How to Interpret Your Stress Tracking Data Like a Pro
Interpret data by looking for trends over weeks, not daily fluctuations, and correlating high-stress readings with specific events or behaviors.
How to Interpret Your Stress Tracking Data Like a Pro
In our always-on, hyper-connected world, stress has become a silent, constant companion. We feel its weight in our tight shoulders, our restless sleep, and the mental fog that refuses to lift. Yet, for something so ubiquitous, stress remains remarkably misunderstood. We often describe it as a single, monolithic feeling—"I'm stressed"—when in reality, it's a complex, multi-layered physiological symphony conducted by our nervous system. For decades, we've been forced to rely on guesswork and vague intuition to manage it. Until now.
Enter the era of the smart ring, a powerful wearable that moves beyond counting steps and tracking sleep to provide a real-time, quantifiable window into your body's most primal responses. Devices like the Oxyzen ring use advanced sensors to measure key biomarkers like Heart Rate Variability (HRV), skin temperature, and resting heart rate, translating them into actionable stress and recovery insights. But here’s the pivotal shift: data alone is not insight. A graph showing a "high stress" alert is just a number. The true transformation begins when you learn to interpret that data like a seasoned pro—connecting the dots between your daily life, your body's signals, and your long-term well-being.
This guide is designed to be your masterclass in that very art. We’re going beyond the basics of "green is good, red is bad." We will dive deep into the language of your physiology, teaching you to read the subtle narratives hidden within your stress tracking data. You’ll learn to distinguish between productive and destructive stress, identify your unique triggers with forensic precision, and craft a personalized recovery protocol that actually works. This is not about becoming obsessed with metrics; it’s about developing a profound, data-informed conversation with your own body. By the end, you won't just be looking at charts—you’ll be understanding a story. Your story. And you’ll have the tools to rewrite it for a more resilient, balanced, and vibrant life.
The Foundational Science: What Your Ring Is Actually Measuring
Before you can interpret your stress data, you need to understand what it’s actually measuring. Your smart ring isn't reading your mind; it's decoding the language of your autonomic nervous system (ANS). Think of your ANS as your body's autopilot, managing critical functions like heart rate, digestion, and respiration without conscious thought. It has two primary branches, constantly engaged in a delicate dance: the sympathetic ("fight-or-flight") and the parasympathetic ("rest-and-digest") systems. Your stress and recovery data is essentially a live commentary on which branch is in charge.
The Core Biomarkers of Stress & Recovery:
1. Heart Rate Variability (HRV): The Keystone Metric HRV is the most critical and misunderstood metric in physiological tracking. Contrary to what the name might suggest, it is not about your heart rate itself. Instead, HRV measures the tiny, millisecond variations in the time intervals between each heartbeat. A healthy, resilient heart does not tick like a metronome; it has subtle, complex variability.
What it Tells You: High HRV generally indicates strong parasympathetic activity and good resilience—your body is relaxed, recovered, and adaptable to stress. Low HRV suggests dominant sympathetic activity—your body is under strain, fatigued, or fighting illness. It’s your body’s most honest signal of its readiness to perform or its need to rest.
The Nuance: HRV is highly personal. Comparing your number to someone else’s is meaningless. The key is to establish your own baseline and watch for significant deviations.
2. Resting Heart Rate (RHR): The Body’s Idle Speed Your RHR is the number of times your heart beats per minute when you are completely at rest, typically measured during deep sleep.
What it Tells You: When you are well-rested and recovered, your RHR tends to be at its personal low. Acute stress, dehydration, illness, or chronic overtraining can cause your RHR to elevate, as your heart works harder to circulate oxygen and resources. A sustained upward trend in your RHR is one of the clearest flags that your body is under prolonged stress.
3. Skin Temperature (DST): The Subtle Clue Your peripheral body temperature, especially at the finger, is controlled by the ANS. Blood vessel constriction (sympathetic action) reduces skin temperature, while dilation (parasympathetic action) increases it.
What it Tells You: Significant deviations from your personal norm can indicate the onset of illness, poor circulation, or a stress response. For women, it’s also a key component of menstrual cycle tracking. A consistently low nighttime temperature might correlate with poor sleep quality.
4. Respiratory Rate: The Breath of Calm The number of breaths you take per minute, often inferred from heart rate patterns.
What it Tells You: A higher respiratory rate, especially at rest, is a direct sign of sympathetic activation. Learning to correlate moments of high stress with a rapid breathing rate can be a powerful cue to engage in breathwork to consciously activate the parasympathetic system.
These biomarkers don't operate in isolation. Your Oxyzen ring’s algorithm synthesizes them—along with activity and sleep data—to generate composite scores like a Stress Score or Readiness Score. But the pro knows that the real gold is in the raw data trends. To truly master your data, you must first appreciate the sophisticated science behind it. For a deeper exploration of how this technology works, you can discover the detailed sensor technology and algorithms behind Oxyzen.
Setting Your Personal Baseline: Why Your Normal Isn’t Anyone Else’s
Imagine a doctor diagnosing you with a fever based on the average body temperature of everyone in your city. It sounds absurd, yet this is the mistake many make when they first start tracking biometrics. They see a friend’s high HRV or a published "ideal" RHR and immediately feel they are falling short. This comparison is not only demoralizing but scientifically invalid. The single most important step in professional-level data interpretation is establishing your baseline.
What is a True Baseline? Your baseline is not a single number. It’s a dynamic, personalized range for each metric, established over a period of consistent wear (ideally 2-4 weeks) during a relatively stable period of your life. This range represents your body’s unique signature of balance.
How to Establish Your Baseline Effectively:
Wear Consistently: For accurate data, especially for sleep and recovery metrics, wear your ring every night and as much as possible during the day.
Observe During "Normal" Times: Pay attention to your metrics during a week without major travel, illness, or extreme stress. Note the average and the typical high/low swings.
Track Context Relentlessly: Use the journaling feature in your app. Note your daily activities, meals, caffeine/alcohol intake, exercise intensity, work events, and emotional states. Context is the key that unlocks meaning from the numbers.
Understanding Key Personal Variables:
Age & Genetics: HRV naturally declines with age. Your genetic predisposition sets a broad potential range.
Fitness Level: Highly trained athletes often have lower RHR and higher HRV, but they are also more sensitive to signs of overtraining.
Chronotype: Are you a night owl or an early bird? Your body’s natural rhythm significantly impacts the timing of your peak metrics.
Sex & Hormonal Cycle: For women, the menstrual cycle has a profound, predictable impact on core temperature, RHR, and HRV. Estrogen and progesterone fluctuations can cause HRV to drop and RHR to rise in the luteal phase. A pro tracks their cycle alongside their stress data to distinguish hormonal shifts from other stress sources.
Once you know your baseline, you stop asking, "Is my number good?" and start asking the powerful question: "Why is my number different from my normal today?" This shift turns data tracking from a game of judgment into a practice of curious, compassionate inquiry. For more personalized guidance on establishing your health benchmarks, our comprehensive FAQ section offers detailed support.
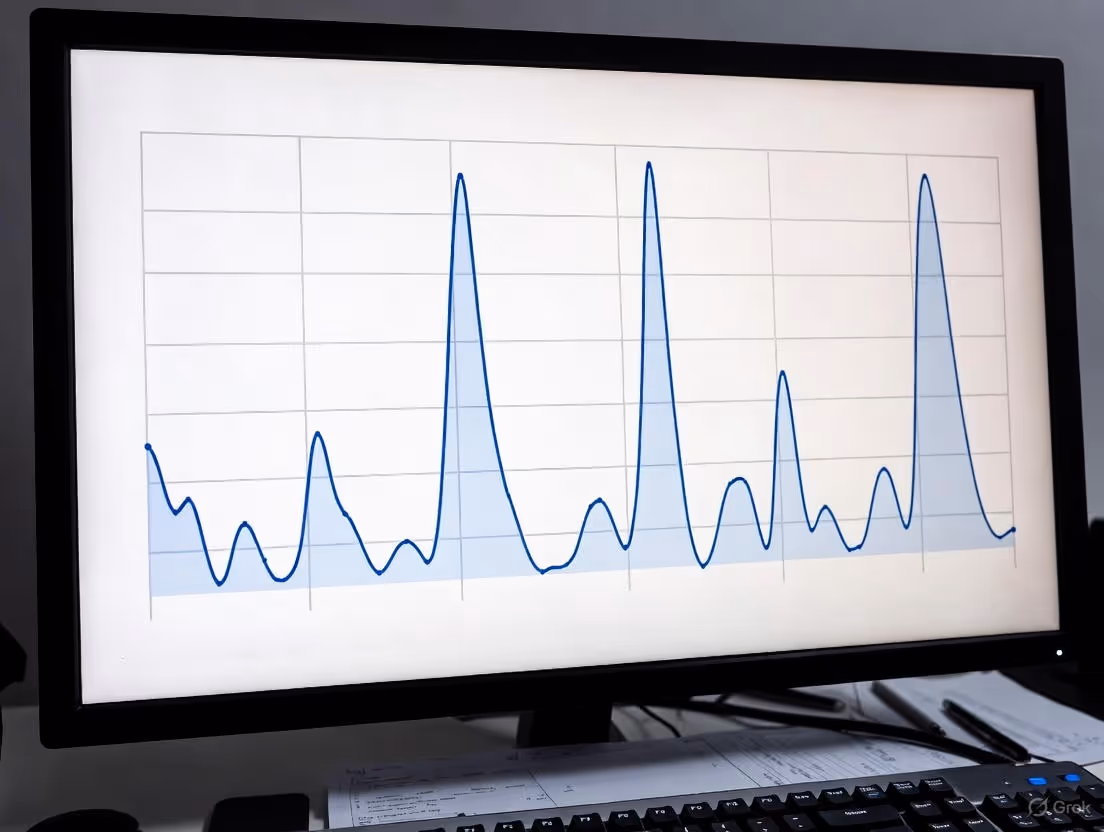
Decoding Your Daily Stress Graph: Peaks, Valleys, and Patterns
Your daily stress graph is the heartbeat of your day, visualized. It’s not just a line; it’s a narrative arc of your physiological journey from morning to night. Learning to read this story is your first practical skill in data interpretation.
Anatomy of a Daily Stress Graph:
The Morning Dip (The Wake-Up Call): You might notice a stress spike right as you wake up. This is often the "cortisol awakening response," a natural, healthy surge that helps you get out of bed. A pro looks to see if this spike is sharp and then declines, or if stress remains elevated, indicating you woke up already in a fight-or-flight state.
The Daily Landscape: Throughout the day, expect natural fluctuations. A commute, a challenging meeting, or an intense workout will create legitimate stress peaks. These are not inherently bad—they are signs your body is engaging with the world.
The Recovery Valleys: The critical moments are the dips after peaks. After a stressful event, does your stress score quickly descend back to a low baseline, or does it stay stubbornly elevated? Rapid recovery indicates resilience. Prolonged elevation signals that your nervous system is struggling to downshift.
The Evening Wind-Down: The hours before bed should ideally show a gradual, steady decline in stress toward your nighttime minimum. A sharp, late-evening stress spike from an argument, intense screen time, or heavy meal is a major red flag for impending poor sleep.
Differentiating Stress Types on the Graph:
Acute Stress (The Spike): A sharp, isolated peak with a clear cause (e.g., a presentation, a near-miss in traffic). It’s short-lived and followed by recovery.
Chronic Stress (The Plateau): A sustained elevation of your stress baseline over hours or days. The graph line seems "stuck" in the medium-to-high zone, with few deep valleys. This is the most metabolically costly and damaging type of stress.
Anticipatory Stress (The Creeping Rise): A gradual increase in stress leading up to a known event. Seeing this pattern can help you identify subconscious anxiety and implement calming techniques before the event.
Actionable Insight Exercise: For the next three days, don’t try to change anything. Simply observe your graph. Set an alarm for three random times each day. When it goes off, pause and note two things: 1) What is your stress score at this moment? 2) What are you actually doing, thinking, and feeling? This practice builds the crucial mind-body connection, moving data from an abstract chart to a direct reflection of your lived experience.
The Nighttime Narrative: What Your Sleep Data Reveals About Stress
Sleep is not an escape from stress; it is the primary battlefield where stress recovery is won or lost. Your sleep data is a forensic report on your nervous system's ability to disengage and repair. Interpreting it through the lens of stress transforms it from a simple performance score into a deep diagnostic tool.
Key Sleep Metrics and Their Stress Interpretation:
1. Sleep Duration vs. Sleep Sufficiency: You might clock 8 hours in bed, but your data tells a different story. Look at your time in deep sleep (Slow-Wave Sleep) and REM sleep. Chronic stress often robs you of deep sleep—the most physically restorative phase—and can fragment REM sleep, where emotional processing occurs. A long duration with low deep sleep is a classic sign of a stressed physiology.
2. Sleep Latency (Time to Fall Asleep): Taking more than 20-30 minutes to fall asleep regularly suggests your sympathetic nervous system is still activated at bedtime. Your body is literally too stressed to turn off. Correlate this with your evening stress graph.
3. Restlessness & Wake-ups: Frequent micro-awakenings, especially in the first half of the night, are often tied to elevated cortisol or a hyper-alert nervous system. It’s as if your body’s night watchman is on high alert, checking for danger constantly.
4. Nighttime HRV and RHR: This is perhaps the most critical data set. During deep, restorative sleep, your parasympathetic system should be dominant, leading to your highest HRV and lowest RHR of the entire 24-hour cycle.
The Pro Interpretation: Don't just look at the sleep-stage graph. Overlay your nighttime HRV/RHR. If your HRV is flat or low during sleep and your RHR is elevated by more than 5-8 bpm above your personal baseline, your body is working overtime, not recovering. This is a non-negotiable signal that systemic stress is present, regardless of how many hours you logged.
The Stress-Sleep Feedback Loop: High daytime stress → Poor sleep quality → Waking up with low HRV/high RHR (poor readiness) → Reduced resilience to next day’s stress → Higher daytime stress... and the cycle continues. Breaking this loop starts with using your sleep data not as a report card, but as a guide for intervention. A poor sleep score isn't a failure; it’s a question: "What prevented my nervous system from shutting down last night?" The answer often lies in the day before. For strategies on improving this critical recovery phase, explore our blog for in-depth guides on sleep optimization.
The Readiness Score Decoded: Should You Push or Should You Rest?
The Readiness Score (or Recovery Score) is your ring’s synthesized recommendation for the day. It’s the algorithm’s best guess at answering the ultimate question: "What is my body’s capacity to handle stress today?" A pro doesn’t follow this score blindly but uses it as a starting point for a deeper conversation.
What Goes Into a Readiness Score? Typically, it’s a weighted composite of:
Sleep Quality & Quantity: (High weight) Did you get sufficient restorative sleep?
Nighttime Recovery Metrics: (Highest weight) Your average HRV and RHR during sleep.
Activity Balance: Did you recover from yesterday’s exertion?
Recent Stress Load: What has your cumulative stress looked like over the past 24-72 hours?
Interpreting the Ranges Like a Pro:
High Readiness (e.g., 80-100): The Green Light
What it Means: Your physiological metrics indicate strong recovery and resilience. Your nervous system is primed for adaptation.
Pro Action: This is the day to strategically apply stress. Schedule your most challenging workout, important meetings, or creative work. Your body is signaling it can not only handle the load but will grow stronger from it. It’s not just a day to "go hard"—it’s a day to be intentionally productive with your stress.
Medium Readiness (e.g., 50-79): The Yellow Caution
What it Means: Your body is in a state of moderate strain or incomplete recovery. Resources are somewhat depleted.
Pro Action: This is a day for maintenance, not peak performance. Opt for moderate, skill-focused exercise like technique work in the gym, a brisk walk, or yoga. Focus on stable energy at work—tackle administrative tasks, have routine meetings. The goal is to support your system without adding significant new strain. Prioritize excellent sleep hygiene tonight.
Low Readiness (e.g., Below 50): The Red Pause
What it Means: Multiple biomarkers (low HRV, high RHR, poor sleep) are flagging significant systemic stress. This could be from illness, emotional trauma, severe overtraining, or sleep debt.
Pro Action: This is a day for active restoration and investigation. Genuine rest is a skill. This means gentle movement like walking or stretching, hydration, nutrient-dense foods, and serious stress-management techniques (meditation, nature time). Crucially, use this data point to investigate the "why." Are you getting sick? Is an emotional burden wearing you down? Forcing a hard workout on a low-readiness day is the fastest way to dig a deeper hole and risk injury or burnout.
The Pro Mindset: Your readiness score is a powerful advisor, not a dictator. A pro couples this score with their own subjective feeling ("How do I actually feel?") and their life context ("I have a critical deadline regardless"). The data might say "low," but if you feel decent and have a non-negotiable commitment, you proceed—but with extreme compassion, extra recovery buffers, and a plan to prioritize rest immediately after.
Identifying Your Unique Stress Signatures: The Detective Work
Once you understand the basic language of the metrics, the next level is becoming a detective of your own life. Your goal is to move from "stress was high today" to identifying your Unique Stress Signatures—the predictable, personalized patterns that connect specific triggers to specific physiological responses.
How to Conduct Your Detective Work:
1. Correlate, Don’t Just Observe. Use the journal feature in your app religiously. Log:
Nutrition: Heavy meals, alcohol, caffeine timing, sugar intake.
Exercise: Type, duration, intensity, and crucially, how you felt during.
Work & Social: Deadlines, difficult interactions, long hours of focused work.
Emotions: Arguments, feelings of anxiety, moments of joy.
2. Look for Patterns, Not Just One-Offs. A single day of high stress after a poor night's sleep is obvious. The pro looks for subtler, recurring patterns over weeks:
"The Monday Spike": Do you see elevated stress every Sunday night/Monday morning? This could be anticipatory anxiety about the work week.
"The Post-Workout Crash": Does your HRV plummet and RHR soar for 24+ hours after a specific type of workout (e.g., high-intensity intervals)? This might signal poor recovery or that this modality is overly stressful for your current state.
"The Social Hangover": Do you see a physiological stress response the day after intense socializing, even if it was fun? This could indicate that as an introvert, social situations are a significant (if enjoyable) drain on your nervous system.
"The Digestive Distress Link": Do you see a stress peak 60-90 minutes after certain meals? This could highlight a food sensitivity that triggers an inflammatory (and stressful) response.
Case Study in a Signature: Sarah noticed her stress graph spiked dramatically every day between 2-4 PM. By checking her log, she saw it correlated with her third cup of coffee, a backlog of emails, and sitting for 4 hours straight. Her signature was a combination of caffeine sensitivity + cognitive fatigue + physical stagnation. Her intervention wasn't just "less stress," but specifically: switch to decaf after noon, use a standing desk, and take a 10-minute walk at 1:45 PM. The 3 PM spike disappeared.
This detective work is empowering. It takes stress out of the realm of a vague, overwhelming force and turns it into a set of identifiable, manageable factors. Our users often share how this process has transformed their self-awareness; you can read their powerful stories in our testimonials.
Eustress vs. Distress: Using Data to Find Your Optimal Stress Zone
Not all stress is your enemy. In fact, a life without stress is a life without growth, challenge, or achievement. The key differentiator, which your data can help you pinpoint, is the difference between eustress (beneficial, adaptive stress) and distress (harmful, debilitating stress).
The Physiological Difference: Both eustress and distress trigger the sympathetic nervous system. The difference lies in the dose, duration, and most importantly, the recovery.
Eustress: A short, sharp, manageable spike in your stress score, followed by a swift and complete return to baseline or even a "supercompensation" where your HRV rebounds to a higher level than before. Examples: a great workout, a successful presentation, a thrilling but safe experience.
Distress: A stress spike that is either too high, lasts too long, or fails to recover. The graph shows a plateau or a jagged series of peaks with no deep valleys. The nighttime recovery is poor, leading into the next day with depleted metrics.
Using Your Data to Find Your "Sweet Spot": Your unique optimal stress zone is where you apply enough challenge to trigger adaptation (higher fitness, better resilience, skill acquisition) without overshooting into systemic overwhelm.
1. The Fitness Lab: After a strength training session, check your data the next morning.
Eustress Response: Slight dip in HRV, slight rise in RHR, but readiness score remains in green/yellow. You feel muscle soreness but energetically good.
Distress Response (Overtraining): A severe, multi-day plunge in HRV, a sustained elevated RHR, very low readiness, and intense fatigue. The stress was too much for your current recovery capacity.
2. The Work Project: During a demanding 2-week project, monitor your trends.
Eustress Engagement: Daily stress peaks during work hours with clear recovery in evenings and on weekends. Sleep metrics hold steady. You feel "healthily tired."
Distress Burnout: Stress baseline creeps up daily, evening recovery disappears, sleep deteriorates, and by the project's end, your metrics are in a deep hole that takes days to climb out of.
The Goldilocks Principle: Your data helps you continuously calibrate. Was that new workout class "just right" or "too much"? Was that work deadline motivating or crushing? By observing the physiological aftermath, you move from guesswork to precise self-regulation, seeking out productive eustress while strategically minimizing exposure to chronic distress.
Context is King: The Logging and Journaling System of a Pro
Raw biometric data without context is like reading a mystery novel with every other page torn out. You see the dramatic events (the spikes and dips) but you have no idea who the characters are or what their motives were. Context is the narrative that turns data points into insight. The most advanced feature of your smart ring isn't a sensor; it's the journaling function, and using it effectively is what separates a casual user from a pro.
Building a High-Value Log:
A pro doesn’t log everything; they log the variables that matter most for their investigation. Create a simple shorthand system in your app's notes.
Daily Non-Negotiables (Log at day's end):
Energy Level (1-10): Subjective feeling is data too.
Work/Life Events: "Big presentation at 11am," "Heated argument with partner," "Day off - hiking."
Symptoms: "Headache started 3pm," "Felt bloated all afternoon," "Unusually thirsty."
The Pro Analysis Ritual: Once a week (Sunday evening works well), spend 15 minutes in review mode.
Look at your weekly trend graph for Stress, HRV, and RHR.
Scan for the highest and lowest points.
Cross-reference each extreme with your logged context for that day and the preceding day.
Ask: "What was happening here? What preceded this? What followed?"
Example of Insight from Context:
Data: Wednesday night HRV was very high, sleep score 95.
Context Log: Wednesday notes: "Light day. 45min yoga at lunch. Meditated for 20min before bed. Read fiction instead of phone."
Data: Thursday afternoon stress spike sustained for 3 hours.
Context Log: "Back-to-back meetings from 10-2, no lunch break, 3 coffees."
Insight: The high recovery from Wednesday's calm practices set me up well, but the Thursday schedule was a known distress pattern. The action isn't just "avoid meetings," but "protect lunch break at all costs on busy days" and "limit coffee on meeting-heavy days."
This practice builds profound self-knowledge. It moves you from being a passive recipient of stress to an active architect of your resilience. For more ideas on effective tracking and journaling methodologies, our blog is filled with user-tested strategies and tips.
Beyond the Day: Analyzing Weekly and Monthly Trends for Macro-Insights
While daily data helps you manage the tactical battles, the true war for long-term health and resilience is won by understanding macro-trends. Zooming out to the weekly and monthly view reveals the slow-moving tides in your physiology that are easy to miss day-to-day. This is where you spot chronic patterns, measure the impact of lifestyle changes, and prevent burnout before it happens.
What to Look for in Weekly/Monthly Views:
1. The Directional Trend (The Slope of the Line): Ignore the daily noise and look at the general direction of your key metrics over 30-90 days.
A gradual, upward trend in HRV alongside a stable or downward trend in RHR is the golden signature of improving resilience and fitness. You are effectively training your nervous system.
A gradual, downward trend in HRV with a creeping upward trend in RHR is the clearest possible warning sign of accumulating, unmanaged stress, overtraining, or a declining health status. This requires immediate lifestyle audit and intervention.
2. The Cyclical Patterns:
Hormonal Cycles: For women, overlaying your cycle on the monthly graph is revelatory. You will likely see HRV drop and RHR rise in the days leading up to menstruation. Recognizing this as a natural, physiological pattern (not a personal failing) allows you to plan for more rest and gentler exercise during this phase.
Work Cycles: Do you see a predictable crash every 6 weeks at the end of a project sprint? Does every quarterly business review tank your recovery for a week? Identifying these cycles allows for proactive "stress budgeting" and post-event recovery planning.
3. The Impact of Lifestyle Interventions: Changed your diet, started meditation, began a new training program? The macro-view tells you if it's working.
Example: You start a daily 10-minute meditation on January 15th. Don't look for a change on January 16th. In your monthly HRV trend, do you see less volatility and a slight upward incline in the weeks after the 15th compared to the weeks before? That's your evidence of efficacy.
4. The Recovery Deficit: Add up your "high stress" days versus your "high recovery" (high readiness) days in a month. Is it a 3:1 ratio? A 5:1 ratio? Chronic stress is fundamentally a math problem: you are withdrawing more from your physiological bank account than you are depositing. The monthly view makes this deficit starkly visible, pushing you to schedule "recovery deposits" with the same seriousness as you schedule work meetings.
This long-lens analysis provides the ultimate "why." It connects your daily choices to your long-term well-being, providing the motivation to stick with positive changes and the urgency to correct harmful ones. It’s the foundation of sustainable health management. Our company was founded on this principle of long-term wellness through awareness; you can learn more about our vision and mission here.
Correlating Subjective Feeling with Objective Data: Bridging the Gap
One of the most powerful, and sometimes unsettling, aspects of biometric tracking is the frequent mismatch between how you think you feel and what your body's data says. You might feel "fine" but see low HRV. Or you might feel "wrecked" but see excellent recovery scores. Bridging this gap between subjective perception and objective data is a master skill that cultivates profound somatic awareness.
Common Disconnects and Their Meanings:
1. "I Feel Great, But My Data Says I'm Stressed."
The Data: Low HRV, elevated RHR, high stress score.
The Potential Reasons:
Adrenaline & Masking: You're running on caffeine and adrenaline, masking underlying fatigue. Your conscious mind is energized, but your nervous system is depleted.
Subclinical Issues: The early stages of illness, dehydration, or low-grade inflammation can depress your metrics before you feel overt symptoms. Your body knows first.
Emotional Numbing: Sometimes, we disconnect from our body's stress signals as a coping mechanism. The data is the canary in the coal mine, telling you what you're not allowing yourself to feel.
2. "I Feel Terrible, But My Data Says I'm Recovered."
The Data: High HRV, low RHR, high readiness score.
The Potential Reasons:
Psychological vs. Physiological Stress: Your metrics measure physiological stress on the nervous system. You may be experiencing purely psychological or emotional distress (worry, sadness, existential angst) that hasn't yet manifested as a heavy physiological burden. The body is resilient, but the mind is struggling.
Mind-Body Lag: After a period of intense stress, your body may have physically recovered (metrics are green), but your mental perception of stress hasn't caught up. You're still operating from a story of being "depleted."
Poor Subjective Interpretation: "Feeling terrible" could be due to factors not directly tied to ANS function, like musculoskeletal pain or a bad mood, which may not significantly impact HRV/RHR.
The Pro Synthesis: The "Bio-Subjective Check-In" Don't let data override your intuition, and don't let feelings dismiss your data. Synthesize them.
Start with the Data: "My readiness is 45. My body is signaling significant strain."
Layer on Subjective Feel: "But subjectively, I feel energetic and motivated to work out."
Practice Curious Inquiry: "Given this disconnect, what's most likely? Am I amped up on adrenaline? Is an illness coming on? Or is my perception just off today?"
Make an Informed Decision: "I will respect the objective signal of strain. I'll swap the intense workout for a walk and focus on hydration and rest. If I still feel great tomorrow with better data, I'll hit it hard then."
This practice builds what psychologists call interoception—the sense of the internal state of your body. Over time, the gap between feeling and data closes. You begin to feel the subtle signs of lowering HRV before you even check your phone. The data becomes a tool to calibrate your intuition, not replace it.
Actionable Insights: From Interpretation to Intervention
Collecting and interpreting data is only valuable if it leads to intelligent action. This final section of our foundational guide is about closing the loop. Now that you can read the story your body is telling, how do you rewrite the next chapter? Here is how a pro translates insight into intervention.
Creating Your Personal Stress-Response Protocol:
Based on your detective work (Section 6), build a menu of interventions tailored to your unique stress signatures.
For Acute Stress Spikes (The "In-the-Moment" Toolkit):
If you see stress rising during work: Act immediately. Try 2 minutes of paced box breathing (4s in, 4s hold, 6s out). This directly stimulates the vagus nerve and parasympathetic system.
Physical Reset: Get up and move for 5 minutes. Walk, stretch, do a few squats. Movement helps metabolize stress hormones.
Cold Exposure: A splash of cold water on the face or 15 seconds of cold water at the end of a shower can trigger a dramatic calming reflex.
For Poor Recovery & Low Readiness (The "Strategic Rest" Protocol):
Prioritize Sleep Above All Else: On low-readiness days, your bedtime is non-negotiable. Implement a strict digital sunset 60 minutes before bed.
Active Recovery Only: Gentle movement like walking, restorative yoga, or foam rolling. The goal is circulation, not exertion.
Hydration & Electrolytes: Chronic stress dehydrates. Prioritize water and consider adding a pinch of salt or an electrolyte supplement.
For Chronic High Baselines (The "Lifestyle Recalibration"): This requires systematic changes identified from your weekly/monthly trends.
Schedule Stress Buffers: If every Wednesday is terrible, block out 30 minutes of "green time" on Tuesday afternoon and Wednesday morning for a walk or meditation.
Refine Your Training: If your data shows consistent overreaching, introduce more low-intensity steady-state (LISS) cardio and reduce high-intensity frequency by 20%.
Digital Boundaries: If evening stress is high, enforce an app blocker on your phone after 8 PM.
Seek Social Support: If emotional stressors are the primary driver, use the data as a concrete reason to talk to a friend, partner, or therapist. Saying "my nervous system is stuck in fight-or-flight" can be a powerful way to ask for help.
The Golden Rule: Change One Variable at a Time. When you see a problem, the urge is to overhaul everything. The pro makes one deliberate change, observes the data's response for 1-2 weeks, and then decides on the next step. Did cutting afternoon caffeine improve your evening stress slope? Did adding a 10-minute meditation improve your sleep latency? This methodical approach turns you into a scientist of your own well-being, building a lifestyle that is empirically proven to work for you.
By mastering these eleven foundational sections, you have moved far beyond simply wearing a smart ring. You have equipped yourself with the mindset and methodology of a professional biohacker. You are no longer a passive subject of stress but an active, informed participant in managing your health. You hold the key to a deeper, data-empowered conversation with the most complex system you'll ever manage: your own body.
Remember, the journey of Oxyzen and the philosophy behind it is one of empowerment through knowledge. To understand more about the driving force behind this technology, you can read about our mission and the team dedicated to your wellness. The path to resilience is now clearly marked—not by a lack of stress, but by the intelligent, responsive way you navigate it.
Section 12: The Advanced Metric: HRV Deep Dive and Heart Rate Variability Biomarkers
If your daily stress score is the headline, then Heart Rate Variability (HRV) is the full, unabridged novel. As the cornerstone metric of physiological resilience, a true pro understands that HRV is not a single number but a rich dataset with its own sub-metrics and nuanced meanings. Moving beyond the simple "higher is better" mantra allows for a sophisticated diagnosis of your nervous system's state.
Understanding HRV Measurement: RMSSD and SDNN
Your ring typically uses one of two primary methods to calculate HRV, most commonly RMSSD (Root Mean Square of Successive Differences). This measures the beat-to-beat variance and is excellent for assessing short-term, parasympathetic (rest-and-digest) influence. Another metric, SDNN (Standard Deviation of NN intervals), looks at variance over a longer period (like 24 hours) and reflects overall ANS balance, including both sympathetic and parasympathetic activity.
Pro Insight: A very low RMSSD is a strong indicator of immediate sympathetic overload or fatigue. A low SDNN over a 24-hour period suggests a lack of physiological flexibility overall—your body is stuck in a narrow band of operation, unable to shift gears effectively between stress and recovery.
The HRV Trend is Your Truth
The absolute number is far less important than its trend over time. A pro tracks their HRV on a rolling 7-day average.
A rising 7-day average indicates improving adaptability and recovery capacity. You are successfully training your resilience.
A falling 7-day average is one of the earliest and most sensitive signs of accumulating fatigue, overtraining, or impending illness. It’s your body whispering a warning before it starts to scream.
HRV Dip Analysis: The "Why" Behind the Drop
Seeing a single-day HRV dip is common. The skill is in categorizing the type of dip to understand its cause:
The Fitness Dip: A sharp, one-day drop following an intense, novel, or long-duration training session. This is a normal signal of a strong adaptive stimulus. Expect a rebound within 1-2 days. If it doesn't rebound, the training load was excessive.
The Mental-Emotional Dip: A drop correlated with high psychological stress, anxiety, or emotional turmoil, even without physical exertion. This shows the powerful mind-body connection and confirms that your mental load has a direct physiological cost.
The Immune Dip: A gradual, multi-day decline often paired with a rising resting heart rate and sometimes a slight increase in skin temperature. This is a classic signature of your body fighting off a pathogen. It’s a clear signal to rest, not stress your system further.
The Lifestyle Dip: A drop tied directly to poor sleep, alcohol consumption, dehydration, or heavy meals. These dips are valuable feedback on how specific behaviors impact your system's baseline function.
By learning to read the character of your HRV dips, you move from "my recovery is bad" to a precise diagnosis: "My recovery is down due to likely immune activation, so I will prioritize sleep and nutrition today instead of trying to push through."
Section 13: Navigating Life Events: Travel, Illness, and Periods of Intense Work
Your body doesn't operate in a vacuum. Major life events create seismic shifts in your biometrics. A pro doesn't fear these disruptions; they anticipate them, use the data to navigate them wisely, and leverage the data to recover faster afterward. This is where your ring transitions from a wellness tool to a true performance and health management system.
Mastering Travel (The Ultimate Stress Test): Travel combines disruption of circadian rhythms, dehydration, poor sleep, physical stagnation, and dietary changes. Your data will reflect this.
Pre-Travel Preparation: In the days before a trip, prioritize sleep and hydration to boost your resilience "bank account."
During Travel Strategy:
Hydration is Non-Negotiable: Set a water goal. Correlate dehydration directly with a plummeting HRV.
Use Data for Jet Lag Management: Upon arrival, use daylight exposure aligned with your target time zone. Observe how your body temperature rhythm shifts over days.
Move Strategically: Use your stress graph. If you're stuck on a plane or in meetings and see stress climbing, take 5 minutes for isometric exercises or walking stretches to help your nervous system reset.
Expect a Dip and Don't Panic: A significant drop in HRV and spike in RHR for 1-3 days post-long-haul flight is normal. Schedule light activity only.
The Pro Move: Use your readiness score upon arrival to decide the pace of your first day. A low score means you schedule a walk and an early bedtime, not a grueling business dinner.
Decoding Illness: Data as an Early Warning System Your biometrics are often the first sign of trouble.
The Signature of Onset: A sustained elevation in Resting Heart Rate (RHR) is the most reliable early indicator. A rise of 5-10 bpm above your baseline for 2+ days, often accompanied by a falling HRV and sometimes a higher skin temperature, strongly suggests your body is fighting something.
During Illness: Respect the data absolutely. Your readiness score will be in the red. This is time for genuine rest—not "active recovery." Pushing through illness based on ego while ignoring this data can lead to prolonged recovery or more serious complications like post-viral fatigue.
The Return-to-Activity Guide: As you recover, don't use the absence of symptoms as your green light. Use your metrics. Wait until your RHR has fully returned to baseline and your HRV shows a stable, recovering trend before reintroducing light activity. This data-driven approach prevents relapse.
Managing Intensive Work Periods (Sprints, Deadlines, Launches): These periods are inevitable. The goal isn't to avoid stress, but to manage its application and recovery strategically.
The Ramp-Up Phase: As a deadline approaches, you'll likely see a gradual increase in your daily stress baseline. This is acceptable. The key is to intensify your recovery rituals in parallel: stricter sleep hygiene, scheduled mindfulness breaks, impeccable nutrition.
Identifying the Breaking Point: Watch for the tell-tale sign of distress: your nighttime recovery fails. Even if you sleep 8 hours, your HRV is low and RHR high. This means work stress is spilling over, and you are no longer recovering daily. This is a critical signal to intervene.
The Strategic Recovery Block: Plan a deliberate "recovery block" for the 2-3 days immediately after the intense period. Clear your calendar of additional stressors. Use your ring to guide you back to baseline. This planned decompression prevents the work sprint from tipping into full-blown burnout. You can see how real users have navigated these challenging periods by reading about their experiences and solutions.
Section 14: The Role of Nutrition and Hydration: Reading Your Body’s Biochemical Signals
What you eat and drink is not just fuel; it's information that directly programs your nervous system and inflammatory response. Your stress and recovery data provides immediate, personalized feedback on how your dietary choices are influencing your internal state. This turns abstract nutrition guidelines into a personalized experiment.
The Hydration Signal: Dehydration is a primary physiological stressor. Even mild dehydration can significantly increase cortisol levels.
Data Correlation: Notice a day where your stress graph is jagged and elevated for no obvious emotional reason? Check your water intake. Dehydration often manifests as a higher RHR and lower HRV. A simple test: drink 16-20 oz of water and observe your stress graph over the next 60-90 minutes. A noticeable calming of the line is a direct demonstration of hydration's calming effect on the ANS.
Food as a Stressor or a Soothe:
The Inflammatory Meal Signature: A large meal high in refined carbohydrates, industrial seed oils, or processed foods can trigger an inflammatory response. For many, this shows up as a sharp stress spike 60-120 minutes post-meal, followed by an energy crash. It may also depress your HRV for several hours as your body deals with the digestive and inflammatory load.
The Blood Sugar Roller Coaster: Erratic blood sugar is a major stress on the system. If you see a pattern of mid-morning or mid-afternoon stress spikes coupled with cravings, it may signal a blood sugar crash from a previous high-glycemic meal. Stabilizing with protein, fat, and fiber at meals often smooths out these daily stress peaks.
Alcohol – The Recovery Saboteur: Alcohol's impact is unambiguously visible in the data. It typically causes:
A suppression of REM sleep.
An elevated resting heart rate throughout the night (often by 10-20 bpm).
A severely depressed HRV.
A poor readiness score the next day, even with 8 hours of "sleep." The data provides a non-judgmental cost-benefit analysis for every drink.
Caffeine Timing and Your Personal Response: Caffeine blocks adenosine (a sleep-promoting chemical) and stimulates cortisol. Its effect is highly individual.
The Experiment: Track your caffeine intake time and compare it to your afternoon stress levels and sleep latency. If you have a coffee at 3 PM and see elevated stress until 7 PM and take 45 minutes to fall asleep, your data is telling you your caffeine clearance is slow. The pro adjusts cutoff times based on this objective feedback, not generic advice.
The Pro’s Approach – The Elimination/Reintroduction Test: If you suspect a food is problematic, use your data. Remove the suspected item (e.g., gluten, dairy, sugar) for 10-14 days. Note your average HRV, RHR, and sleep quality. Then, reintroduce it in a significant amount on a day you can rest the next day. Observe the acute reaction (post-meal stress spike) and the next-morning recovery metrics. This data-driven approach removes guesswork from food sensitivity discovery.
Section 15: Optimizing Your Training: Using Stress Data to Prevent Overtraining and Maximize Gains
For anyone engaged in physical training, a smart ring is the ultimate coaching tool. It moves you beyond rigid, pre-written programs to autoregulated training—adjusting your daily workout based on your body's actual readiness. This is the pinnacle of intelligent fitness, preventing injury and burnout while maximizing results.
The Fundamental Principle: Stress is the Stimulus, Recovery is the Adaptation. You don't get fitter during the workout; you get fitter during the recovery from the workout. Your ring measures your recovery capacity in real-time.
Building Your Autoregulation Framework:
1. The Readiness Score as Your Daily Guide (Recap, Applied):
High Readiness (Green): Day for high-intensity interval training (HIIT), heavy strength sessions, or speed work. Your body is primed to handle and adapt to a strong stimulus.
Medium Readiness (Yellow): Day for moderate, "sweet spot" work, technique-focused skill training, or moderate steady-state cardio (Zone 2). Maintain, don't break down.
Low Readiness (Red): Day for complete rest or very gentle movement like walking, stretching, or foam rolling. Forcing a hard workout here is counterproductive and risky.
2. The HRV/RHR Morning Check – The Deeper Layer: Even if your readiness score is a composite "yellow," look at the individual components.
Scenario A: Readiness 65. HRV is 5% below baseline, RHR is 5 bpm above. This is a "soft yellow"—proceed with caution, maybe reduce planned load by 20%.
Scenario B: Readiness 65. HRV is at baseline, RHR is at baseline, but sleep was short. This is a "fresh yellow"—you're neurologically recovered but under-slept. Focus on movement quality and maybe reduce volume, not intensity.
3. Identifying Overtraining Syndrome (OTS) Before It’s Catastrophic: OTS is not just being tired. It's a systemic breakdown. Your data provides the early warnings:
Stage 1 (Functional Overreaching): A short-term performance decline with noticeable fatigue. Data shows a few days of lower HRV, higher RHR. This is normal and manageable with a few rest days.
Stage 2 (Non-Functional Overreaching): Performance plateau or decline persists for weeks. Data shows a sustained downward trend in 7-day HRV average, a chronically elevated RHR, and persistent poor sleep scores despite rest. Emotional irritability is common.
Stage 3 (Overtraining Syndrome): A long-term (months) performance decline with severe fatigue, apathy, and often illness. Biometrics are chronically in the "red" zone, and they do not improve with 1-2 weeks of rest.
The Pro’s Training Log Integration: Note not just your workout (sets/reps/weight), but your pre-workout readiness score and HRV/RHR, and your perceived exertion (RPE). Over time, you'll see patterns: "When my HRV is below X, my RPE for the same weight is always 2 points higher." This tells you to either lower the weight or postpone the session. This is the true marriage of subjective feel and objective data, creating an unbreakable feedback loop for sustainable progress. For more on building a data-informed fitness plan, our blog features expert collaborations and deep dives.
Section 16: Mental Load and Emotional Stress: When Your Mind Wears Out Your Body
Your ring measures physiological stress, but a significant portion of that stress originates between your ears. Mental work—deep focus, decision fatigue, constant context switching—and emotional burdens like grief, anxiety, or relationship strife have a direct and measurable metabolic cost. Learning to see emotional stress in your biometrics demystifies it and makes it manageable.
The Physiology of a "Heavy Mind": Cognitive and emotional labor activate the sympathetic nervous system and the hypothalamic-pituitary-adrenal (HPA) axis, releasing cortisol and adrenaline. This is identical in many ways to the response to physical threat. Therefore, a day of back-to-back Zoom meetings can show a similar stress graph pattern to a day of hard physical labor.
Identifying Signatures of Mental-Emotional Stress:
The "Cognitive Grind" Pattern: A steady, elevated stress baseline throughout an 8-hour workday, with small spikes for specific tasks. The key differentiator from physical stress? Your body is physically still, but your nervous system is racing. You may also see a higher respiratory rate while sitting.
The "Rumination Rollercoaster": Stress peaks or a sustained high baseline in the evening, when work has stopped but your mind hasn't. This correlates with poor sleep latency and fragmented sleep as your brain struggles to disengage.
The "Emotional Hangover": A significant dip in HRV and rise in RHR the day after an intense emotional event, even if you slept. This shows the prolonged physiological cost of emotional processing.
Using Data to Implement Psychological Hygiene:
Schedule Recovery Based on Cognitive Load, Not Just Physical Load: If you have a day packed with creative work or difficult decisions, schedule it like a heavy training day. Protect your sleep the night before, and plan for genuine downtime afterward.
The "Data-Backed Digital Detox": If you see your evening stress fail to decline, experiment with a strict digital cutoff 60 minutes before bed. Observe the impact on your sleep latency and nighttime HRV. The data provides the motivation to stick with this challenging habit.
Validate Your Need for Rest: It’s common to feel guilty for resting when you "haven't done anything physical." Your stress graph is objective proof that your mental work was real labor. Show yourself the data: "My nervous system was in fight-or-flight for 6 hours today. That is why I'm exhausted and deserve rest."
Correlate Practices with Calm: Track your meditation, breathwork, or therapy sessions. Do you see a tangible dip in your live stress graph during or after the practice? Does a consistent morning meditation practice correlate with a less reactive stress graph throughout the day? This turns mindfulness from a vague "good for you" activity into a quantified stress-management tool with visible ROI.
This understanding fosters self-compassion. It proves that taking a mental health day, setting boundaries, or seeing a therapist is not a luxury or a sign of weakness; it is as critical to your physiological well-being as fixing a broken bone. You are addressing a tangible, measurable stress injury.
Section 17: Environmental and Seasonal Factors: The External Stressors You Can Control
Your body is in constant dialogue with its environment. Factors like light, temperature, noise, and even the time of year impose a baseline load on your autonomic nervous system. A pro learns to read these environmental signatures in their data and creates a microenvironment that supports recovery, rather than undermines it.
Light: The Master Zeitgeber Light exposure is the most powerful regulator of your circadian rhythm, which in turn governs your daily cortisol and melatonin cycles.
The Morning Light Imperative: Lack of bright morning light can dampen your cortisol awakening response, leading to daytime fatigue and an imbalanced rhythm. If you see poor morning readiness and low energy, assess your light exposure within 60 minutes of waking.
The Evening Light Intruder: Blue light from screens after sunset suppresses melatonin, delaying sleep onset and reducing sleep quality. This manifests as elevated evening stress and poor sleep latency data. The intervention is clear: blue-light blocking glasses, screen dimming, and avoiding phones in bed. The data will show you the results.
Seasonal Shifts: As days shorten in winter, many people see a natural dip in average HRV and an increase in resting heart rate. This is a normal response to reduced light and can correlate with lower mood or energy (Seasonal Affective patterns). Using your data to acknowledge this shift allows you to proactively use light therapy and adjust expectations for training and productivity.
Temperature and Sleep Your core body temperature needs to drop to initiate and maintain sleep. Your ring’s skin temperature data is a proxy for this.
The Overheated Room: If your nighttime skin temperature is consistently high and your sleep is restless, your room may be too warm. The optimal sleep temperature for most is between 60-67°F (15-19°C).
The Temperature Dip Signature: A natural, small dip in skin temperature in the middle of the night is normal. A complete lack of variation or an erratic temperature graph can correlate with poor sleep architecture.
Noise Pollution Intermittent or constant low-level noise (traffic, a snoring partner, a humming appliance) triggers micro-arousals you may not consciously notice, but your nervous system does.
Data Correlation: You may see elevated resting heart rate and lower HRV during sleep, or increased restlessness, even with a silent sleep tracker. Experiment with white noise, earplugs, or fixing the noise source. An improvement in sleep score and nighttime HRV confirms noise as a stressor.
The Pro’s Environmental Audit: Use a week of data as a diagnostic. Is there a pattern of poor recovery every Tuesday night? Look at your Tuesday environment. Do you have a late class in a loud, hot gym? Does your partner watch TV loudly later that night? Your biometrics can pinpoint environmental stressors that have become invisible through habit. By methodically adjusting one variable at a time (cooler room, blackout curtains, sound machine) and observing the data, you engineer a sanctuary optimized for your personal recovery. Our founding story is rooted in this holistic understanding of environment and well-being; you can learn more about that journey here.
Section 18: Integrating Wearables: Correlating Ring Data with Other Metrics (Sleep Trackers, Fitness Apps)
While your smart ring provides a profound window into your autonomic nervous system, it is not the only tool in a pro's kit. The most powerful insights often emerge at the intersection of different data streams. By correlating your ring's stress and recovery data with information from other devices, you build a multidimensional picture of your health.
The Sleep Tracker Synergy: You may use a dedicated sleep tracker or a mattress-based sensor. Correlate this with your ring data.
Ring Data: Provides the why of sleep quality via HRV, RHR, and stress response—the physiological state you brought into bed.
Advanced Sleep Tracker Data: May provide more granular detail on sleep stages, breathing disturbances, or limb movement.
The Integrated Insight: Your ring shows low nighttime HRV (poor recovery). Your sleep tracker shows frequent awakenings and snoring. Together, they point strongly toward sleep apnea or another sleep-disordered breathing issue as the root cause, prompting a discussion with a doctor. One device flags the symptom; the combination suggests the diagnosis.
The Fitness Platform & GPS Integration: Link your ring to platforms like Strava, TrainingPeaks, or Apple Health.
External Load (Fitness App): Quantifies the workout you performed—distance, pace, power output, heart rate zones.
Internal Load (Your Ring): Quantifies the physiological cost of that workout—how much it stressed your system, reflected in your post-workout stress score and next-day readiness.
The Golden Ratio – Efficiency: Over time, you can calculate your personal efficiency. For example, does running a 5K at an 8-minute/mile pace always result in a 15-point readiness drop? If one day that same run causes a 30-point drop, your data is telling you that your internal cost was much higher. This could mean you were fatigued, dehydrated, or getting sick. This ratio is a far better guide to overtraining than any single metric.
Continuous Glucose Monitor (CGM) Correlation: For those exploring metabolic health, a CGM provides real-time glucose data.
The Powerful Pairing: You can directly observe how a glucose spike and subsequent crash correlates with a spike in your stress graph. You can see how stable blood sugar throughout the day contributes to a calm, low-variability stress baseline. This turns nutrition choices into a real-time biofeedback game: "If I eat this meal, what happens to my glucose and my nervous system in the next two hours?"
The Pro’s Data Dashboard: The goal is not to become overwhelmed by data but to ask specific questions.
Question: "Why is my sleep quality poor even when I go to bed early?"
Data to Correlate: Ring (evening stress, nighttime HRV/RHR) + Sleep Tracker (sleep stages, disturbances) + Fitness App (evening workout intensity).
Answer: You may find that evening workouts raise your core temperature and stress too much, delaying sleep onset (ring + fitness app), and when you do sleep, you have low deep sleep (sleep tracker).
This integrated approach moves you from isolated data silos to a unified theory of your own health. It allows you to make precise, multi-factorial interventions. For technical questions on how to sync your Oxyzen data with other platforms, our FAQ section provides detailed support.
Section 19: Avoiding Data Obsession: Cultivating a Healthy Relationship with Your Metrics
This is the most critical, non-technical skill of a true pro. Biometric tracking is a tool for empowerment, not a source of anxiety. Without the right mindset, it’s easy to slip into "orthosomnia" – an unhealthy preoccupation with perfect sleep data – or stress about stress scores, creating a ironic negative feedback loop. The goal is to use the data to cultivate awareness without attachment.
Recognizing the Signs of Data Obsession:
Checking your app constantly throughout the day, seeking validation from a "good" number.
Feeling anxiety, guilt, or self-judgment when you see a "bad" score (low HRV, high stress).
Making decisions purely based on the data while completely ignoring your intuitive feelings and the joy of spontaneous living.
The data starts to create stress rather than illuminate it.
The Pro Mindset Framework:
1. The Data is a Guide, Not a Gospel. Your ring measures physiological states, not your worth. A low readiness score is not a failure; it’s valuable information, like a check-engine light. It’s a suggestion to investigate, not an indictment of your lifestyle.
2. Embrace the "Why," Not Just the "What." When you see an undesirable metric, practice shifting from judgment ("My HRV is terrible") to curious inquiry ("I wonder why my HRV is low today? Did I sleep poorly? Am I coming down with something? Was yesterday more taxing than I realized?"). This turns a negative emotion into a problem-solving exercise.
3. Schedule Your Check-Ins, Don’t Snack. A pro doesn't glance at their data all day. They establish rituals:
Morning Check (2 minutes): Review readiness score and last night's sleep. Set an intention for the day based on that information.
Evening Reflection (3 minutes): Look at the day's stress graph, log context, and see what it teaches you. Then, put the phone away.
Weekly Review (15 minutes): The deep dive for trends and patterns, as discussed earlier.
4. Practice Data-Driven Detachment. Intentionally take days or weekends where you live purely by feel. Wear the ring to collect data, but don't look at it. Go for a hike because it feels good, not because your readiness is 85. Sleep in because you're tired, not because your sleep score was low. This maintains your connection to your innate bodily wisdom and prevents the data from overriding it.
5. Focus on the Long-Term Trend, Not the Daily Drama. Zoom out to the monthly view regularly. This perspective shows you that a single bad day or even a bad week is just noise in a much larger, positive trajectory. It teaches resilience and patience.
By mastering this balance, you ensure that technology serves you, not the other way around. The data becomes a silent partner in your well-being journey, offering insights when you ask for them but never becoming the loudest voice in the room. This philosophy of balanced, human-centric technology is at the core of our company's mission and values.
Section 20: Building Your Personal Resilience Protocol: A 30-Day Action Plan
Knowledge without action is merely trivia. We have covered the science, the interpretation, and the mindset. Now, it’s time to synthesize everything into a actionable, personal plan. This 30-day protocol is designed to help you systematically apply pro-level interpretation to build a more resilient you. Think of it as a guided masterclass where you are both student and subject.
Phase 1: Days 1-7 – The Baseline & Observation Week
Goal: Collect data without judgment. Establish your personal baselines for HRV, RHR, and stress.
Daily Actions:
Wear your ring consistently.
Log context faithfully: sleep, exercise, meals, notable events, and subjective energy (1-10).
Do not change any behaviors. Just observe.
End-of-Week Task: Calculate your average HRV and RHR for the week. Note your most common stress pattern. This is your starting point.
Phase 2: Days 8-21 – The Experimentation & Intervention Phase
Goal: Run targeted experiments based on your observations from Week 1.
Weekly Focus Blocks:
Week 2 (Days 8-14): Optimize Sleep. Pick one sleep intervention: strict digital sunset, cooler room temperature, or consistent wake-up time. Implement it every day. Observe changes in your sleep score and, crucially, your morning HRV/RHR.
Week 3 (Days 15-21): Refine Fueling. Pick one nutrition experiment: increase water intake by 30%, add a protein-rich breakfast, or eliminate evening snacks. Observe changes in your daily stress graph stability and energy levels.
Week 4 (Days 22-28): Calibrate Training. Adhere strictly to your readiness score for all workouts. If it's green, push. If yellow, maintain. If red, actively rest. Note how this affects your post-workout recovery and next-day readiness.
Daily Actions: Continue logging. At the end of each week, review the data to see if your intervention moved the needle.
Phase 3: Days 29-30 – The Synthesis & Plan Creation
Goal: Review your 30-day journey and create your ongoing Personal Resilience Protocol.
Actions:
Compare your Week 4 average HRV/RHR to your Week 1 baselines.
Review your journal. What was the single most impactful change you made? What correlation surprised you the most?
Draft your Personal Protocol—a one-page guide for yourself that includes:
Your non-negotiable recovery habits (e.g., "I stop caffeine at 1 PM," "My phone is away by 9:30 PM").
Your readiness-based training decision matrix.
Your go-to stress reduction techniques (e.g., "5-min box breathing for acute spikes").
Your key warning signs (e.g., "If my 7-day HRV average drops by 15%, I schedule a light week").
The Progression Beyond 30 Days: Your protocol is a living document. Revisit it every quarter. As your fitness, life circumstances, and goals change, so will your optimal ranges and strategies. The process itself—of observation, experimentation, and synthesis—is the skill you are mastering for lifelong resilience.
Section 21: When to Seek Professional Help: Data as a Conversation Starter with Your Doctor
Your smart ring is a powerful consumer wellness tool, but it is not a medical device. Its supreme value in a healthcare context is as an objective logging tool that provides concrete evidence of patterns over time. It turns vague descriptions like "I'm tired all the time" or "I don't sleep well" into tangible data trends you can present to a professional. Knowing when and how to use your data to seek help is the final, and perhaps most important, skill of a pro.
Red Flags in Your Data Warranting a Professional Consultation:
Consistently and Extremely Low HRV: If your HRV is perpetually in the bottom 5th percentile for your age/sex group and doesn't respond to sleep, nutrition, and stress management interventions over a month, it could indicate an underlying chronic condition like uncontrolled anxiety, depression, or a metabolic issue.
Chronically Elevated Resting Heart Rate: A RHR that remains 10+ bpm above your established baseline for weeks, without an obvious cause like intense training or illness, should be discussed with a doctor to rule out cardiac, thyroid, or other systemic concerns.
Severe and Persistent Sleep Disruption: If your data consistently shows poor sleep scores, high nighttime heart rate, and low HRV despite excellent sleep hygiene, it may point toward sleep disorders like sleep apnea, restless leg syndrome, or insomnia that require professional diagnosis.
Data that Correlates with Debilitating Symptoms: If periods of terrible data (low readiness, high stress) align with symptoms like heart palpitations, dizziness, extreme fatigue, or cognitive dysfunction, bring both the symptom diary and the correlated data to your appointment.
How to Prepare for the Appointment: Be a Pro Patient. Do not walk in and say, "My smart ring says I'm stressed." Instead, prepare a concise, data-supported narrative:
Summary: "Over the past three months, I've noticed a declining trend in my heart rate variability and an increasing trend in my resting heart rate, despite my efforts to improve sleep and manage stress. Here's a printed graph of the trend."
Context: "This correlates with me feeling persistently fatigued and having difficulty concentrating. I've ruled out common factors like poor sleep hygiene and dehydration."
Specific Ask: "I'm concerned this may indicate an underlying issue. Could we explore potential causes, such as checking for thyroid dysfunction, anemia, or assessing my cardiovascular health?"
What Your Data Provides That Subjective Feeling Cannot:
Objectivity: It removes the "it's all in your head" bias.
Longitudinal Evidence: A doctor sees a snapshot in time. You provide a 3-month movie of your physiology.
Proof of Impact: You can demonstrate how a symptom (e.g., poor sleep) is having a measurable impact on your autonomic nervous system.
The Empowered Partnership: Use your data to become an informed, active participant in your healthcare. It equips you to ask better questions and collaborate with your provider on solutions. Your ring’s data is the starting point for a deeper investigation, guided by a qualified professional. For any technical questions about your device's data accuracy or features as you prepare for such conversations, our FAQ is a valuable resource.
Conclusion of This Portion: The Journey From Data to Wisdom You have now journeyed through the foundational and advanced landscape of stress data interpretation. You've moved from understanding basic metrics to integrating complex life factors, from reading daily graphs to analyzing macro-trends, and from solitary tracking to knowing when to seek collaborative help.
This knowledge transforms your smart ring from a novelty into a lens—a lens that brings the hidden workings of your inner world into startling clarity. The path of the pro is not one of perfect scores, but of perfect understanding. It is the continuous, compassionate application of insight to craft a life not of less stress, but of greater resilience, balance, and vitality. The data is yours. The story is yours. Now, you have the vocabulary to write it well. Continue your learning and discover more strategies by exploring the full range of articles on our blog.