Sleep Improvement Tracking: Measuring What Matters
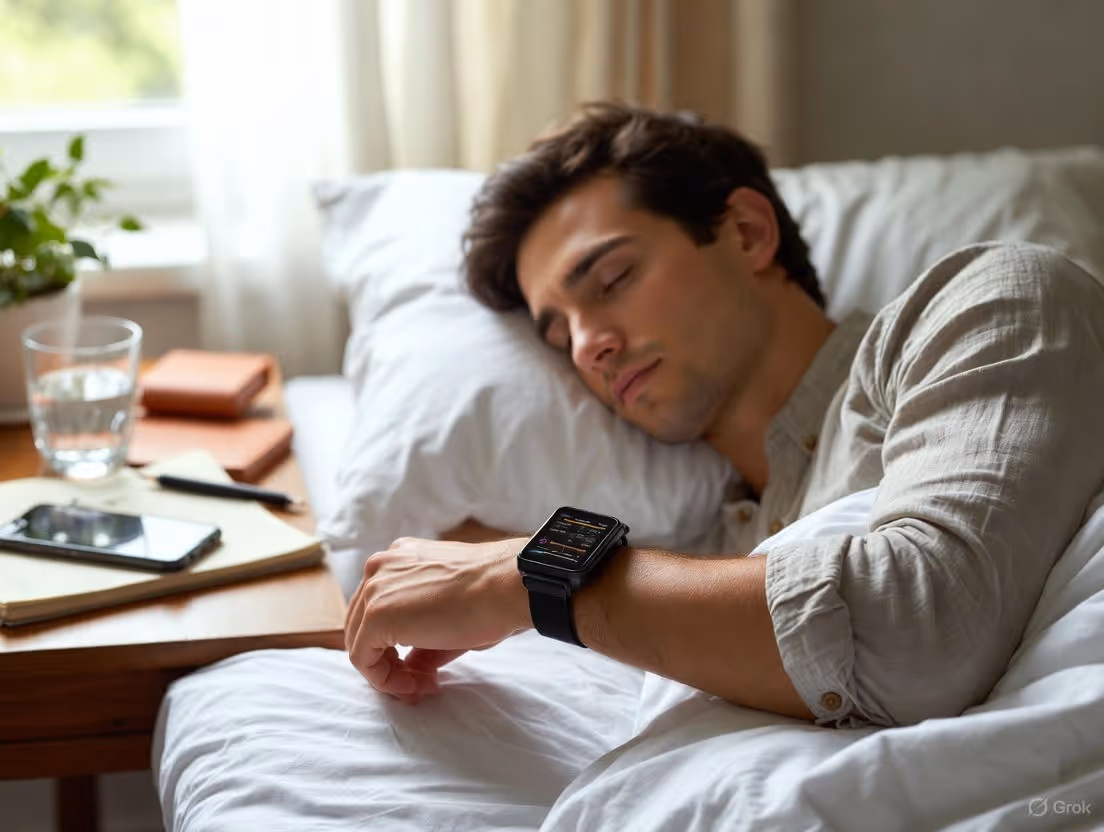
Track what matters most: sleep consistency, how you feel during the day, and key biomarkers like resting heart rate, rather than obsessing over perfect stage data.
Track what matters most: sleep consistency, how you feel during the day, and key biomarkers like resting heart rate, rather than obsessing over perfect stage data.
In the quiet hours of the night, a silent revolution is unfolding. Not in laboratories or clinics, but in bedrooms around the world, where millions are now turning to technology to decode the ancient mystery of sleep. For generations, sleep was a black box—we knew we needed it, we longed for more of it, but we understood shockingly little about its quality, architecture, or how to truly improve it. We’d stumble out of bed, judge our sleep by how groggy we felt, and hope for better tonight. This was sleep in the dark ages.
Today, we stand at the dawn of a new era of sleep enlightenment. The rise of wearable technology, particularly sophisticated devices like smart rings, has flung open the doors to our nocturnal lives. We can now track not just duration, but depth, consistency, interruptions, and the intricate biological processes that unfold while we dream. Yet, with this data deluge comes a pressing question: With so many numbers, graphs, and scores, what actually matters? Are we measuring the right things, or are we drowning in metrics while missing the meaning?
This article is your guide through the complex, fascinating landscape of modern sleep improvement tracking. We will move beyond the simplistic goal of "eight hours" and dive deep into the biomarkers, patterns, and lifestyle interactions that define truly restorative sleep. This isn't about obsessing over data; it's about leveraging intelligent insights to make tangible, life-improving changes. Whether you're a biohacker seeking optimization, someone struggling with chronic fatigue, or simply a person who wants to wake up feeling genuinely refreshed, understanding what to measure—and why—is the critical first step on the journey to better sleep.
The promise is profound. By measuring what matters, we can move from guessing to knowing, from feeling tired to understanding why, and from hoping for good sleep to actively creating it. The path begins here.

We are living through a global sleep deprivation epidemic. The Centers for Disease Control and Prevention has declared insufficient sleep a public health problem, with an estimated one in three adults not getting the recommended minimum. But this crisis is more nuanced than simple sleep debt. It’s a crisis of quality, consistency, and alignment. You might be in bed for eight hours yet wake up feeling like you’ve run a marathon. Conversely, you might log only six and a half hours and spring out of bed energized. The subjective feeling of tiredness, we now know, is a wildly unreliable narrator for the complex story of our sleep.
For decades, the gold standard for sleep assessment was the polysomnogram (PSG), conducted in a clinical sleep lab. It’s comprehensive, measuring brain waves, eye movements, muscle activity, heart rate, and breathing. But it’s also expensive, inaccessible, and a single snapshot in an unfamiliar environment—hardly reflective of your typical night. The first consumer sleep trackers offered a seductive alternative: simple movement-based actigraphy. They told you how long you were in bed and made educated guesses about sleep vs. wakefulness. The problem? They often mistook lying still for sleep and missed crucial details about sleep stages.
This gap between subjective feeling, clinical precision, and consumer convenience created a knowledge vacuum. People knew they weren’t sleeping well but lacked the tools to understand why. They turned to generic advice—less blue light, a cooler room, regular hours—which, while valid, is not personalized. It’s like giving everyone with “stomach pain” the same medicine without diagnosing an ulcer, indigestion, or food intolerance.
The consequence of this blind spot is staggering. Poor sleep isn’t just about yawns and dark circles. It’s intricately linked to a suppressed immune system, weight gain and metabolic dysfunction, impaired cognitive performance (equivalent to being legally drunk), heightened emotional reactivity, and increased long-term risk for cardiovascular disease, diabetes, and neurodegenerative conditions. We would never accept guesswork for our blood pressure or cholesterol levels, yet we’ve historically accepted it for one of the most critical pillars of our health.
The modern solution is not to replace clinical diagnosis where it’s needed but to empower daily, personalized insight. The goal of contemporary sleep tracking is to bring laboratory-grade understanding into the comfort and context of your own life, night after night. It’s about establishing a personal baseline, identifying disruptors unique to you, and tracking the impact of interventions over time. This shift from vague fatigue to precise metrics is the foundation of any real sleep improvement journey. It transforms sleep from a passive state you hope for into an active pillar of health you can manage. To see how this philosophy is put into practice through elegant, user-centric technology, you can explore the mission behind Oxyzen, a company built on simplifying this complex data into actionable wisdom.
The most deeply ingrained myth about sleep is the monolithic worship of the "eight-hour rule." While a useful population-level average, this benchmark is dangerously simplistic on an individual level. Fixating solely on time in bed misses the multidimensional nature of sleep quality. Two people can both sleep for eight hours with vastly different physiological experiences and next-day outcomes. So, if not just duration, what components of "quantity" should we actually measure?
First, we must distinguish between Time in Bed (TIB) and Total Sleep Time (TST). Your smart ring or tracker knows when you got into bed, but the real metric is how much of that time you were actually asleep. The difference is your Sleep Latency (time to fall asleep) and Wake After Sleep Onset (WASO). An ideal sleep efficiency (TST/TIB x 100) is 85% or higher. Spending 9 hours in bed to get 7 hours of sleep (78% efficiency) indicates significant fragmentation and is less restorative than 7.5 hours in bed with 7 hours of sleep (93% efficiency).
But even Total Sleep Time is a crude measure. The architecture of that time is paramount. Sleep occurs in cyclical stages, each with a distinct purpose:
A truly effective tracker doesn't just tell you you slept for 7 hours. It reveals that you got 1.5 hours of deep sleep and 1.8 hours of REM, and that your deep sleep was unusually low last night after that late, heavy meal. This stage breakdown is where insight begins. Consistently low deep sleep might point to physical stress, pain, or an unsuitable sleep environment. Suppressed REM could be linked to alcohol consumption (which fragments REM) or certain medications.
Furthermore, consistency of timing is a critical, often overlooked, component of quantity. Your circadian rhythm thrives on regularity. Going to bed and waking up at wildly different times each day—even if you get the same total hours—is like giving your body constant jet lag. This is known as social jetlag. Measuring your sleep onset and wake time variability across weeks provides a powerful metric for circadian health. A smart ring can silently monitor this, showing you visually how "in sync" your schedule is.
Therefore, redefining quantity means looking at a cluster of interconnected metrics: Sleep Efficiency, Total Sleep Time, Sleep Stage Distribution (especially Deep & REM), and Schedule Consistency. It’s the difference between judging a meal solely by its calorie count versus assessing its balance of protein, fats, carbohydrates, and micronutrients. One tells you a crude amount; the other tells you about nutritional quality. For a deeper dive into how advanced wearables capture these nuanced stages, our blog features detailed explorations of the science behind the sensors.
With the understanding that sleep is multidimensional, we can now define the essential metrics that form the cornerstone of effective sleep improvement tracking. These are the biomarkers that move us from anecdote to analysis.
1. Sleep Stages & Cyclic Patterns: As discussed, the percentage and absolute time spent in Light, Deep, and REM sleep are non-negotiable. But beyond static numbers, the pattern matters. A healthy sleep architecture follows a predictable cycle of ~90 minutes, moving from light to deep to light to REM. A tracker that shows clean, recurring cycles is indicating good sleep continuity. Frequent interruptions or a lack of deep sleep cycles flags a problem.
2. Resting Heart Rate (RHR) During Sleep: Your nighttime RHR is often more reliable than your daytime RHR because it’s measured in a consistent, relaxed state. It’s a profound indicator of recovery and overall cardiovascular fitness. A lower sleep RHR generally suggests better recovery. Perhaps more importantly, the trend is key. A sudden, unexplained elevation in your sleep RHR can be an early warning sign of oncoming illness, excessive stress, or overtraining.
3. Heart Rate Variability (HRV): This is the star metric for many biohackers, and for good reason. HRV measures the subtle variations in time between each heartbeat. Contrary to intuition, a higher HRV indicates a healthier, more resilient autonomic nervous system—specifically, a good balance between the stress (sympathetic) and rest (parasympathetic) branches. During deep sleep, your HRV should naturally rise as your body enters a state of profound repair. Tracking your nightly HRV average and its trend over time provides an unparalleled window into your body’s physiological stress load and adaptation capacity. A consistently depressed HRV is a clear signal to prioritize recovery.
4. Respiratory Rate: The number of breaths you take per minute during sleep is a stable vital sign. It typically decreases as you fall into deeper sleep stages. Monitoring its baseline (usually 12-20 breaths per minute) and watching for significant deviations can be insightful. A consistently high respiratory rate may indicate sleep-disordered breathing, while unusual fluctuations can correlate with disturbed sleep.
5. Sleep Onset & Wake Time (Chronotype Alignment): This isn't just a log. By analyzing when you naturally fall asleep and wake over many nights, advanced algorithms can infer your chronotype—your biological predisposition to being a morning person, evening person, or somewhere in between. Tracking helps you see if your forced social schedule is misaligned with your innate rhythm, a major source of chronic sleep dissatisfaction.
6. Body Temperature Trends: Core body temperature drops to initiate sleep and rises to signal wakefulness. Nocturnal temperature dysregulation can fragment sleep. Some advanced devices, like smart rings (which are ideal for this due to the location on the finger), track subtle changes in peripheral temperature, which correlate with core rhythms and can even predict the onset of illness or, for women, track menstrual cycle phases.
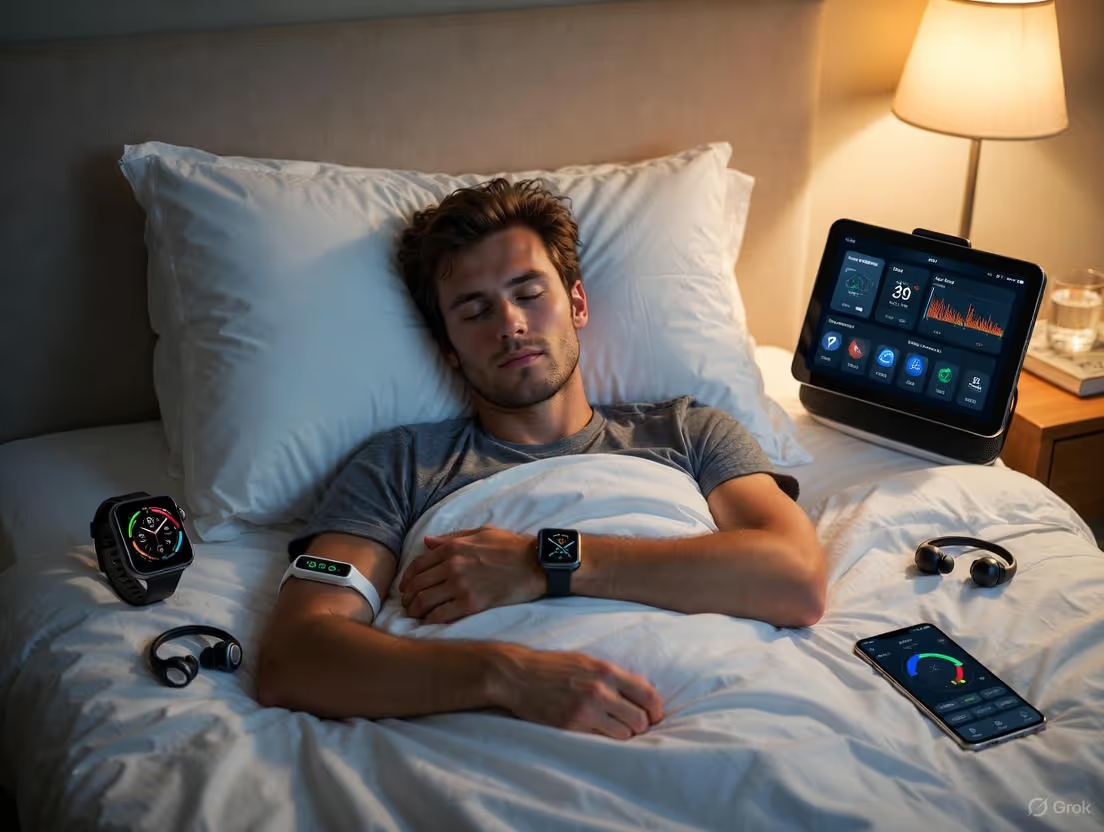
A device that integrates these metrics—sleep stages, RHR, HRV, respiratory rate, timing, and temperature—provides a holistic biophysical picture of your night. It’s the convergence of these data points that creates actionable insight. For instance, seeing a night with low deep sleep, high RHR, and low HRV paints a clear picture of poor recovery, prompting you to investigate the cause (stress, alcohol, infection?). The Oxyzen smart ring is designed specifically to capture this symphony of data seamlessly, turning your night into a rich story of recovery and readiness.
You might be achieving the "right" quantity and even decent stage distribution on paper, yet still wake up unrefreshed. The culprit is often sleep fragmentation—the invisible cracks in the foundation of your sleep. These are the brief arousals and awakenings you don’t remember but that sever the natural progression of sleep cycles, preventing you from spending sustained, quality time in the most restorative stages.
This is where the precision of modern sensors becomes critical. Movement-based trackers can detect major tosses and turns, but they often miss the subtler, more common disruptors. The key metrics for uncovering fragmentation are:
But what causes fragmentation? Tracking can help you correlate these disruption metrics with potential triggers:
The power of tracking is in moving from "I slept badly" to "My sleep was fragmented with 22 awakenings, my SpO2 dipped 12 times per hour, and my heart rate was elevated, suggesting possible sleep-disordered breathing or a significant stress response." This precise language is what enables you to take targeted action, whether it’s investing in a white noise machine, scheduling a doctor’s appointment, or changing your evening habits. For common questions on how wearables detect these issues, our FAQ page provides clear, detailed answers.

If you could have only one metric to gauge your body's readiness to perform, recover, and withstand stress, Heart Rate Variability (HRV) would be a top contender. It has moved from the realm of elite athletics into the mainstream wellness lexicon, and for good reason. During sleep, free from the noise of daily activity and mental stress, HRV delivers its purest signal.
Let's demystify it. Your heart doesn't beat with the metronomic regularity of a drum machine. The time interval between successive heartbeats varies by milliseconds. This variation is controlled by your autonomic nervous system (ANS). When you are relaxed, safe, and recovering—parasympathetic "rest-and-digest" activity is high—the time between beats shows more variability (higher HRV). When you are stressed, anxious, or fighting an infection—sympathetic "fight-or-flight" dominance—the intervals become more regular (lower HRV).
Therefore, your nightly average HRV is a direct biomarker of your recovery status and autonomic nervous system balance. Tracking it over time reveals your personal baseline. The absolute number is less important than the trend relative to your own norm.
How to Use Nightly HRV Data for Sleep Improvement:
It’s crucial to understand that HRV is sensitive and should be viewed through a wide lens. A single low reading is not cause for alarm. Look at the rolling average (often a 7-day trend). Also, factors like hydration, alcohol consumption (which reliably crushes HRV), and your menstrual cycle phase will influence it.
When HRV is viewed in concert with sleep stages and resting heart rate, you have a triumvirate of recovery metrics. A perfect recovery night might show abundant deep sleep, a low RHR, and a high or rising HRV. A poor recovery night might show fragmented sleep, an elevated RHR, and a plummeting HRV. This integrated view stops you from misinterpreting one metric in isolation and gives you a truly comprehensive "readiness" score for the day ahead. Reading real user testimonials often reveals how this integrated data changes people’s relationship with their energy and training.
Your sleep is not an isolated event. It is the final digest of your entire day—what you consumed, what you experienced, and the environment you retreat to. The true power of a sleep tracker isn’t just in reporting numbers; it’s in serving as a sensitive bio-assay that helps you connect the dots between your lifestyle choices and their physiological consequences. This turns tracking from passive observation into active experimentation.
The "Tagging" or Journaling Function: This is your most powerful tool. Before bed or in the morning, you log potential influencers. Modern apps make this simple with quick-tap tags. Essential tags to use include:
After several weeks of consistent tracking and tagging, patterns emerge with stunning clarity. You may discover:
This process of correlation moves you from generic advice ("avoid screens before bed") to personalized, irrefutable insight ("My sleep is uniquely sensitive to caffeine after 2 PM"). It empowers you to make informed trade-offs. Maybe you choose to have that glass of wine on a Friday, accepting the impact on recovery, because the social connection is valuable. But now you do so consciously, not ignorantly.
Environmental Sensor Integration: The next frontier is the direct integration of bedroom environment data. While your wearable measures your body’s response, standalone sensors can measure the room’s conditions: temperature, humidity, light levels, and noise. Imagine your app showing a graph where a spike in room temperature at 3 AM directly correlates with a surge in restless movement and a drop in deep sleep. This data makes the case for a smart thermostat or a better fan incontrovertible. While not all wearables have built-in environmental sensors, the principle remains: use your body’s data as the ultimate judge of your sleep environment’s quality.
By systematically correlating external factors with internal metrics, you become the scientist of your own sleep. You formulate hypotheses ("I think late eating hurts my sleep"), test them through observation, and arrive at data-driven conclusions that form the basis of your personalized sleep protocol. For more on crafting a personalized sleep strategy, our blog is a continual resource for evidence-based tips and user stories.
Consumer sleep trackers are powerful tools for awareness, optimization, and motivation, but they are not medical devices. Their primary role is in health promotion, not disease diagnosis. However, the insights they provide can be the critical catalyst that moves someone from silently struggling to proactively seeking the right professional care. Understanding this line is essential for responsible use.
The Red Flags in Your Data:
Your tracker can highlight persistent patterns that strongly suggest the need for a professional evaluation. These include:
How to Prepare for a Doctor's Visit with Your Data:
Walking in and saying "my ring says I sleep badly" is less effective than presenting a clear, data-supported narrative.
The goal is partnership. Your data provides objective, longitudinal evidence that supplements the subjective history a doctor takes. It can help prioritize referrals for a sleep study, which remains the diagnostic gold standard. By using your tracker as a sophisticated awareness tool, you become an empowered, prepared advocate for your own health, ensuring you get the right help at the right time. The team at Oxyzen built their technology with this philosophy in mind—to empower users with knowledge that fosters better conversations with healthcare providers.
For athletes, executives, students, and anyone whose success depends on peak mental or physical performance, sleep is the ultimate legal performance-enhancing drug. It’s not about rest; it’s about targeted recovery and neural preparation. Tracking transforms sleep from a passive rest period into an active component of a training or performance regimen.
The Athletic Recovery Trinity:
For physical performance, three nocturnal metrics are paramount:
Elite teams now use this data to personalize training loads. An athlete with suppressed HRV and poor sleep gets a modified, lighter workout. This data-driven approach maximizes adaptation and minimizes injury risk, moving beyond rigid, one-size-fits-all training plans.
Cognitive Readiness & Mental Performance:
For knowledge workers, students, and creatives, sleep is the foundation of cognitive function.
By tracking sleep for performance, you move from hoping you’re recovered to knowing you’re prepared. You can align challenging tasks, important meetings, or creative work with mornings following nights of high-quality sleep. You learn which behaviors (e.g., evening meditation, a consistent wind-down) most reliably produce the sleep architecture you need to excel. It’s the difference between leaving performance to chance and engineering it deliberately.
The most common mistake in sleep tracking is overreacting to a single night’s data. One night of poor sleep is a data point, not a trend. The profound value of tracking is revealed not in daily fluctuations, but in the long-term trends, the establishment of a personal baseline, and the visible progress from consistent lifestyle changes. This requires a shift from a daily "score" mentality to a panoramic, longitudinal view.
Establishing Your Personal Baseline:
Forget population averages. What’s "good" for you is unique. Your baseline is established over at least 30 nights of consistent tracking under your normal routine (without major interventions). This will reveal:
This baseline is your health fingerprint. It allows you to see meaningful deviations. A single night’s HRV of 45ms is meaningless unless you know your baseline is 80ms—then it’s a massive warning sign.
Tracking the Impact of Interventions:
This is where the magic happens. Once your baseline is set, you introduce one change at a time. For example, you decide to implement a "no screens after 10 PM" rule for 30 days.
Seasonal and Lifecycle Changes:
Long-term tracking also reveals how your sleep biology changes with seasons (less deep sleep in hotter months?), with menstrual cycles (noticeable changes in RHR, temperature, and sleep architecture across phases), with age, and with life stressors. This fosters self-compassion. Seeing a dip in metrics during a stressful work project isn’t a failure; it’s a predictable biological response. The goal then becomes managing the recovery, not berating yourself for the dip.
The long game is about empowerment through self-knowledge. It’s about quieting the noise of daily scores and listening to the steady signal of your body over months and years. This historical data is invaluable when speaking with healthcare providers and is the ultimate proof of how your lifestyle choices compound for better or worse. Many users share how this longitudinal view provided unexpected insights, as seen in the journeys documented in Our Story.
The accuracy and utility of your sleep improvement journey depend heavily on the tool you choose. The market offers a variety of wearables, each with strengths and compromises. Understanding the core technology and form factor implications is key to selecting the right device for serious sleep tracking.
The Form Factor Advantage: The Smart Ring
For sleep-specific tracking, the smart ring is emerging as the preferred tool for many enthusiasts and researchers, and for compelling reasons:
Devices like the Oxyzen ring are designed with this 24/7 physiological monitoring philosophy at their core, prioritizing the metrics that matter most for recovery and readiness.
The Smartwatch: The Versatile All-Rounder
Wrist-based wearables (Apple Watch, Garmin, Whoop strap) are immensely popular and capable.
Dedicated Bedside Sleep Monitors:
These are non-wearable devices (like the Oura Ring’s competitor, or devices from Withings) that sit on a nightstand or under the mattress.
Key Features to Demand for Serious Sleep Tracking:
Regardless of form factor, your device should provide, at minimum:
The "best" tool is the one you’ll wear consistently, whose data you trust, and whose insights you’ll act upon. For those whose primary focus is unlocking the deepest insights into sleep, recovery, and circadian health, the smart ring’s advantages are becoming increasingly difficult to ignore. To compare features and understand the technology in detail, visiting a comprehensive resource like the Oxyzen homepage can provide clarity on what’s possible with modern ring technology.
You can have perfect sleep hygiene habits, but if your bedroom environment is working against your biology, you're fighting a losing battle. The concept of a "sleep sanctuary" is often reduced to clichés about comfortable pillows. In reality, it's an engineering challenge—creating the ideal conditions for your body to trigger and maintain its natural sleep processes. Your sleep tracker provides the feedback loop to get this engineering precisely right.
1. The Thermodynamics of Sleep:
Your core body temperature needs to drop by about 1-2 degrees Fahrenheit (0.5-1 degree Celsius) to initiate sleep. This process, called distal vasodilation, involves sending heat from your core to your extremities. An environment that hinders this release sabotages sleep onset.
2. The Darkness Imperative:
Light is the primary driver of your circadian rhythm. Even small amounts of light, especially in the blue spectrum, can suppress melatonin production by up to 50%.
3. The Soundscape of Silence:
Noise doesn't just wake you; it causes micro-arousals that shift you into lighter sleep stages without conscious awakening, fragmenting sleep architecture.
4. The Air You Breathe:
Air quality and humidity are subtle but powerful factors.
By treating your bedroom like a lab and your tracker as the measurement instrument, you move from guesswork to precision. The goal is to create an environment so conducive to sleep that your body can't help but comply. It's the foundation upon which all other sleep habits are built. For more ideas on crafting the perfect sleep environment, our community often shares their own data-backed tips on the Oxyzen blog.
Your sleep quality is largely determined in the hours before you close your eyes. The transition from the alert, sympathetic-dominant state of the day to the calm, parasympathetic state required for sleep is not an on/off switch. It's a gradual dimmer switch that must be deliberately managed. This is your wind-down protocol, and every element of it can be measured and optimized.
1. The Light Exposure Countdown:
Managing light is your most powerful wind-down lever.
2. The Digital Sunset:
This isn't just about light; it's about cognitive and emotional arousal. Scrolling social media, answering work emails, or watching thrilling content activates the mind and stimulates stress hormones.
3. The Relaxation Response:
Actively engaging the parasympathetic nervous system is a skill. Track the efficacy of different techniques:
4. The Last Meal & Sip:
A wind-down protocol is not a rigid checklist but a personalized sequence of signals that tell your brain and body, "The day is over; it is safe to rest." By pairing each element with a specific, relevant metric, you can strip out what doesn't work for you and double down on what does, creating a ritual that is both soothing and scientifically validated. For those building their protocol, our FAQ addresses many common questions on the interaction between evening habits and sleep physiology.
You are not a machine that simply needs refueling. You are a biological organism governed by intricate, endogenous rhythms. The most powerful upgrade to your sleep may not be an extra 15 minutes in bed, but aligning your sleep schedule with your innate chronotype—your genetically influenced propensity for sleeping at a particular time. Fighting your chronotype is like swimming against a current; aligning with it lets the current carry you toward better sleep.
1. Discovering Your Chronotype:
While questionnaires like the Morningness-Eveningness Questionnaire (MEQ) are helpful, your wearable data provides an objective, real-world assessment over time.
2. The Cost of Social Jetlag:
This is the mismatch between your biological clock and social clock (work, school). If your natural wake time is 8 AM but your alarm goes off at 6 AM, you're incurring two hours of social jetlag every workday. Your tracker quantifies this damage:
3. Strategic Alignment Strategies:
You can't always live perfectly aligned, but you can optimize within constraints.
By honoring your chronotype, you stop viewing your sleep preferences as a moral failing ("I'm so lazy") and start seeing them as a biological trait. The goal is to reduce the degree of social jetlag, minimizing its health toll. This alignment leads to sleep that feels more effortless, more restorative, and more consistent. It’s a profound shift from fighting your biology to cooperating with it. Understanding individual differences is core to the philosophy at Oxyzen, which aims to provide insights tailored to your unique rhythm, not a population average.
The market for sleep supplements is vast and often confusing—melatonin, magnesium, glycine, L-theanine, apigenin, and countless proprietary blends. While some have robust scientific backing, their effects are highly individual. Blindly popping pills is expensive and can be counterproductive. Your sleep tracker transforms you from a passive consumer into an informed biohacker, allowing you to test supplements with the rigor of a single-subject study.
1. The Gold Standard of Testing: The N=1 Experiment
To evaluate any supplement, follow this protocol:
2. Data-Driven Insights on Common Supplements:
3. Red Flags in Your Data:
Your tracker can reveal when a supplement isn't working or is causing harm:
4. The Critical Disclaimer:
Supplements are not a substitute for addressing foundational issues: light, stress, schedule, and environment. They are fine-tuning tools, not cure-alls. Always consult a healthcare professional before starting any new regimen, especially if you have health conditions or take medications. Your tracked data provides invaluable objective evidence to bring to that conversation.
By using your tracker as a bio-assay, you move from marketing claims to personal proof. You invest only in what demonstrably works for your unique biology, maximizing benefit and minimizing waste and risk. It’s the essence of personalized wellness. For discussions on specific nutrients and their mechanisms, our community often explores these topics in depth on the Oxyzen blog.
Beyond the core trio of stages, HRV, and RHR, a new generation of sensors is providing access to deeper, more clinical-grade biomarkers. These metrics offer unprecedented windows into specific health conditions and the finer details of sleep physiology.
1. Nocturnal Core Body Temperature Rhythm:
Your temperature rhythm is a direct output of your circadian clock. The suprachiasmatic nucleus (SCN) orchestrates a drop in core temperature to initiate sleep and a rise to promote waking.
2. Respiratory Rate (RR):
The number of breaths per minute is a fundamental vital sign that becomes very stable during sleep, making it an excellent metric for tracking changes.
3. Nocturnal Blood Oxygen Saturation (SpO2):
This is perhaps the most significant advance in consumer sleep health screening. It measures the percentage of oxygen carried by your red blood cells.
Together, these advanced biomarkers elevate sleep tracking from a wellness tool to a genuine health monitoring system. They provide a more complete picture of your respiratory and cardiovascular health during the vulnerable period of sleep, empowering you with knowledge that was once only available in a clinical setting. The integration of sensors capable of capturing this data, as found in devices like the Oxyzen ring, represents the cutting edge of personal health technology.
While the fundamentals of sleep physiology are universal, life circumstances create unique challenges that require tailored tracking strategies. Understanding how to interpret your data within your specific context prevents discouragement and leads to more effective, compassionate optimization.
1. Women & Cyclical Sleep Biology:
A woman's sleep is inextricably linked to her hormonal cycle. Tracking across the month is essential to avoid misinterpreting normal fluctuations as problems.
2. Shift Workers: Defying the Sun
For nurses, pilots, factory workers, and others on rotating or night shifts, sleep is a constant battle against biology. Tracking is crucial for damage control and strategic recovery.
3. Parents of Infants & Young Children:
For new parents, the idea of "sleep tracking" can seem like a cruel joke. Yet, it can be a tool for survival, teamwork, and finding small wins.
For all these populations, the principle is the same: use data not to judge yourself against an impossible standard, but to understand your unique challenges, find pockets of opportunity, and make the most of the sleep you can get. It’s about personalized adaptation, not universal perfection. The Oxyzen community includes stories from people in all these situations, highlighting how data provides clarity and control even in less-than-ideal circumstances.
Sleep and mental health exist in a vicious—or virtuous—cycle. Poor sleep worsens anxiety and low mood; anxiety and stress, in turn, devastate sleep. This loop can feel inescapable. However, objective sleep data can serve as a powerful circuit breaker, providing tangible evidence that separates perception from physiology and guides effective intervention.
1. The Physiological Signature of Stressful Sleep:
Anxious or ruminative thoughts before bed create a state of hyperarousal. Your tracker captures this clearly:
2. Using Data for Cognitive Behavioral Therapy for Insomnia (CBT-I) Principles:
CBT-I is the gold-standard non-drug treatment for chronic insomnia. Its principles align perfectly with tracking.
3. Tracking the Impact of Mind-Body Interventions:
This is where biofeedback becomes empowering. You can test which relaxation techniques actually move your physiology.
4. Breaking the Catastrophizing Cycle:
A person with insomnia often catastrophizes: "I only slept 5 hours, tomorrow will be ruined." The tracker provides a reality check. It might show, "You got 5.5 hours with a solid 1.2 hours of deep sleep. Your HRV was decent. You will be functional." This reduces sleep-related anxiety, which itself improves future sleep.
By externalizing the internal state of anxiety into objective graphs and numbers, the sleep tracker depersonalizes the problem. It’s no longer "I'm a bad sleeper"; it's "My data shows hyperarousal, so I will implement technique X." This shifts the focus from identity to strategy, fostering a sense of agency and control—the very antithesis of anxiety. For anyone feeling trapped in this cycle, exploring resources and stories from others who've used data to find a way out can be a source of hope and practical strategies.
Your Trusted Sleep Advocate: Sleep Foundation — https://www.sleepfoundation.org
Discover a digital archive of scholarly articles: NIH — https://www.ncbi.nlm.nih.gov/
39 million citations for biomedical literature :PubMed — https://pubmed.ncbi.nlm.nih.gov/
Experts at Harvard Health Publishing covering a variety of health topics — https://www.health.harvard.edu/blog/
Every life deserves world class care :Cleveland Clinic - https://my.clevelandclinic.org/health
Wearable technology and the future of predictive health monitoring :MIT Technology Review — https://www.technologyreview.com/
Dedicated to the well-being of all people and guided by science :World Health Organization — https://www.who.int/news-room/
Psychological science and knowledge to benefit society and improve lives. :APA — https://www.apa.org/monitor/
Cutting-edge insights on human longevity and peak performance:
Lifespan Research — https://www.lifespan.io/
Global authority on exercise physiology, sports performance, and human recovery:
American College of Sports Medicine — https://www.acsm.org/
Neuroscience-driven guidance for better focus, sleep, and mental clarity:
Stanford Human Performance Lab — https://humanperformance.stanford.edu/
Evidence-based psychology and mind–body wellness resources:
Mayo Clinic — https://www.mayoclinic.org/healthy-lifestyle/
Data-backed research on emotional wellbeing, stress biology, and resilience:
American Institute of Stress — https://www.stress.org/

