Sleep Pattern Analysis: What Your Tracker Is Telling You
Your sleep tracker is telling you about your sleep consistency, duration, and estimated time in different sleep stages, revealing trends in your rest quality.
Sleep Pattern Analysis: What Your Tracker Is Telling You
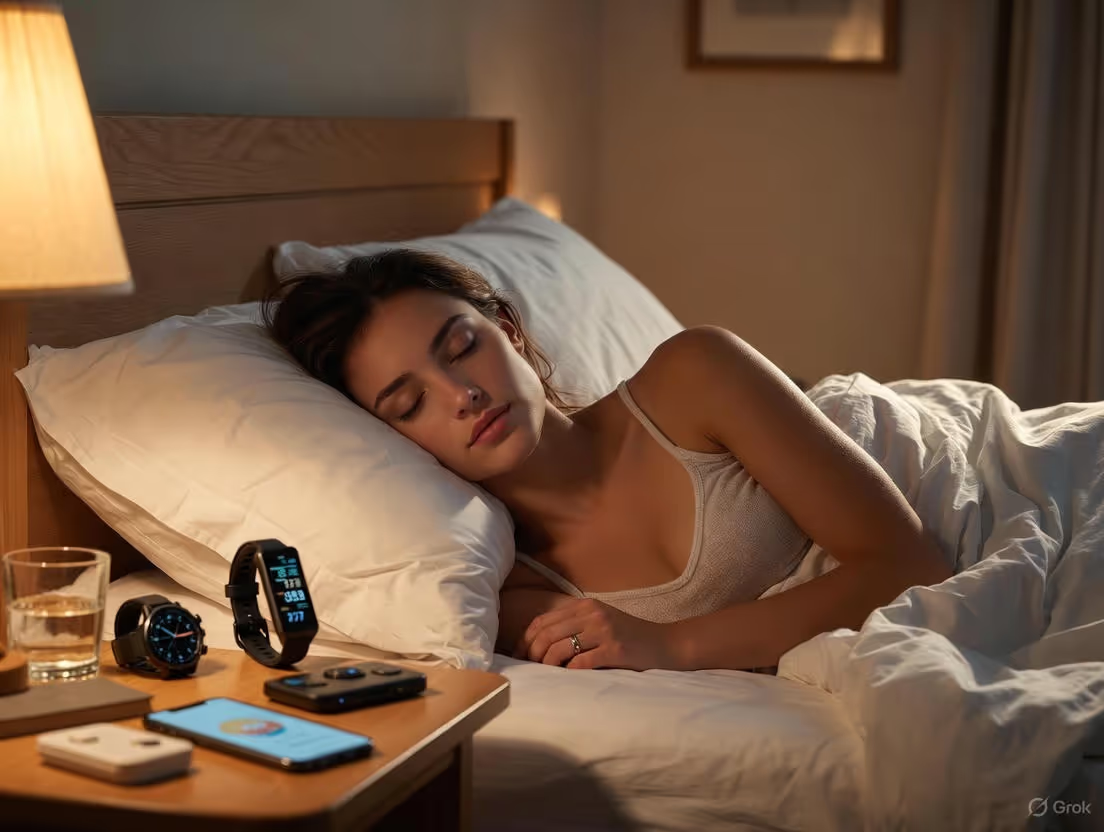
You spend roughly one-third of your life asleep. For centuries, this vital domain of human health was shrouded in mystery, a quiet void punctuated only by the occasional remembered dream. We relied on vague feelings of being “rested” or “exhausted” to gauge its quality. But the rise of wearable technology has changed everything. Suddenly, that enigmatic third of our existence is rendered in crisp, cold data: graphs of heart rate, charts of movement, and percentages that claim to quantify the elusive state of deep sleep. That sleek smart ring on your finger or that watch on your wrist is more than a step counter; it’s a personal sleep laboratory, gathering insights every single night.
But what does it all mean? Staring at a sleep score of 82 or seeing a sudden dip in your REM sleep can be as confusing as interpreting an abstract painting. Is a high resting heart rate during sleep a red flag? Why did you feel groggy despite logging eight full hours? The data itself is just noise without interpretation. True wellness doesn't come from merely collecting numbers, but from understanding the story they tell about your body’s deepest restorative processes. This article is your guide to becoming fluent in the language of your own sleep. We’ll move beyond the simple sleep score and dive deep into the physiology behind every metric, transforming you from a passive data observer into an active architect of your own recovery and vitality. For a deeper understanding of the technology making this possible, you can discover how Oxyzen works with its advanced, non-invasive sensors.
Sleep tracking is no longer a niche hobby for biohackers; it’s a cornerstone of modern preventative health. By analyzing your sleep patterns, you gain unprecedented insight into your stress resilience, metabolic health, cognitive function, and emotional balance. This isn't about obsessive optimization—it’s about building a foundational awareness that empowers you to make smarter choices for your day, your energy, and your long-term well-being. Let’s begin the journey into the night, to decode what your tracker is whispering to you.
The Science of Sleep: Understanding Your Sleep Architecture
Before you can interpret the data, you need to understand what your body is actually doing during the night. Sleep is not a monolithic state of unconsciousness. It’s a dynamic, highly orchestrated cycle of distinct brain and body states, each with a critical purpose. This cyclical pattern is known as your sleep architecture.
Imagine your night’s sleep as a series of plays performed in a theater. Each play has different acts, and the entire series repeats several times before the final curtain. Your sleep architecture follows a similar, predictable pattern, cycling through four main stages every 90 to 120 minutes: three stages of Non-Rapid Eye Movement (NREM) sleep and one stage of Rapid Eye Movement (REM) sleep.
NREM Stage 1 (N1) – The Drowsy Transition: This is the lightest stage of sleep, lasting just 1-5 minutes as you drift from wakefulness into slumber. Your muscles begin to relax, your brain waves slow from their daytime wakefulness patterns (beta waves) to alpha and theta waves, and you can be easily awakened. Think of it as the “pre-show” where the audience is settling in.
NREM Stage 2 (N2) – Light Sleep: This stage accounts for the largest portion (about 50%) of an adult’s total sleep. Your heart rate slows, body temperature drops, and eye movements stop. The brain produces brief bursts of rapid activity called sleep spindles and large waves called K-complexes, which are believed to play a role in memory consolidation and sensory processing, helping to keep you asleep despite minor environmental disturbances.
NREM Stage 3 (N3) – Deep Sleep (Slow-Wave Sleep): This is the most restorative phase. It’s characterized by the slowest brain waves (delta waves). It’s incredibly difficult to wake someone from deep sleep, and if you are awakened, you’ll likely feel disoriented and groggy. This stage is crucial for physical recovery: tissue growth and repair occur, energy is restored, the immune system is bolstered, and critical hormones for growth and development are released. It’s the “heavy lifting” act of the sleep cycle.
REM Sleep – The Dream Stage: Typically occurring about 90 minutes after you fall asleep, REM sleep is where most vivid dreaming happens. Your eyes dart rapidly behind closed eyelids (hence the name), your brain activity increases to levels similar to wakefulness, and your breathing becomes faster and irregular. However, a fascinating phenomenon called muscle atonia occurs—a temporary paralysis of your major voluntary muscle groups, preventing you from acting out your dreams. REM sleep is essential for cognitive functions: memory consolidation, learning, problem-solving, and emotional regulation. It’s the creative and emotional processing act.
A healthy sleep architecture involves smoothly progressing through these stages in cycles throughout the night. Early in the night, NREM deep sleep dominates. As the night progresses, REM sleep periods become longer, culminating in a lengthy REM period just before morning. Your tracker estimates these stages using a combination of movement (actigraphy), heart rate variability (HRV), and pulse oximetry. While it’s not a perfect replacement for a clinical polysomnogram, it provides a remarkably accurate portrait of this nightly architectural blueprint. Disruptions to this architecture—like frequent awakenings that prevent you from reaching deep sleep, or a lack of REM—are the root cause of feeling unrefreshed, no matter how long you were in bed. For more resources on sleep science and wellness optimization, our dedicated blog offers a wealth of related articles.
Beyond Hours in Bed: Key Metrics Your Tracker Monitors
Your sleep tracker synthesizes a vast amount of physiological data into a handful of key metrics. These are the primary numbers and graphs you’ll see on your app dashboard each morning. Let’s demystify each one, moving from the simple to the complex.
1. Total Sleep Time vs. Time in Bed: This is the most basic but crucial distinction. Time in Bed is just that—the duration from when you lie down to when you get up. Total Sleep Time is the actual minutes you were asleep within that period. The gap between these two numbers is your sleep latency (time to fall asleep) and any periods of nighttime wakefulness. A high-quality night isn’t about maximizing time in bed; it’s about maximizing the percentage of that time you’re actually asleep.
2. Sleep Stages Breakdown: This is the visual pie chart or bar graph showing the estimated duration you spent in Light, Deep, and REM sleep. As discussed, a healthy adult typically aims for about 50% Light, 20-25% Deep, and 20-25% REM sleep. Your tracker’s ability to estimate these stages is its most advanced feature, and while absolute precision is challenging outside a lab, the trends over time are incredibly valuable. Seeing your deep sleep consistently drop for a week is a far more powerful insight than simply feeling tired.
3. Sleep Consistency & Schedule: This metric looks at the timing of your sleep, not just the duration. Going to bed and waking up at roughly the same time every day (even on weekends) reinforces your body’s natural circadian rhythm. Your tracker will often give you a “consistency score” or show a calendar view of your bedtimes and wake times. A scattered schedule forces your internal clock to constantly readjust, leading to a form of perpetual jet lag.
4. Resting Heart Rate (RHR): This is your heart rate when you are fully at rest, typically measured during the deepest phases of sleep. A lower RHR generally indicates better cardiovascular fitness and more efficient heart function. Your tracker establishes a personalized baseline, and deviations from this baseline are often more telling than the absolute number. A RHR that’s 5-10 beats per minute higher than usual can be an early sign of oncoming illness, high stress, dehydration, or inadequate recovery from exercise.
5. Heart Rate Variability (HRV): This is arguably the most sophisticated and insightful metric available on modern wearables. HRV is the measure of the subtle variation in time between each heartbeat. Contrary to what one might think, a healthy heart does not beat with the metronomic regularity of a drum machine; it has slight, millisecond variations. High HRV indicates a resilient, adaptable nervous system—your body is able to shift smoothly between stress (sympathetic) and recovery (parasympathetic) states. Low HRV suggests your nervous system is stuck in a stressed or fatigued state. It’s a profound window into your overall recovery status. A rising HRV trend is a great sign; a falling trend suggests you may need more rest.
6. Blood Oxygen (SpO2) & Respiratory Rate: Many advanced trackers now estimate blood oxygen saturation levels and breathing rate during sleep. Significant, sustained dips in SpO2 (a condition known as nocturnal hypoxemia) can be a key indicator of sleep apnea, a serious disorder where breathing repeatedly stops and starts. An elevated or erratic respiratory rate can also signal sleep disruptions, anxiety, or other respiratory issues. Monitoring these trends provides a powerful, proactive health screening tool right from your own bedroom.
By learning to read this dashboard holistically—not just fixating on a single sleep score—you start to see the interconnected story of your nightly recovery. For common questions on how these metrics are captured and calculated, our comprehensive FAQ page provides detailed support.
The Sleep Score Decoded: What Goes Into Your Morning Number
Nearly every sleep tracking platform culminates its analysis in a single, often prominent, number: The Sleep Score. It might be out of 100, a 10-point scale, or a color-coded rating. This score is designed to give you an at-a-glance assessment of your night. But a score of 78 tells you very little if you don’t know the grading rubric. Let’s break down the common components that feed into this algorithm.
The sleep score is a weighted composite of several sub-scores, each reflecting a different aspect of sleep quality. The exact formula is proprietary to each brand, but the core pillars are remarkably consistent.
1. Sleep Duration (Weight: ~30-40%): This is the most straightforward input. The algorithm compares your Total Sleep Time to a target range, typically 7-9 hours for adults. Hitting the sweet spot (e.g., 7.5-8.5 hours) grants maximum points. Significantly less or more sleep than the target range usually results in a deduction, as both short and excessively long sleep can be associated with health risks.
2. Sleep Quality / Depth (Weight: ~30-40%): This is where sleep architecture comes into play. The algorithm analyzes the proportion of your night spent in restorative deep sleep (N3) and REM sleep. A night with sufficient, uninterrupted cycles of these stages scores highly. It also penalizes for fragmentation—frequent awakenings or long periods of restless light sleep that disrupt the natural cycle. Even if you slept for 8 hours, a night plagued by ten awakenings will yield a low quality score.
3. Sleep Consistency / Timing (Weight: ~15-25%): Did you go to bed at your usual time? Did you wake up close to your target? Sleeping in sync with your body’s circadian rhythm earns points. A wildly variable schedule, like going to bed at 10 PM one night and 2 AM the next, confuses your internal clock and lowers your score, even if the total sleep duration was adequate.
4. Restoration & Physiology (Weight: ~10-20%): This newer component incorporates biometrics like Heart Rate Variability (HRV) and Resting Heart Rate (RHR). A high HRV and a RHR at or below your personal baseline are signs of effective physical recovery and contribute positively to the overall score. Some advanced algorithms may also factor in time spent with a calm, steady breathing rate.
It’s critical to remember that the sleep score is a generalized metric. Its true power lies in tracking trends, not obsessing over daily fluctuations. A dip from 85 to 70 is a signal worth investigating—was it due to late-night alcohol, a high-stress day, or an evening workout? Conversely, a steady score in the 80s suggests consistent, healthy sleep habits.
Don’t let the score become a source of anxiety. Use it as a conversation starter with your own body. If you feel fantastic with a score of 75 but groggy with an 85, your personal experience trumps the algorithm. The score is a guide, not a gospel. For real-world examples of how users interpret their scores and data, you can read authentic user experiences and testimonials from the Oxyzen community.
Deep Dive: What Your Heart Rate & HRV Reveal Overnight
While you sleep, your cardiovascular system is telling a vivid story of recovery, stress, and resilience. Two chapters of this story—Resting Heart Rate (RHR) and Heart Rate Variability (HRV)—are particularly revealing. Understanding their nightly patterns transforms your tracker from a sleep monitor into a full-fledged recovery coach.
The Nightly Heart Rate Journey: A healthy, well-recovered heart follows a predictable pattern through the night. As you transition into light sleep (N2), your heart rate begins to descend from its daytime levels. It reaches its lowest, most steady point during deep sleep (N3), as the parasympathetic ("rest and digest") nervous system takes full command. This is when your tracker logs your true Resting Heart Rate. During REM sleep, the heart rate can become variable again—sometimes spiking close to waking levels—reflecting the brain’s heightened activity and emotional processing of dreams. Upon waking, a healthy system shows a gradual rise in heart rate (the "morning surge") in preparation for the day.
Red Flags in Your Heart Rate Data:
Elevated Nightly Average or RHR: If your heart rate doesn’t dip sufficiently or your nightly average is 5+ bpm above your baseline for several nights, it’s a strong signal. Potential causes include overtraining, dehydration, illness onset, high stress/anxiety, caffeine or alcohol consumption too close to bedtime, or sleeping in a hot environment.
Erratic, Spiking Patterns: A heart rate graph that looks jagged with frequent spikes, rather than a smooth valley, usually indicates fragmented, poor-quality sleep. You may be experiencing micro-awakenings, sleep apnea events (where blood oxygen drops and the heart must work harder), or are in a prolonged period of light, restless sleep.
Heart Rate Variability (HRV): The Master Metric of Recovery: HRV measures the beat-to-beat changes in your heart rate. Think of it as your body’s "readiness" score.
High HRV: Indicates a strong, adaptable autonomic nervous system. Your body can easily switch into a relaxed, recovery state. This is associated with better resilience to stress, improved cardiovascular health, and optimal recovery. HRV naturally peaks during deep sleep.
Low HRV: Suggests your nervous system is under strain, dominated by the sympathetic ("fight or flight") tone. This can be due to physical stress (intense training, illness), psychological stress, poor sleep, or unhealthy lifestyle habits.
How to Use HRV Trends: Never judge by a single day’s reading. HRV is highly individual and sensitive. The key is to track your personal baseline and trend over weeks and months.
A consistently rising trend suggests your lifestyle, training, and recovery strategies are working.
A sharp, sustained drop is a clear sign from your body to prioritize rest. It might mean you need a deload week from training, better sleep, or more stress-management techniques.
Many elite athletes use HRV to guide their training intensity: train harder when HRV is high or rising; take it easy or rest when HRV is low or falling.
By learning to read your nightly cardiovascular narrative, you gain a profound, proactive tool for managing your health. It’s like having a direct line to your body’s recovery status, allowing you to make informed decisions about your day before you even have your morning coffee. This commitment to deep, physiological insight is at the core of our mission and vision at Oxyzen.
The Oxygen Connection: Why SpO2 is a Critical Sleep Metric
Blood oxygen saturation, or SpO2, measures the percentage of hemoglobin in your blood that is carrying oxygen. While awake, a healthy individual typically maintains a level between 95% and 100%. During sleep, a slight dip of a few percentage points is normal due to slower, shallower breathing. However, significant or frequent drops can be a major red flag, making nocturnal SpO2 monitoring one of the most important health features in modern sleep trackers.
Understanding Nocturnal Oxygen Drops: When you sleep, your throat muscles relax. For some people, this relaxation can cause the airway to partially collapse (hypopnea) or completely close (apnea), obstructing breathing for 10 seconds or more. These events, characteristic of Obstructive Sleep Apnea (OSA), cause blood oxygen levels to fall. Your brain, detecting the rising carbon dioxide, briefly arouses you (often without full consciousness) to restart breathing. This cycle can repeat dozens or even hundreds of times per night, severely fragmenting sleep and starving your brain and organs of oxygen.
What Your Tracker's SpO2 Graph is Telling You:
A Flat, High Line (~97-99%): Indicates stable, healthy breathing and oxygen intake throughout the night. This is the ideal pattern.
Frequent, "Sawtooth" Dips: A graph showing repeated dips below 94%, especially if they drop to 90% or lower, followed by rapid rebounds, is a classic signature of sleep-disordered breathing like apnea. These dips often correlate with spikes in heart rate as your body struggles.
Sustained Lower Baseline: A graph that shows your SpO2 consistently sitting in the low 90s or high 80s for periods of the night is also a serious concern, potentially indicating hypoxemia related to lung or cardiovascular conditions.
Why This Metric is a Game-Changer: Sleep apnea is notoriously underdiagnosed. Many sufferers have no memory of their nighttime awakenings and may simply report daytime fatigue, morning headaches, or irritability. A consumer wearable cannot diagnose sleep apnea—that requires a clinical sleep study. However, it can serve as a powerful screening tool. A persistent pattern of significant SpO2 dips is a strong, data-driven reason to consult a sleep specialist. Catching and treating sleep apnea can be life-changing, reducing risks for hypertension, heart disease, stroke, and type 2 diabetes while dramatically improving daily energy and cognitive function.
Beyond Apnea: Other Insights from SpO2: Elevated respiratory rate or dips in SpO2 can also be linked to other factors:
Sleeping at High Altitude
Respiratory Infections (like colds or flu)
Asthma or COPD
Heart Failure
By adding SpO2 to your sleep analysis toolkit, you move beyond measuring sleep quality and start monitoring a fundamental aspect of sleep safety and physiological health. It empowers you with knowledge, turning your tracker into a 24/7 guardian of your well-being. For the story behind our focus on integrating such critical health metrics, you can explore the Oxyzen brand journey and founding story.
Identifying Your Personal Sleep Patterns & Baselines
With an understanding of the key metrics, the next step is personalization. The most valuable insights don't come from comparing your numbers to a population average, but from establishing your own unique baselines and observing how you deviate from them. What’s normal for you is your most important reference point.
The 30-Day Baseline Establishment: To move beyond daily noise, commit to a consistent monitoring period of at least 30 days, ideally during a time of relative stability (not vacation or extreme stress). The goal is not to achieve perfect scores, but to capture your "typical" pattern.
Track Your Averages: Calculate your average Total Sleep Time, Sleep Score, RHR, and HRV over this period. These become your personal benchmarks.
Note Your Natural Rhythm: What is your natural bedtime and wake time when you don’t have an alarm? What’s your typical sleep stage distribution? Some people are naturally "deep sleep dominant," while others get more REM.
Pattern Recognition: Becoming a Sleep Detective: Once your baseline is set, you can start investigating the causes behind deviations. This is where you connect the dots between your lifestyle and your data.
The Alcohol Experiment: Track a night after 1-2 drinks. You’ll likely see a faster time to fall asleep (due to sedation), but then a dramatic suppression of REM sleep in the first half of the night and a spike in resting heart rate. The result? You sleep for 8 hours but wake feeling unrefreshed.
The Late-Night Meal: A heavy, fatty, or spicy meal close to bedtime can increase sleep fragmentation and reduce sleep quality as your body focuses on digestion rather than restoration.
The Intense Evening Workout: While regular exercise improves sleep overall, a very hard session too close to bedtime can elevate core temperature and sympathetic nervous system activity, leading to a higher RHR and lower HRV for the night, delaying the onset of deep sleep.
The High-Stress Day: A mentally or emotionally taxing day often manifests as a lower sleep score, higher RHR, lower HRV, and increased sleep latency (trouble "turning off" your brain).
The Power of Logging: Use your app’s journal feature or your own notes to tag your days. Note: stress levels, workout type/intensity/time, caffeine/alcohol intake, meals, and subjective feelings. After a few weeks, you’ll start to see undeniable correlations. You might discover that your HRV plummets after poor hydration, or that your deepest sleep follows days with afternoon sunlight exposure.
This process of self-experimentation turns abstract data into actionable wisdom. You’re no longer just collecting numbers; you’re conducting personal research to discover the specific lifestyle levers that optimize your recovery. It’s the essence of personalized wellness, a philosophy we explore in depth on our blog dedicated to smart health technology.
Common Sleep Disruptors Seen in Your Data
Your sleep tracker acts as a brilliant detective, uncovering the culprits that sabotage your rest. Often, we are unaware of these disruptors until we see their fingerprint in the data. Let’s examine the most common offenders and the tell-tale signs they leave behind.
1. Stress and Anxiety (The Mental Intruder):
Data Signature: Increased sleep latency (long time to fall asleep), elevated RHR, lower HRV, increased nighttime awakenings (especially in the second half of the night), and reduced deep sleep. The heart rate graph may show less of a smooth decline.
Why: A racing mind activates the sympathetic nervous system, opposing the relaxation needed for sleep. Cortisol, the stress hormone, may be elevated at night when it should be low.
2. Diet and Alcohol (The Chemical Saboteurs):
Alcohol: As noted, it’s a sedative, not a sleep aid. Data shows suppressed REM early, followed by rebound REM later, a higher and more variable RHR, and often early morning awakenings. Sleep feels less restorative.
Caffeine: Has a half-life of 5-6 hours. Consuming it late in the day can significantly increase sleep latency and reduce total sleep time, even if you feel you "fell asleep fine."
Heavy/Late Meals & Sugar: Can cause digestive discomfort, leading to more movement and awakenings, and may cause blood sugar spikes and crashes that disrupt sleep continuity.
3. Environment (The Physical Thief):
Temperature: Your core body temperature needs to drop to initiate sleep. A room that’s too warm (typically above 68°F/20°C) prevents this drop, leading to restlessness, less deep sleep, and more awakenings.
Light & Blue Light: Even small amounts of light (from a charger LED, streetlight, or screen) can suppress melatonin production. Data may show longer sleep latency and disrupted cycles.
Noise: Intermittent or low-level noise (traffic, a partner snoring) can cause micro-arousals you don’t remember, fragmenting your sleep and chopping up your deep sleep cycles. Your movement graph or increased RHR during the night may reveal this.
4. Sleep Apnea and Snoring (The Breathing Blockers):
Data Signature: The classic "sawtooth" SpO2 pattern with repeated dips. Correlated spikes in heart rate following each dip (an arousal). High movement/restlessness. Often accompanied by a high resting heart rate and low HRV due to chronic stress on the system.
Note: Loud snoring is a primary indicator, but not all snorers have apnea, and not all apnea patients snore loudly. Data is key.
5. Poor Sleep Hygiene & Schedule Irregularity (The Self-Inflicted Wound):
Data Signature: Inconsistent bedtime and wake time graphs. Low "consistency" scores. On weekdays, you may see short sleep; on weekends, very long sleep but with poor quality (too much light sleep, fragmented deep sleep) as your body struggles to recover from cumulative debt.
6. Overtraining and Illness (The Physical Stress Signals):
Overtraining: Presents similarly to chronic stress: elevated RHR, suppressed HRV, increased wakefulness, and a feeling of fatigue despite adequate time in bed. Your body is in a catabolic, inflamed state and cannot recover properly.
Illness Onset: One of the earliest and most reliable signs is a sustained elevation in your resting heart rate above your baseline, often paired with a drop in HRV, even 24-48 hours before you feel obvious symptoms.
By learning to match these data signatures to potential causes, you move from wondering "Why do I feel terrible?" to knowing "My data shows high RHR and low HRV for three nights, likely from that stressful project and late workouts. I need to prioritize wind-down time and maybe take a rest day." This is proactive health management at its finest. If you're curious about how others have identified and overcome their unique sleep disruptors, the shared journeys in our customer testimonials can be both enlightening and inspiring.
How to Use Your Data to Improve Sleep Hygiene
Knowledge is only power if you act on it. Your sleep data provides the diagnostic report; effective sleep hygiene is the treatment plan. Here’s how to translate your insights into actionable, evidence-based changes that can transform your sleep architecture.
1. Optimize Your Schedule (Leverage Consistency Data): If your data shows erratic bedtimes, your first mission is to build consistency.
Action: Set a fixed wake-up time, seven days a week. This is the anchor for your circadian rhythm. Even if you slept poorly, get up at this time. Then, work backward to set a target bedtime that allows for 7-9 hours in bed.
Data Check: After 2 weeks, look for an improved consistency score and a more stable graph of your sleep stages.
2. Craft a Powerful Wind-Down Routine (Address Sleep Latency & Stress): If your data shows long sleep latency or high nighttime heart rate, your nervous system needs help transitioning to rest.
Action: Create a 60-90 minute "digital sunset." Use app blockers to limit blue light, or wear blue-light-blocking glasses. Replace scrolling with reading, light stretching, meditation, or a relaxation practice. A warm bath or shower 1-2 hours before bed can help by raising your body temperature, leading to a more pronounced drop afterwards, which signals sleep readiness.
Data Check: Look for a decrease in the "Time to Fall Asleep" metric and a smoother decline in your nightly heart rate graph.
3. Engineer Your Sleep Environment (Fix Fragmentation): If your movement graph is spikey or you have frequent awakenings, your environment may be to blame.
Action:
Temperature: Aim for a cool room (65-68°F / 18-20°C). Use breathable bedding.
Darkness: Invest in blackout curtains. Cover or remove all electronic lights. Consider a comfortable sleep mask.
Quiet: Use a white noise machine or earplugs to mask disruptive sounds.
Comfort: Ensure your mattress and pillow provide proper support.
Data Check: You should see a reduction in "Awake Time" and "Restlessness," and potentially an increase in your deep and REM sleep percentages.
4. Mind Your Intake (Correct Chemical Disruptions): If you see the signatures of alcohol, caffeine, or late meals, adjust your timing.
Action:
Caffeine: Establish a firm cutoff time, ideally by 2 PM.
Alcohol: Understand its impact. If you choose to drink, do so early and in moderation, and hydrate well.
Food: Finish large meals at least 3 hours before bedtime. If you need a snack, choose something small and balanced with complex carbs and a little protein (e.g., banana with almond butter).
Data Check: Observe improvements in RHR, REM sleep duration, and sleep continuity on nights you follow these guidelines.
5. Use Daytime Behaviors to Fuel Nighttime Sleep:
Morning Light: Get 10-15 minutes of bright, outdoor light exposure within an hour of waking. This firmly sets your circadian clock.
Daytime Movement: Regular exercise, especially earlier in the day, deepens sleep. However, listen to your HRV data—if it’s low, a gentle walk may be better than an intense workout.
Manage Stress Proactively: Use daytime practices like mindfulness, time in nature, or breathwork to lower overall stress load, which will reflect in improved nighttime HRV and RHR.
By iteratively testing these changes and observing the results in your data, you build a personalized, highly effective sleep protocol. It’s a continuous feedback loop: Action → Data → Insight → Refined Action. For further reading on building holistic wellness routines that support sleep, our blog features numerous expert guides.
When to Be Concerned: Data Patterns That Warrant a Doctor's Visit
While sleep trackers are phenomenal tools for wellness optimization and self-awareness, they are not medical devices. It is crucial to recognize the line between self-improvement and symptoms that require professional medical evaluation. Your data can provide the compelling evidence needed to start an important conversation with your healthcare provider.
1. Persistent Signs of Sleep Apnea: If your tracker consistently shows:
Frequent, significant dips in blood oxygen (SpO2) below 90%.
A "sawtooth" SpO2 pattern night after night.
Correlated spikes in heart rate and high restlessness.
And you have daytime symptoms like excessive fatigue, loud snoring (reported by a partner), witnessed breathing pauses, or morning headaches, it is time to see a sleep specialist. A clinical sleep study (polysomnography) is needed for a definitive diagnosis and treatment plan, which can include CPAP therapy, oral appliances, or other interventions.
2. Chronically Elevated Resting Heart Rate: If your RHR remains 10+ beats per minute above your established baseline for more than two weeks, without an obvious cause like a known illness or drastic change in training, consult your doctor. This can be a sign of various conditions, including thyroid issues, anemia, or cardiovascular concerns.
3. Consistently and Abnormally Low Heart Rate Variability: While HRV is personal, a persistent, dramatic low trend that doesn't respond to rest and recovery efforts could indicate chronic overstress, underlying inflammation, or other health issues. Discussing this trend with a functional medicine doctor or cardiologist can provide context.
4. Severe and Chronic Insomnia Patterns: If your data shows consistent sleep latency over 45-60 minutes, total sleep time consistently below 6 hours despite adequate time in bed, and excessive nighttime awakenings for a period of months, and this is impacting your daily life, seek help. A doctor can help rule out medical causes (like pain, reflux, hormonal imbalances) and a cognitive behavioral therapist for insomnia (CBT-I) can provide the gold-standard psychological treatment.
5. Unusual Movement Patterns: While trackers aren't diagnostic for sleep disorders like Periodic Limb Movement Disorder (PLMD) or REM Sleep Behavior Disorder (RBD), if you see extremely high, regular movement graphs or your partner reports you acting out dreams, mention this to your doctor. It can be an important neurological clue.
How to Prepare for the Appointment:
Bring Your Data: Screenshots of your most concerning graphs (SpO2, heart rate, movement) over several nights.
Keep a Sleep Log: Supplement device data with a simple journal of bedtime, wake time, subjective quality, and daytime symptoms.
Be Specific: Instead of "I sleep poorly," say, "My wearable shows my blood oxygen drops below 88% multiple times per hour, and I wake up over 20 times a night according to the movement data."
Your tracker empowers you to be an informed, proactive participant in your healthcare. It provides objective evidence that moves the conversation beyond "I'm tired" to "Here is a measurable pattern of disruption." This partnership between personal data and professional medicine is the future of preventative health. For any technical questions about your device's data accuracy in these contexts, our FAQ and support page is a helpful resource.
The Limits of Technology: Understanding Accuracy and the Human Element
In our quest to quantify sleep, we must maintain a crucial perspective: technology is a guide, not an oracle. Even the most advanced consumer wearables have limitations. Understanding these boundaries prevents misinterpretation, data anxiety, and helps you maintain a healthy relationship with your tracker.
The "How" Determines the "How Accurate": Consumer devices use actigraphy (movement) combined with photoplethysmography (PPG)—flashing LEDs against the skin to measure blood flow changes—to estimate sleep stages, heart rate, and HRV. This is different from the clinical gold standard, polysomnography (PSG), which uses EEG brainwave monitors, EKG heart sensors, and chest bands to measure breathing.
Stage Estimation: Trackers are very good at detecting sleep vs. wake (often >90% accuracy compared to PSG). They are reasonably good at distinguishing light sleep from combined deep/REM sleep. However, accurately separating deep sleep from REM sleep is challenging with movement and heart rate alone, as both stages involve low movement but different brain states. This is the largest source of potential error.
Biometric Accuracy: Heart rate readings are generally very accurate during sleep due to minimal movement. HRV readings are good for tracking trends, though absolute values may differ from clinical EKG-derived measurements. SpO2 accuracy is good for trend spotting but may not be as precise as a medical-grade finger clip, especially at very low saturation levels.
The Human Element: Subjective Feeling is Data Too: Never let a device override your lived experience. This is paramount.
The "Good 75" vs. the "Bad 85": You may feel refreshed and energetic with a sleep score of 75, while an 85-score night leaves you groggy. Your subjective feeling is valid data. The algorithm may weigh factors differently than your body does. Always cross-reference the score with how you feel.
Data Anxiety (Orthosomnia): A growing phenomenon is "orthosomnia"—an unhealthy preoccupation with achieving perfect sleep data, which ironically increases stress and worsens sleep. If checking your score creates dread or you're changing behaviors solely to "game" the number rather than feel better, it's time to step back. Consider hiding the score for a week and just focusing on how you feel.
Context is King: The tracker doesn't know you had a grieving loss, a profound joy, or a mentally stimulating conversation before bed. It only sees physiological outputs. You must provide the context. A low HRV during a difficult life period is expected, not a failure.
Use Technology as a Compass, Not a Map: The ultimate goal is not to become dependent on the device, but to use it as a temporary teacher. Over months, you should start to internalize the lessons. You'll know how late caffeine affects you, how stress impacts your rest, and what a truly restorative night feels like in your body. The tracker confirms and refines this intuition.
Embrace the data, but stay connected to the subjective, qualitative experience of being human. The most advanced wellness tool is the one that eventually helps you listen more closely to your own body, so you might not need to check the app every morning at all. This balanced philosophy is central to our vision and values at Oxyzen, where we believe technology should enhance human awareness, not replace it.
Advanced Sleep Analysis: Correlating Sleep Data with Daytime Performance
The true value of understanding your sleep patterns lies not just in achieving a "perfect" night, but in witnessing the tangible impact on your waking life. Sleep is the ultimate performance enhancer, recovery tool, and cognitive sharpener. By learning to correlate your nightly data with key daytime metrics, you move from passive tracking to active life optimization. This is where your smart ring or wearable transitions from a sleep monitor into a holistic life dashboard.
The Cause-and-Effect Feedback Loop: The relationship between sleep and daytime function is a continuous, two-way street. Poor sleep degrades your day, and a stressful, unhealthy day often leads to poor sleep. Breaking this cycle requires conscious observation of the correlations.
Cognitive & Emotional Correlates:
Sleep Debt and Brain Fog: Track days following nights with short sleep (under 6 hours) or highly fragmented sleep. You’ll likely notice subjective reports of poor concentration, forgetfulness ("Where are my keys?"), and impaired decision-making. Objectively, you might see slower reaction times in cognitive games or increased errors in work.
REM Sleep and Emotional Regulation: REM sleep is crucial for processing emotions and consolidating emotional memories. A pattern of low REM sleep often correlates with increased daytime irritability, anxiety, and emotional volatility. You may find yourself overreacting to minor stressors.
Deep Sleep and Mental Resilience: Sufficient deep sleep (N3) is like a system reset for the brain, clearing metabolic waste and reducing neural inflammation. After a night rich in deep sleep, you’re better equipped to handle cognitive load and maintain focus during demanding tasks.
Physical Performance & Recovery Correlates:
HRV/RHR and Readiness to Train: This is the most direct link. A high HRV and a RHR at or below baseline upon waking strongly suggests your body is recovered and ready for physical stress. A low HRV and elevated RHR is a clear "proceed with caution" or "rest day" signal. Ignoring this and pushing through a hard workout often leads to diminishing returns, increased injury risk, and further suppression of recovery metrics.
Sleep Duration and Athletic Output: Studies consistently show that extending sleep improves athletic performance metrics: faster sprint times, greater shooting accuracy in athletes, improved muscular endurance, and better maximal lift performance. Following nights of poor sleep, you may notice your perceived exertion is higher for the same workout, your power output is lower, or your coordination suffers.
Pain and Inflammation: Inadequate sleep lowers your pain threshold and increases systemic inflammation. If you're managing a chronic issue or acute soreness, observe how it feels after a night of poor sleep versus a restorative one. The data often shows that pain feels more intense and recovery seems slower when sleep is compromised.
Creating Your Own Correlation Dashboard: To make this practical, adopt a simple daily journaling habit alongside your sleep data.
Morning: Note your subjective feeling (energy 1-10, mood 1-10). Record key sleep data: Total Sleep, Deep/REM, HRV, RHR.
Daytime: Track work productivity (ability to focus, tasks completed), workout performance (weights, times, how it felt), and emotional state.
Evening: Reflect on stress levels, diet, and any notable events.
After 30 days, look for patterns. You might discover:
"When my HRV is above [my average], I consistently have my best workouts."
"If I get less than 90 minutes of deep sleep, my afternoon focus is terrible."
"My mood score drops by 2 points the day after my SpO2 shows more than 5 dips per hour."
This personalized feedback loop is transformative. It replaces vague notions like "I need more sleep" with specific, actionable insights: "To perform well in my presentation tomorrow, I need to protect my sleep tonight by avoiding alcohol and starting my wind-down routine by 9:30 PM to maximize deep sleep." For more on using data to optimize daily performance, explore the resources on our wellness and technology blog.
The Circadian Rhythm: Aligning Your Sleep with Your Biological Clock
Your sleep is governed by a master conductor: your circadian rhythm. This is your body's innate, roughly 24-hour internal clock, regulating not just sleep and wakefulness, but also hormone release, body temperature, digestion, and cellular function. The most powerful sleep hack isn't a supplement or a gadget—it's aligning your life with this natural rhythm. Your sleep tracker provides the data to see if you're in tune or off-beat.
Core Body Temperature and Melatonin: The Key Signals: Two primary physiological processes drive your circadian rhythm:
The Sleep/Wake Homeostat: Think of this as "sleep pressure." The longer you're awake, the more adenosine builds up in your brain, increasing your drive to sleep. Caffeine works by blocking adenosine receptors.
The Circadian Pacemaker: Located in the brain's suprachiasmatic nucleus (SCN), this is your master clock. It uses environmental cues, primarily light, to synchronize itself with the 24-hour day. It dictates the release of melatonin (the "darkness hormone" that promotes sleepiness) and the dip in core body temperature that is necessary for sleep onset.
Your tracker infers your circadian phase through your sleep timing, consistency, and nighttime body temperature trends (if it has that sensor).
Chronotypes: Your Personal Rhythm Blueprint: Not all circadian rhythms are set to the same schedule. Your chronotype is your genetically predisposed tendency to be a morning person, evening person, or somewhere in between ("night owl" vs. "early bird").
What Your Data Shows: A true night owl forced onto an early schedule will show consistently long sleep latency when going to bed early, and their deepest, most restorative sleep may occur in the early morning hours before a forced alarm. Their natural rhythm is simply shifted later.
Social Jetlag: This is the strain that occurs when your social/work schedule (e.g., waking at 6 AM for work) clashes with your biological chronotype (e.g., naturally falling asleep at 1 AM). Your tracker will show short, poor-quality sleep on weekdays and then very long, often fragmented "recovery" sleep on weekends as you try to pay back the debt. This constant shifting is profoundly stressful on the body, linked to weight gain, metabolic issues, and mood disorders.
Using Your Tracker to Hack Your Circadian Rhythm:
Find Your Natural Rhythm: If possible, on a vacation without alarms, track your sleep. Your natural bedtime and wake time will reveal your underlying chronotype.
Anchor with Morning Light: The single most powerful cue for your SCN is bright light in the morning. Get 10-15 minutes of outdoor light within 30-60 minutes of waking. This signals "daytime," sets your melatonin timer for about 14 hours later, and boosts daytime alertness. Your data may show improved sleep consistency and earlier sleep onset as a result.
Defend Against Evening Light: Conversely, blue-rich light from screens in the evening delays melatonin release, tricking your brain into thinking it's still daytime. Use night modes, dim lights, and consider amber-tinted glasses if you must use screens. Observe if this decreases your "time to fall asleep" metric.
Leverage Temperature: Your body needs to drop ~1°C to initiate sleep. A cool bedroom (65-68°F) is essential. A warm bath 1-2 hours before bed can help—it raises your core temperature, leading to a more dramatic compensatory drop as you get into bed, signaling sleep readiness.
Be Consistent: Use your tracker's consistency score as a goal. Go to bed and wake up within a 30-minute window every day, even on weekends. This reinforces the rhythm and reduces social jetlag.
By viewing your sleep data through the lens of circadian biology, you stop fighting your body's natural design. You work with it, using light, timing, and temperature to gently guide your internal clock towards optimal alignment for energy, sleep, and health. This science-first approach to wellness is a principle you can learn more about in our company's story.
Sleep Tracking for Specific Populations: Athletes, Parents, Shift Workers
While the core principles of sleep science apply to everyone, life circumstances create unique challenges and priorities. Your approach to interpreting and acting on sleep data should be tailored to your reality. Let’s explore how three distinct populations can leverage sleep tracking most effectively.
For the Athlete and Fitness Enthusiast: For this group, sleep is not just recovery; it's a non-negotiable part of the training program.
Priority Metrics: HRV and RHR are paramount. They are direct indicators of systemic recovery and readiness. The trend is everything.
The Training Integration: Use HRV as a daily guide. Green Zone (HRV high/stable): Proceed with planned intense training. Yellow Zone (HRV dipping): Consider modifying—swap a high-intensity session for a technique-focused or lighter day. Red Zone (HRV chronically low, RHR elevated): This is a mandatory rest or deload day. Overtraining syndrome starts with ignored data.
Sleep Architecture Focus: Deep sleep (N3) is critical for physical repair, muscle growth, and hormone production. REM sleep supports motor skill consolidation and cognitive recovery. Track how heavy training blocks affect your stage distribution. You may need more total sleep (9+ hours) during intense periods.
Actionable Insight: An athlete might see that heavy leg days consistently suppress their HRV for two nights. This isn't bad—it's a sign of an effective stimulus. The insight is to schedule a lighter upper-body day or a rest day after leg day, not another high-load session.
For New Parents and Caregivers: The goal here shifts from "optimal" sleep to "managed" sleep and surviving with resilience.
Priority Metrics: Sleep Fragmentation and Opportunistic Recovery. Let go of the total sleep time obsession. Focus on the metric of "longest uninterrupted sleep block." Even a single 3-4 hour block can be profoundly more restorative than 8 hours of fragmented sleep.
The Power of Nap Tracking: If your device has a nap-detection feature, use it. A 20-30 minute power nap when the baby sleeps can help mitigate deep sleep debt. Note how a short nap affects your evening sleep latency—it shouldn't hinder it if kept brief and early.
Tagging for Context: Use the app’s journal to tag nights as "good night," "rough night," "multiple feedings," etc. This helps you see patterns (e.g., teething phases) and maintain perspective. The data validates the difficulty but can also show you small wins, like a gradually lengthening longest sleep block as the child grows.
Focus on Recovery, Not Perfection: Watch your RHR and HRV as a gauge of your own depletion. If they are in a dangerous trend, it’s a signal to call in support, prioritize rest when possible, and be kind to yourself. The data isn't a judge; it's a witness to your effort and a reminder to seek recovery when you can.
For Shift Workers and Those with Irregular Schedules: This group faces the greatest physiological challenge: fighting the innate circadian rhythm.
Priority Metrics: Consistency (Within the Shift Cycle) and Daytime Alertness. Since you can't align with the solar day, you must create the most stable pattern possible within your shift rotation.
Strategic Light Management: This is your most powerful tool. For Night Shifts: Use bright, blue-enriched light during the shift to promote alertness. Wear blue-light-blocking glasses for the entire commute home in the morning to prevent the sunrise from signaling "wake time" to your brain. Create pitch-black darkness in your bedroom for daytime sleep. For Rotating Shifts: If schedules rotate forward (day → evening → night), it’s slightly easier on the body than rotating backward.
Data for Schedule Negotiation: If possible, use your data as evidence. Show your aggregated sleep scores, HRV, and RHR trends comparing different shift types. This objective data can be powerful in advocating for more health-conscious scheduling if options exist.
Managing the Trade-offs: Accept that some metrics will be suboptimal. The goal is damage control. Focus on maximizing sleep quality during your main sleep block, even if it's at an unusual time. Nutrition and timed caffeine (used strategically at the start of a shift, never near its end) become even more critical.
For each population, the wearable is a tool for adaptation and resilience. It provides the objective truth of how your lifestyle is impacting your physiology, allowing for smarter, more personalized adjustments within the constraints you face. Real people navigating these challenges share their strategies and outcomes in our collection of user experiences and testimonials.
The Future of Sleep Tracking: Trends and Emerging Technologies
The field of sleep science and personal tracking is evolving at a breathtaking pace. What we consider advanced today will be rudimentary in five years. Understanding the trajectory of this technology helps us appreciate its current potential and anticipate the even more personalized, proactive, and integrated wellness tools on the horizon.
From Tracking to Predicting and Intervening: The next frontier is moving beyond descriptive analytics ("This was your sleep last night") to predictive and prescriptive analytics.
Predictive Algorithms: Soon, devices will analyze your daytime activity, stress, and evening physiology to predict your sleep quality before you go to bed. An alert might say: "Based on your high stress and late caffeine today, your predicted sleep score is 68. Consider a 20-minute meditation to improve it."
Personalized "Sleep Recipes": AI will synthesize your historical data to learn what works for you. It could provide customized nightly advice: "For you, a warm shower at 9:45 PM and avoiding phone use after 10 PM increases deep sleep by 15%."
Closed-Loop Intervention: Imagine a smart bed or wearable that detects you are stuck in light sleep and uses subtle, phased auditory stimulation (e.g., playing specific sound waves) to gently guide your brain into a deeper sleep stage without waking you. Early research on this is already underway.
Biometric Expansion: The Multi-Sensor Future: Future devices will incorporate a broader array of sensors for a fuller picture.
Core Body Temperature: Continuous, accurate wrist-based core temperature tracking is a holy grail. It would provide the most direct insight into circadian phase and readiness for sleep. This could help precisely identify fertile windows, illness onset, and metabolic health.
Electrodermal Activity (EDA): Already in some wearables, EDA measures tiny changes in skin sweat, a direct indicator of sympathetic nervous system ("fight or flight") arousal. Tracking EDA during sleep could better quantify stress-related awakenings and nightmares.
Advanced EEG Integration: Consumer-friendly, comfortable headbands that measure brainwaves (EEG) are becoming more sophisticated. While unlikely to replace rings or watches for all-night comfort, they provide the ground truth for sleep staging and could be used for short-term meditation or sleep induction sessions.
Integration with the Smart Home and Healthcare Ecosystem: Sleep data will not live in a siloed app.
Smart Home Syncing: Your wearable will communicate with your environment. As your heart rate drops during wind-down, the lights could dim and the thermostat could adjust. If you're in deep sleep, the smart home could go into "do not disturb" mode, silencing unnecessary notifications.
Clinical Integration: With proper privacy safeguards, you may choose to share longitudinal sleep and HRV/SpO2 data directly with your healthcare provider through secure platforms. This creates a rich, continuous dataset far more valuable than a snapshot from an annual physical. It enables true preventative care, where a doctor can notice a deteriorating sleep pattern or rising RHR trend and intervene early.
Pharmaceutical and Therapeutic Personalization: Sleep data could inform more precise dosing and timing of medications (e.g., for insomnia or circadian disorders) and help measure the efficacy of therapies like CBT-I in real-time.
The future of sleep tracking is holistic, intelligent, and seamlessly integrated into our lives. It aims not just to inform, but to actively guide and assist us in achieving restorative sleep, recognizing it as the irreplaceable foundation of human health. At Oxyzen, we are passionately committed to being at the forefront of this evolution, a journey you can discover more about here.
Creating Your Personalized Sleep Improvement Plan
Armed with knowledge, data, and context, it's time to synthesize everything into a practical, sustainable plan. A successful plan is not about making a dozen drastic changes overnight. It's a strategic, iterative process built on self-experimentation and patience.
Step 1: The Audit – Establish Your Baseline & Identify Top Disruptors
Commit to 2 Weeks of Pure Observation: Wear your tracker consistently and log your days without trying to change anything. Note sleep times, food, alcohol, stress, exercise.
Analyze: At the end of two weeks, answer key questions:
What is my average Total Sleep Time and Sleep Score?
What is my most common sleep disruptor? (e.g., long latency, frequent awakenings, low deep sleep).
Is my schedule consistent?
Are there obvious correlations? (e.g., alcohol = low score, weekend = recovery sleep).
Step 2: The Foundation – Master Sleep Hygiene (Pick 1-2 Things) Based on your audit, choose one or two foundational habits to implement for the next 3-4 weeks. These should address your biggest disruptor.
If latency is a problem: Implement a strict digital curfew 1 hour before bed.
If fragmentation is a problem: Optimize your bedroom for darkness, coolness, and quiet.
If consistency is a problem: Set a fixed wake-up time, 7 days a week.
If alcohol/caffeine is a problem: Enforce a cut-off time (e.g., no caffeine after 2 PM, no alcohol within 3 hours of bed).
Step 3: The Experiment – Test, Measure, and Refine Treat this like a science experiment.
Hypothesis: "If I stop using my phone in bed, my sleep latency will decrease by 10 minutes within two weeks."
Intervention: Charge your phone outside the bedroom for 14 nights.
Measurement: Compare the "time to fall asleep" metric from your baseline period to the intervention period.
Conclusion: Did it work? If yes, lock in that habit. If not, your disruptor might be something else (e.g., anxiety). Move on to test the next hypothesis (e.g., "If I journal for 10 minutes before bed, my latency will improve").
Step 4: The Integration – Layer in Advanced Optimizations Once foundations are solid, explore nuanced optimizations based on your goals.
For Performance: Align your training with your HRV data. Experiment with pre-sleep nutrition (e.g., a small protein snack) to see if it affects deep sleep.
For Stress Management: Incorporate a wind-down routine with meditation or breathwork. Track its effect on your nighttime HRV and RHR.
For Chronotype Alignment: Adjust light exposure. Get morning sun, and wear blue-blockers in the evening. Observe changes in your sleep consistency score.
Step 5: The Maintenance – Review and Adapt Your life is not static. Your sleep plan shouldn't be either.
Schedule a Quarterly "Sleep Review": Look at your data trends over the past 90 days. Have your baselines improved? Are new disruptors emerging?
Listen to Your Body: If you feel great, a slight dip in a metric isn't a crisis. If you feel poor, the data can help you diagnose why, even if scores look okay.
Avoid Orthosomnia: Periodically, take a break from checking the data. Go on feeling for a week. This prevents unhealthy obsession and reconnects you with your intrinsic sense of well-being.
Remember, the goal of this entire process is not to achieve a perfect 100 sleep score every night. That’s an unrealistic and counterproductive target. The goal is progress, not perfection. It’s to gradually increase the number of nights you wake up feeling genuinely restored, to have more days with steady energy and sharp focus, and to use the data as a compassionate guide to better understand and care for your body. For ongoing support and answers as you build your plan, our comprehensive FAQ is always available.
The Gut-Sleep Axis: How Digestion Influences Your Sleep Architecture
The conversation about sleep optimization is incomplete without addressing a critical, yet often overlooked, partner: the gut. A burgeoning field of research reveals a robust, bidirectional communication network known as the gut-brain axis, and it has a profound offshoot—the gut-sleep axis. Your digestive health doesn't just affect how you feel after a meal; it directly orchestrates signals that influence sleep onset, quality, and architecture. Your sleep tracker can provide the first clues that this connection needs attention.
The Vagus Nerve: The Information Superhighway: The primary physical link between your gut and your brain is the vagus nerve. This long, wandering nerve carries signals in both directions. When your gut is inflamed, imbalanced, or digesting poorly, it sends distress signals via the vagus nerve and circulating inflammatory molecules (cytokines) that can disrupt the brain's sleep-wake centers. Conversely, poor sleep increases stress hormones like cortisol, which can damage the gut lining and alter its microbial balance.
Key Mechanisms Linking Gut Health to Sleep Data:
Tryptophan and Serotonin Synthesis: Your gut is a primary site for the production of serotonin (about 90%), a neurotransmitter that is a precursor to melatonin, the sleep hormone. An unhealthy gut lining or imbalanced microbiome can impair this production chain. In your data, this may manifest as increased sleep latency (trouble falling asleep) and reduced REM sleep, which is heavily influenced by serotonin activity.
Inflammatory Signals: An unhealthy gut, often described as "leaky gut" or intestinal permeability, allows bacterial toxins (LPS) into the bloodstream, triggering systemic, low-grade inflammation. Inflammation is a known enemy of deep sleep. The body prioritizes fighting inflammation over deep restoration. Your tracker may show suppressed deep sleep (N3) percentages and an elevated resting heart rate (RHR) throughout the night, as inflammation puts the cardiovascular system under subtle stress.
Microbiome Metabolism & Circadian Rhythms: Your gut bacteria have their own daily rhythms and produce metabolites that influence sleep. For example, certain beneficial bacteria produce short-chain fatty acids (SCFAs) like butyrate, which have been shown to promote sleep. An imbalanced microbiome (dysbiosis) can produce disruptive metabolites instead. Furthermore, eating at erratic times confuses both your central circadian clock and the clocks of your gut microbes, leading to poor metabolic health and fragmented sleep.
What Your Sleep Data Might Reveal About Your Gut:
Post-Meal Tracking: Notice patterns after large, late, or heavy meals. Do you see increased restlessness, more awakenings, or a higher RHR on those nights? This is a direct sign of your body struggling with digestion instead of focusing on restoration.
Food Sensitivity Clues: You might notice that nights after consuming certain foods (e.g., gluten for some, dairy for others, high-histamine foods) are correlated with poor sleep scores, lower HRV, and more frequent awakenings. This non-invasive data can be a starting point for an elimination diet under professional guidance.
The Fiber & Fermented Food Effect: Conversely, track what happens when you have a day rich in plant fibers (prebiotics) and fermented foods (probiotics). Many report improvements in sleep continuity and subjective morning freshness, which may be reflected in slightly higher HRV and deeper sleep.
Actionable Steps to Optimize the Gut-Sleep Axis:
Establish a Firm "Kitchen Close" Time: Finish eating at least 3 hours before bedtime. This gives your gut time to do the bulk of its work before sleep systems come online.
Prioritize a Fiber-Rich Diet: Diverse plant fibers feed beneficial bacteria that produce sleep-supporting metabolites. Aim for a "rainbow" of fruits and vegetables.
Mind Your Microbiome: Incorporate probiotic-rich foods (like yogurt, kefir, sauerkraut) and consider a high-quality probiotic supplement if needed, especially after antibiotics or periods of high stress.
Hydrate Wisely: Drink plenty of water during the day, but taper off 1-2 hours before bed to minimize disruptive nighttime bathroom trips.
Use Your Data as a Guide: If you suspect a food-sleep link, conduct a mini-experiment. Remove a suspected food for 5-7 days, track your sleep, then reintroduce it and observe the data. Look for changes in deep sleep, awakenings, and RHR.
By nurturing your gut, you are, in effect, nurturing your sleep. This holistic view recognizes that the path to restorative slumber isn't just about a dark, quiet room—it's also about what you put on your plate and the health of the complex ecosystem within you. For more insights into holistic wellness strategies that encompass nutrition, sleep, and stress, our blog offers a wealth of related articles.
Longitudinal Analysis: Using Long-Term Sleep Data for Health Forecasting
One night of poor sleep is a blip. A week of disrupted sleep is a pattern. But a year or more of aggregated sleep data? That’s a powerful health forecasting tool. Longitudinal analysis—looking at trends over months and years—transforms your tracker from a daily report card into a crystal ball that can reveal insights about your long-term health trajectory, resilience, and risk factors.
Moving Beyond the Daily Score: The daily sleep score can be moody, reacting to last night's pizza or a stressful workday. Longitudinal data smooths out this noise, revealing the underlying signal of your overall health and lifestyle effectiveness.
Key Long-Term Trends to Monitor:
The Gradual Creep of Resting Heart Rate (RHR): While daily fluctuations are normal, a steady, gradual increase in your average nighttime RHR over 6-12 months is a significant biomarker. It can indicate:
Declining cardiovascular fitness.
Chronic, low-grade stress or burnout.
Onset of metabolic issues like insulin resistance.
Underlying inflammation. Seeing this trend early provides a critical window to intervene with lifestyle changes before a clinical issue manifests.
The Decline of Heart Rate Variability (HRV) Baseline: Similarly, a declining trend in your weekly or monthly HRV average is a hallmark of decreased autonomic nervous system resilience. It suggests your body's ability to handle and recover from stress is diminishing. This is a paramount metric for forecasting burnout, overtraining, and overall vitality loss. A rising HRV trend, conversely, is one of the best indicators that your health and fitness regimen is working.
Changes in Sleep Architecture with Age: It's normal for deep sleep (N3) percentage to slowly decrease with age. However, tracking this rate of change personally is more valuable than population averages. A precipitous drop in deep sleep in a short period could be linked to lifestyle factors (new high-stress job, poor diet) or health changes (hormonal shifts, pain) that are addressable.
Consistency as a Lifeline: Your long-term "sleep consistency" graph is a direct reflection of your lifestyle stability. Periods of high variability often correlate with life stressors, travel, or unhealthy habits. Long stretches of high consistency are strongly associated with better mental health, stable energy, and improved metabolic markers.
Forecasting and Prevention: The Real-World Application
Illness Prediction: Many users report their wearable signals illness 24-48 hours before symptoms appear, via a sustained RHR increase and HRV drop. Over the long term, you can identify your personal "sick window" parameters and take proactive rest and immune support.
Mental Health Monitoring: Periods of anxiety or depression are almost always mirrored in sleep data: reduced total sleep, fragmented architecture, lower HRV, and elevated RHR. Observing a return to baseline metrics can be an objective sign of recovery, supplementing subjective feeling.
Fitness & Training Efficacy: Did that new training program actually improve your recovery capacity? Look at your 3-month HRV and RHR trends. If HRV is trending up and RHR down, your body is adapting positively. If not, the program may be too intense or not aligned with your recovery needs.
How to Conduct Your Own Longitudinal Review:
Use the "Trends" or "Insights" Tab: Most apps provide weekly, monthly, and yearly overviews. Spend time here quarterly.
Ask Strategic Questions:
"How has my average RHR changed since this time last year?"
"What lifestyle period (e.g., marathon training, new job, dietary change) corresponds to that major dip or peak in my HRV graph?"
"Is my deep sleep % declining faster than expected for my age?"
Correlate with Life Events: Overlay your data with a personal timeline. This turns abstract graphs into a meaningful health biography, showing you the tangible impact of life choices on your physiology.
This long-view approach embodies true preventative health. It’s not about diagnosing disease, but about monitoring your foundational health metrics to ensure you are moving in a resilient, vibrant direction. It empowers you to make course corrections with data that is deeply personal and longitudinally validated. This commitment to long-term wellness is a core part of our vision and mission at Oxyzen.
Comparative Analysis: Rings vs. Watches vs. Bedside Trackers
The market offers a plethora of devices to track your sleep, each with distinct advantages, limitations, and ideal users. Choosing the right tool is crucial, as the device itself can influence data accuracy, comfort, and consistency. Let's compare the three main form factors: smart rings, smartwatches, and bedside/non-wearable trackers.
Smart Rings (e.g., Oura, Oxyzen):
How They Work: Fit snugly on your finger, using LEDs (PPG) to measure heart rate, HRV, and blood oxygen from the capillaries in your finger. They use accelerometers for movement and temperature sensors.
Strengths:
Comfort & Unobtrusiveness: The biggest advantage. They are lightweight, don't interfere with sleep positions, and are easy to forget you're wearing. This promotes consistent use.
Optimal Sensor Placement: The finger is a rich source of pulsatile blood flow, often yielding very strong PPG signals for heart rate and HRV.
Battery Life: Typically lasts 4-7 days, reducing charging hassle and eliminating the "dead night" where you forget to charge.
Temperature Tracking: Excellent for continuous body temperature trends due to close skin contact and placement on a finger, which is a good proxy for peripheral temperature changes linked to circadian rhythm.
Considerations:
Limited Daytime Smart Features: Primarily focused on health metrics, not notifications, calls, or apps.
Sizing is Critical: Must fit properly for accurate data.
Can Interfere with Certain Activities: Manual labor, heavy weightlifting, or certain sports may require removal.
Ideal For: The sleep-focused user who prioritizes comfort, consistent wear, and in-depth biometrics (HRV, temperature) over smart notifications.
Smartwatches (e.g., Apple Watch, Fitbit, Garmin):
How They Work: Use wrist-based PPG, accelerometers, and sometimes skin temperature sensors. Newer models include advanced health sensors.
Strengths:
Multifunctionality: A powerful all-in-one device for fitness, communication, apps, and sleep.
Advanced Fitness Tracking: Often superior for GPS, workout tracking, and sport-specific metrics.
Considerations:
Comfort & Consistency: Some find watches bulky to sleep in. You must remember to put it on at night, which can lead to missed data.
Battery Life: Often requires daily or every-other-day charging, increasing the chance of a missed night.
Wrist Placement Limitations: The wrist is more prone to motion artifacts (data noise from movement). The "wrist flick" can sometimes be confused with heartbeats. Temperature sensing from the wrist can be less stable than from the finger or core.
Ideal For: The user who wants a comprehensive daytime smart device and is willing to manage charging for sleep tracking, or the athlete who deeply integrates fitness and sleep data within one brand's ecosystem.
How They Work: These sit under your mattress, on your bedside table, or use contactless radar/sonar to detect movement, breathing, and heart rate.
Strengths:
Zero Wearable Hassle: Nothing to wear, charge daily, or remember. Ideal for those who can't tolerate wearables.
Partner-Friendly: Tracks sleep without requiring both individuals to wear a device.
Can Detect Breathing Disturbances: Some are very good at identifying apnea-like patterns via detailed movement and breathing analysis.
Considerations:
Limited Biometric Depth: Cannot measure HRV with the same accuracy as a PPG sensor on the body. No blood oxygen (SpO2) or precise temperature data.
User Identification: May struggle to differentiate between users in a shared bed.
Only Tracks in Bed: Provides no daytime activity or recovery data, missing the critical holistic picture.
Ideal For: Individuals or couples who want basic sleep staging (awake/light/deep) and consistency data without any wearable commitment, or as a supplemental tool.
The Verdict: There is no single "best" device. The choice is deeply personal:
Choose a smart ring for maximum sleep-focused comfort, biometric depth, and seamless 24/7 wear.
Choose a smartwatch if you value a multifunctional device and live within its ecosystem, prioritizing daytime features.
Choose a bedside tracker for simplicity and zero wearability concerns, accepting less granular biometric data.
The most important factor is consistency. The best device is the one you will wear or use every single night. For a detailed comparison and to understand how Oxyzen's ring form factor is engineered for optimal sleep insight, you can discover how Oxyzen works and explore our FAQ for technical specifics.
Case Studies: Real-World Examples of Sleep Data Transformation
Theory and data become truly compelling when applied to real life. These anonymized case studies illustrate how individuals used sleep pattern analysis to diagnose hidden issues, optimize performance, and transform their well-being. They showcase the journey from confusing data to actionable insight.
Case Study 1: The "Healthy" Executive with Hidden Fatigue
Profile: Mark, 42, a finance executive. Exercised regularly, ate well, but constantly felt "wired but tired." He assumed it was just his high-pressure job.
The Data (First Month): His sleep tracker showed a respectable 7.5-hour average. However, his HRV was chronically low (bottom 10th percentile for his demographic), his RHR was trending up, and his deep sleep was consistently below 15%. His SpO2 graph, which he'd ignored, showed frequent, shallow dips.
The Investigation: The low HRV/high RHR pointed to chronic sympathetic overdrive. The low deep sleep suggested inadequate physical recovery. The SpO2 dips prompted him to listen to his wife's comments about his loud snoring and gasping.
The Intervention & Outcome: Mark saw a sleep specialist. A home sleep study confirmed moderate Obstructive Sleep Apnea. He began using a mandibular advancement device. Within two months, his data transformed: Deep sleep increased to 22%, RHR dropped by 8 bpm, and his HRV climbed into the average range. Subjectively, his daytime fatigue vanished, and his workout recovery improved dramatically. The data provided the objective proof he needed to seek a diagnosis he had dismissed for years.
Case Study 2: The Overtraining Athlete
Profile: Lena, 29, a dedicated amateur marathoner. She followed a rigorous training plan but was seeing declining performance and persistent aches.
The Data: She tracked her workouts meticulously but hadn't connected them to sleep. Reviewing her trends, she saw a clear pattern: the day after high-intensity interval sessions or long runs, her nighttime HRV would plummet and her RHR would spike, taking 2-3 days to recover. Her deep sleep was also suppressed on these nights.
The Investigation: The data was a textbook sign of inadequate recovery. Her body was in a constant state of inflammatory stress, never fully rebounding before the next hard session.
The Intervention & Outcome: Using her HRV as a guide, Lena switched from a rigid, pre-set plan to a flexible, HRV-informed schedule. On mornings with low HRV, she would swap a speed workout for an easy zone-2 run or a full rest day. She also prioritized post-workout nutrition and added 15 minutes to her bedtime. After 8 weeks, her average HRV trend was steadily rising, her training injuries ceased, and she set a new personal best. The data helped her train smarter, not just harder.
Case Study 3: The New Parent Managing Survival
Profile: David and Sofia, new parents of a 3-month-old. Both were exhausted, but Sofia, who was breastfeeding, was experiencing extreme brain fog and mood swings.
The Data: They used a wearable with nap detection. Sofia's data showed her total sleep was a chaotic 5-7 hours, but fragmented into dozens of short segments. Her "longest uninterrupted stretch" was never more than 2 hours. David, who handled one bottle feed, had a 4-hour block. Sofia's HRV was in the tank.
The Investigation: The data objectively showed the disparity in sleep consolidation, validating Sofia's feeling that her exhaustion was different. It wasn't just about total hours; it was about the complete lack of sustained, restorative sleep cycles.
The Intervention & Outcome: Using the data as a neutral fact, they reorganized their nights. They implemented a "shift schedule" where David would handle the first feed after a pumped bottle, guaranteeing Sofia one solid 4-5 hour block of uninterrupted sleep from 9 PM to 2 AM. Her data showed this block was deep and stable. This single change improved her HRV, mood, and cognitive function significantly, even though her total sleep didn't increase massively. The data helped them allocate a scarce resource (uninterrupted sleep) strategically.
The Common Thread: In each case, the individuals moved from a place of vague suffering or stalled progress to targeted action. Their trackers provided the objective evidence that cut through assumptions ("I'm just getting older," "I need to train harder," "This is just what parenthood is"). The data empowered them to have informed conversations with professionals, partners, and themselves. For more inspiring stories of transformation, browse our collection of real customer reviews and experiences.