Sleep Score Components: Breaking Down the Numbers
Common components include total sleep time, sleep efficiency (time asleep vs. in bed), deep/REM sleep, and restlessness.
Common components include total sleep time, sleep efficiency (time asleep vs. in bed), deep/REM sleep, and restlessness.
You wake up feeling groggy. Your smart ring says you slept for eight hours and gives you a “Sleep Score” of 78. But what does that mean? Is 78 good? What was missing? Was it restless sleep, too little deep sleep, or did you toss and turn too much? For years, we’ve reduced the complex, restorative miracle of sleep to a single, often mystifying, number.
That’s changing. Today’s advanced wellness wearables, like the Oxyzen smart ring, are moving beyond simplistic summaries. They provide a detailed biochemical and physiological report card on your night. Your Sleep Score is no longer a destination; it’s the starting point for a fascinating journey into the inner workings of your body at rest. It’s a composite metric built from distinct, scientifically-grounded pillars, each telling a unique part of your recovery story.
This deep dive is designed to demystify that number. We’ll dissect every component that feeds into your modern Sleep Score, moving beyond the “what” to the powerful “so what.” By understanding the levers of your sleep quality—from heart rate variability to body temperature fluctuations—you gain unprecedented agency over your energy, cognitive function, and long-term health. This isn’t just about sleeping better; it’s about unlocking a more optimized, resilient, and vibrant version of yourself, every single day.

Think of your Sleep Score not as a grade, but as the final blueprint of a building. The number itself is the completed structure, but its integrity, functionality, and value are determined by the quality of its foundational pillars. In the world of physiological tracking, these pillars are the core biometric signals your body emits throughout the night. Unlike basic trackers that only measure movement, advanced devices synthesize data from multiple sources to create a multidimensional picture of your sleep.
Modern algorithms, like those powering the Oxyzen smart ring, consider a symphony of biological data. This includes the duration you’re asleep (Total Sleep Time), the structural progression through sleep stages (Sleep Staging), the stability and calmness of your sleep (Restlessness), the timing of your sleep in relation to your circadian rhythm (Sleep Timing), and key markers of your nervous system’s recovery state (like Nighttime Heart Rate and Heart Rate Variability). Some systems even integrate environmental factors like room temperature or noise, though these are often contextual.
The true magic lies in the weighting and interpretation. Not all components are created equal. For instance, consistently short sleep duration can be more detrimental to next-day performance than a night with slightly less deep sleep. A great Sleep Score, therefore, represents a harmonious balance across all these domains. It indicates that your body successfully navigated the critical processes of memory consolidation, hormonal regulation, tissue repair, and metabolic reset.
As we peel back the layers on each component in the following sections, you’ll begin to see your sleep not as a passive state, but as an active, measurable, and improvable pillar of your health. For a broader look at how this technology fits into a holistic wellness strategy, our blog features several articles on integrating data into daily life.
If sleep architecture is the blueprint, Total Sleep Time (TST) is the total square footage. It’s the most fundamental component—the raw material from which quality is built. You simply cannot have good sleep without an adequate quantity of it. This metric is straightforward: it’s the total amount of time you spend actually asleep between bedtime and wake time, excluding periods of lying awake.
The National Sleep Foundation and countless studies provide clear guidelines: most adults require 7-9 hours per night. Consistently clocking less than 7 hours is linked to a compromised immune system, impaired cognitive function (equivalent to being legally intoxicated), increased risk for chronic conditions like heart disease and diabetes, and weight gain. It’s the single most impactful lever on your Sleep Score and your health.
But it’s not just about hitting a bare minimum. There’s a concept of “sleep opportunity”—the time you allot yourself in bed to achieve those 7-9 hours. If you’re in bed for 8 hours but your TST is only 6.5, that reveals a separate issue (likely tied to efficiency or restlessness, which we’ll cover later). The goal is to align your sleep opportunity with your personal need, allowing your body to complete all the necessary cycles.
A storytelling example: Consider Alex, a project manager who prides himself on thriving on 6 hours of sleep. His Oxyzen ring consistently shows a TST of 5 hours and 45 minutes and a low Sleep Score. He feels “fine,” but notices he’s always reaching for a third coffee, his afternoon focus plummets, and he’s gained stubborn weight. By prioritizing a 7.5-hour sleep opportunity for two weeks, his TST increased to 7 hours. His Sleep Score jumped, and subjectively, his energy stabilized, his cravings diminished, and his mental clarity returned. The data gave him the objective proof he needed to change a deeply ingrained habit.
Tracking TST is the essential first step. It creates awareness and accountability. It answers the basic question: “Did I give my body enough time to do its essential nighttime work?” Without a solid foundation of time, the other, more nuanced components of sleep quality have little chance to shine.
Within your Total Sleep Time unfolds a meticulously organized sequence of brain activity: the sleep stages. Think of this not as a flat line of “unconsciousness,” but as a dynamic journey through different physiological states, each with a unique purpose. Your Sleep Score heavily weighs how well you cycle through these stages. There are four primary stages, now classified as N1, N2, N3 (collectively Non-REM), and REM sleep.
A healthy sleep architecture cycles through these stages every 90-120 minutes, with the proportion of deep sleep decreasing and REM sleep increasing as the night progresses. A high Sleep Score reflects not just the presence of these stages, but their balanced, cyclical progression.
Disruptions to this choreography—frequent awakenings that reset the cycle, a lack of deep sleep, or truncated REM—are red flags. For example, high alcohol consumption is notorious for suppressing REM sleep early in the night, leading to a rebound later that fragments sleep. Devices like the Oxyzen ring use heart rate variability, movement, and detailed pulse oximetry data to estimate these stages, giving you a map of your nightly journey. Seeing this breakdown empowers you to connect lifestyle choices (like evening exercise, caffeine timing, or stress) to their direct impact on your sleep architecture.
You go to bed at 10:30 PM and wake up at 6:30 AM. That’s 8 hours in bed—a full sleep opportunity. But if you spent 90 minutes of that tossing, turning, and watching the clock, your actual sleep time was only 6.5 hours. This discrepancy is captured by your Sleep Efficiency score, a critical and often overlooked component of your overall Sleep Score.
Sleep Efficiency is calculated as: (Total Sleep Time / Total Time in Bed) x 100.
An optimal efficiency score is 85% or higher. For our example above: (6.5 hours / 8 hours) x 100 = 81.25%. This indicates room for improvement. A score consistently below 85% suggests you’re either not spending enough continuous time in bed asleep, or you’re spending too much time in bed trying to sleep, which can create an unhealthy mental association between your bed and anxiety.
High sleep efficiency means you’re falling asleep relatively quickly (within 15-20 minutes) and experiencing minimal prolonged awakenings during the night. It’s a sign of good “sleep hygiene” and a strong sleep drive. Low efficiency, on the other hand, can be a symptom of various issues: an inconsistent sleep schedule, poor bedroom environment (too warm, too bright), caffeine or alcohol too late in the day, or untreated sleep disorders like insomnia or sleep apnea.
Improving sleep efficiency is one of the most direct ways to boost your Sleep Score without necessarily going to bed earlier. It’s about optimizing the sleep you attempt to get. Strategies include:
Closely tied to efficiency are the metrics of Restlessness and Awakenings. While you expect some natural movement between sleep cycles, excessive restlessness and frequent conscious awakenings are the silent saboteurs of deep, restorative sleep. They fragment your sleep architecture, preventing you from spending adequate, uninterrupted time in the crucial deep and REM stages.
Restlessness is typically measured by the frequency and intensity of your movements during the night. A certain amount is normal—shifting position a few times per hour. However, a high restlessness score indicates constant, minor movements that can keep your brain in a lighter state of sleep. Causes can range from an uncomfortable mattress or too-warm bedding, to restless leg syndrome, stress, or even dietary triggers.
Awakenings are exactly what they sound like: brief periods where you become consciously awake. You might not remember them in the morning, but your biometric data does. More than a few brief awakenings per night can significantly impact your sleep continuity. Common culprits include environmental noise (a partner snoring, street sounds), bathroom trips (often linked to evening fluid intake), pain, or sleep apnea events where your breathing momentarily stops, triggering a micro-arousal.
Your Sleep Score algorithm penalizes significant restlessness and awakenings because they represent a failure to achieve stable, continuous sleep. The body’s most reparative processes require long, undisturbed windows to operate at full capacity. Imagine trying to have an important, complex conversation with someone who keeps hanging up the phone every few minutes. The core message gets lost.
Tracking these metrics provides invaluable clues. If you see a night with high restlessness, you can audit your evening: Was your room cooler than usual? Did you have a spicy or heavy meal too late? Did you experience high stress before bed? By cross-referencing this data with your daily journal, you become a detective of your own sleep, identifying and eliminating the thieves that steal your rest. This granular level of insight is at the heart of what makes a detailed Sleep Score so powerful, a principle that guides the sensor technology and analysis at Oxyzen.
You could get 8 hours of sleep, but if it’s from 4:00 AM to 12:00 PM, you might still feel groggy and out of sync. This is the domain of Sleep Timing and Consistency, components that measure when you sleep and how regular your schedule is. They speak directly to your circadian rhythm—your body’s internal 24-hour master clock that regulates sleep-wake cycles, hormone release (like cortisol and melatonin), and even body temperature.
Sleep Timing evaluates the alignment of your sleep window with your personal circadian rhythm and, to a degree, with societal daylight norms. Going to bed and waking up at roughly the same time each day, even on weekends, strengthens this rhythm. A large, consistent misalignment—known as social jetlag (e.g., staying up late and sleeping in on weekends)—can drag down your Sleep Score. It’s like giving your body persistent, low-grade jetlag, which is associated with metabolic dysregulation and mental fogginess.
Consistency is the metric of routine. It measures the standard deviation of your bedtime and wake time. A low consistency score means your schedule is all over the place. A high score means you’re remarkably regular. Consistency is king for circadian health. When your body can predict when sleep is coming, it can optimally time the release of melatonin to make you sleepy and cortisol to help you wake up feeling alert.
Why does this matter so much for your score? Because disordered timing forces your body to fight its own biology. You might fall asleep later but still need to wake early for work, truncating your sleep. Or, you might sleep in on Sunday, making it impossible to fall asleep at a reasonable hour on Sunday night, sabotaging your Monday. This creates a vicious cycle of poor sleep and fatigue.
By tracking your timing, you can find your natural “chronotype” (are you a night owl or an early bird?) and build a realistic, sustainable schedule around it. The goal isn’t perfection, but progression toward greater regularity. Locking in a consistent sleep-wake schedule is perhaps the single most effective free tool you have to improve not just your Sleep Score, but your overall daily energy and health. It’s a core principle woven into the personalized insights provided by devices designed with a holistic vision for wellness, much like the philosophy you can read about in our story.
Your heart doesn’t check out when you sleep. In fact, its behavior during the night is a profound window into your cardiovascular fitness, recovery status, and overall stress load. Nighttime Heart Rate (HR) is a key biometric feeding into your Sleep Score. During quality sleep, your heart rate should dip significantly below your daytime resting average—typically by 10-30 beats per minute (BPM). This “nocturnal dip” is a sign of a healthy, relaxed nervous system.
A lower sleeping heart rate generally indicates efficient cardiovascular function and strong parasympathetic (“rest and digest”) nervous system activity. Your heart doesn’t have to work as hard to supply your body with oxygen. Conversely, an elevated nighttime heart rate is a glaring red flag. It suggests your body is under some form of strain, forcing your sympathetic (“fight or flight”) system to remain partially engaged.
Common reasons for a high nighttime HR include:
Your Sleep Score algorithm looks for that characteristic dip and its depth. A flat or elevated heart rate curve throughout the night is a strong negative indicator of recovery quality. It tells the story of a body that never fully shifted into its most restorative state. By monitoring this trend over time, you can see the direct impact of a hard workout, a stressful day, or positive changes like improved hydration or meditation. It turns abstract concepts like “recovery” into a clear, nightly graph, allowing you to make smarter decisions about your next day’s activities.
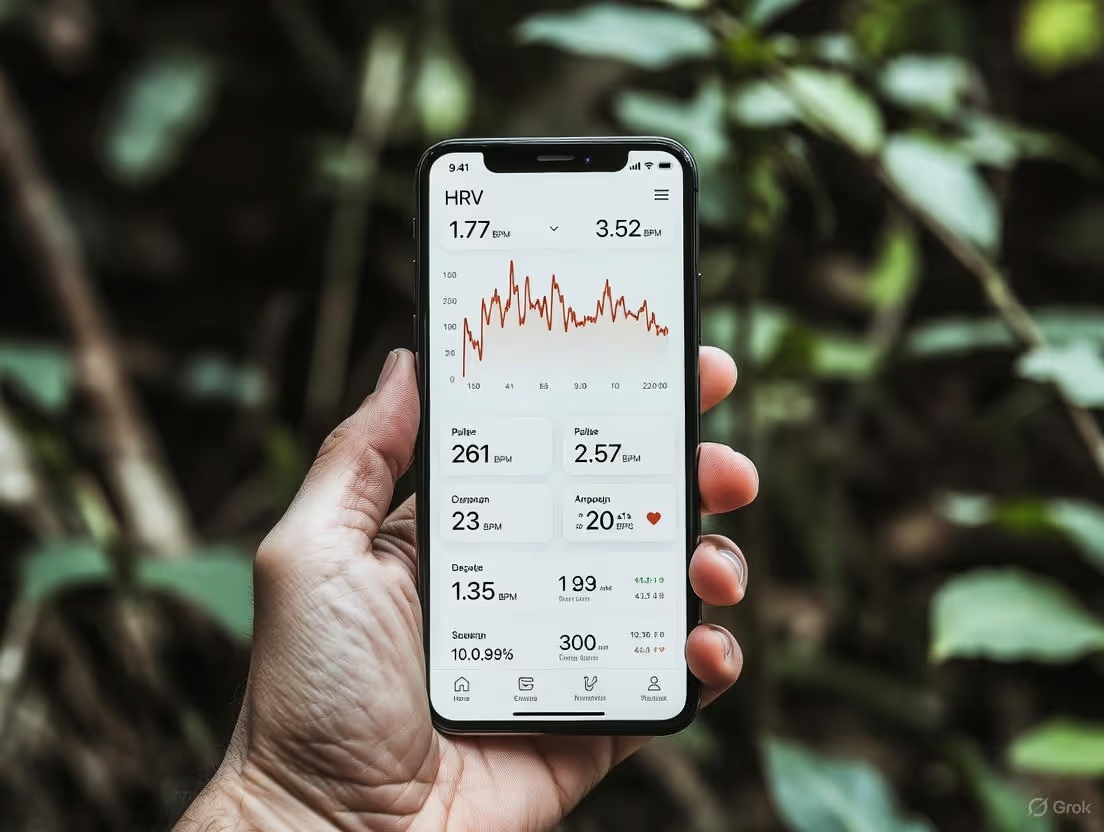
If Nighttime Heart Rate is the volume of the music, Heart Rate Variability (HRV) is the complex, nuanced rhythm. It is arguably the most sophisticated and insightful component feeding into a modern Sleep Score. HRV measures the subtle, millisecond variations in the time intervals between each heartbeat. Counterintuitively, a higher HRV is better. It indicates a robust, adaptable autonomic nervous system.
Here’s the science: Your heart doesn’t beat with metronomic precision. The time between beats is constantly fluctuating. When you inhale, your heart rate speeds up slightly; when you exhale, it slows down. This is mediated by a tug-of-war between the sympathetic (“gas pedal”) and parasympathetic (“brake pedal”) nervous systems. High HRV means your body can swiftly and efficiently switch between states—ramping up to meet a challenge and calming down effectively to recover. It’s a marker of resilience, fitness, and good health.
During sleep, and particularly during deep sleep, your parasympathetic system should dominate, leading to a natural rise in HRV. A high nighttime HRV score is a golden stamp of effective recovery. It means your body is successfully down-regulating stress, repairing tissues, and consolidating memory.
A low or dropping nighttime HRV, however, is a powerful warning sign. It suggests your nervous system is stuck in a sympathetically-driven state, even at rest. This can be due to:
By integrating HRV into your Sleep Score, the algorithm assesses not just the state of your sleep, but the functional outcome of that sleep on your nervous system. Are you waking up resilient and adaptable, or fragile and stressed? Tracking your HRV trend over weeks and months provides unparalleled insight into your body’s response to your lifestyle. It’s the ultimate biofeedback tool, and seeing it improve is one of the most rewarding signs that your efforts to optimize sleep are working. Many users find that exploring customer testimonials helps them understand the real-world impact of tracking nuanced metrics like HRV over time.
While your heart tells one story, your breath tells another. Two of the most advanced metrics now included in comprehensive Sleep Scores are Respiratory Rate (RR) and Blood Oxygen Saturation (SpO2). These “vital signs” of sleep offer a direct look at the fundamental process of respiration and how well your body is oxygenating itself overnight.
Nighttime Respiratory Rate is the number of breaths you take per minute while asleep. For most adults, a normal sleeping respiratory rate is between 12-20 breaths per minute. It tends to be very stable for a given individual. Significant deviations from your personal baseline can be meaningful. A persistently elevated RR can indicate stress, fever, heart issues, or the body working harder due to sleep apnea. Tracking this provides a subtle, early-warning sign that something may be amiss with your health or recovery.
Nocturnal Blood Oxygen (SpO2) is even more critical. It measures the percentage of oxygen-carrying hemoglobin in your blood. While awake and healthy, it should be 95-100%. During sleep, a slight dip of a few percentage points is normal. However, frequent or significant drops (below 90%, known as desaturations) are a primary indicator of Sleep Apnea, a serious disorder where breathing repeatedly stops and starts.
Sleep apnea fragments sleep (causing awakenings and restlessness) and puts immense strain on the cardiovascular system (elevating heart rate and lowering HRV). It is a major destroyer of sleep quality and overall health. Before advanced wearables, detecting it often required an expensive and uncomfortable lab sleep study.
Now, by monitoring SpO2 throughout the night, devices can flag potential issues. The Sleep Score algorithm looks for stability. A night with numerous, sharp dips in blood oxygen will result in a markedly lower score, as it indicates profoundly disrupted and unhealthy sleep, even if the sleeper is completely unaware.
Including these metrics transforms your Sleep Score from a measure of “how well you slept” to a more clinical assessment of “how healthily you breathed while asleep.” It empowers users with knowledge that was previously inaccessible, potentially prompting life-saving conversations with healthcare providers. This commitment to providing deeper, health-critical insights is part of the mission you can learn about on our about us page.
One of your body’s most potent sleep signals isn't something you see or hear—it's a feeling. The subtle ebb and flow of your core body temperature is a master regulator of your circadian rhythm and a critical, yet often invisible, component of sleep quality. Advanced wearables that track this metric, typically via a sensor on the inner wrist or finger (an ideal location due to its rich vascular supply), add a profound layer of understanding to your Sleep Score.
Your body temperature isn't constant. It follows a predictable daily rhythm: it's highest in the late afternoon and begins to drop in the evening, reaching its lowest point in the middle of the night. This cooling process is not a passive side effect of sleep; it's an active driver of sleepiness. The drop in core temperature signals the brain to release melatonin, the "hormone of darkness," preparing your body for rest. A steeper, more pronounced decline in the evening is strongly correlated with faster sleep onset and more stable sleep.
Conversely, a blunted or disrupted temperature rhythm sabotages sleep. If your core temperature is too high when you hit the pillow, your body is physiologically confused—it's still in "daytime" mode. Common culprits include:
In your sleep data, you’re not looking for a single number but a curve. A healthy sleep temperature curve shows a clear downward trend as you fall asleep, a stable low plateau during the night, and a steady rise toward morning, helping you wake naturally. The Sleep Score algorithm analyzes this trajectory. A flat or elevated curve suggests your body couldn't execute its natural cooling protocol, indicating poor sleep preparation and fragmented rest.
By tracking your temperature trend, you gain a powerful tool for bio-hacking your sleep environment and routine. You might discover that keeping your bedroom at 67°F instead of 70°F, wearing breathable pajamas, or shifting your workout earlier makes a measurable difference in your temperature curve and, consequently, your overall Sleep Score and feeling of restfulness.
What you consume in the hours before bed doesn't just vanish; it becomes active background processes your body must manage instead of devoting full resources to restoration. This component of your Sleep Score is often inferred from disruptions in other metrics (elevated HR, low HRV, restlessness), but understanding the direct links is key to turning data into action.
Alcohol: The Deceptive Sedative. Alcohol is perhaps the most misunderstood sleep disruptor. While it can indeed help you fall asleep faster by sedating the brain, it devastates sleep architecture. It suppresses REM sleep in the first half of the night, often leading to a REM rebound later that is accompanied by vivid dreams, nightmares, and awakenings. It also relaxes the muscles of the upper airway, worsening snoring and sleep apnea (visible in SpO2 dips), and is a diuretic, leading to disruptive bathroom trips. Your data will often show a deceptively good "Time Asleep" but terrible scores for Restlessness, Deep/REM sleep balance, and HRV.
Caffeine: The Long Shadow. Caffeine has a half-life of 5-6 hours. A coffee at 3 PM means a quarter of that caffeine is still in your system at 9 PM. It blocks adenosine receptors, the neurotransmitters that build up sleep pressure. This can manifest as difficulty falling asleep (increased sleep onset latency), reduced sleep efficiency, and lighter, more fragmented sleep. Even if you fall asleep, you may miss out on the deepest stages of restorative sleep.
Late, Heavy, or Spicy Meals: Digesting a large meal requires energy, raises core body temperature, and can cause discomfort or acid reflux when lying down. This translates directly to elevated nighttime heart rate, lower HRV, and increased restlessness as your body prioritizes digestion over deep recovery.
Hydration (and Dehydration): A delicate balance is required. Being dehydrated thickens the blood, forcing the heart to work harder (higher HR). Conversely, drinking a large volume of water right before bed guarantees sleep fragmentation via nocturia (bathroom trips). The goal is to be well-hydrated throughout the day and taper fluid intake 1-2 hours before bedtime.
Your Sleep Score acts as a sensitive audit tool. A surprisingly low score after a night out with drinks and a late dinner isn't random—it's a precise physiological report card. By observing how your score plummets after certain choices, you can make more informed, conscious decisions, understanding that the short-term gratification comes at a direct, measurable cost to your recovery.
Your body doesn't sleep in a vacuum. It is in constant dialogue with its immediate surroundings. The environmental factors of your bedroom—its light, sound, and climate—directly influence the biometrics that determine your Sleep Score. Optimizing these is non-negotiable for high-quality rest.
Light: The Primary Zeitgeber. Light is the most powerful cue for your circadian rhythm. Even small amounts of blue light from devices (phones, tablets, TVs) in the evening can suppress melatonin production, delaying sleep onset and confusing your internal clock. During sleep, ambient light from streetlights or charging LEDs can penetrate your eyelids and reduce sleep depth. Your Sleep Score benefits from absolute darkness. This means blackout curtains, covering or removing electronic lights, and using eye masks if necessary. Prioritizing dim, warm light in the evening prepares your biology for sleep.
Sound: The Arousal Trigger. Your brain remains alert to sounds as a survival mechanism. Sudden noises—a door slam, a snoring partner, a barking dog—can cause micro-arousals or full awakenings, fragmenting your sleep cycle even if you don't remember them. This directly harms your Restlessness and Sleep Efficiency scores. Consistent, low-volume white or pink noise can be a powerful tool to mask disruptive sounds, creating an auditory blanket that leads to more stable sleep architecture.
Temperature: The Goldilocks Zone. As discussed, your body needs to cool. A bedroom that is too warm is one of the most common environmental sleep disruptors. The consensus among sleep scientists is that a cool room, around 65-68°F (18-20°C), is optimal for most people. This facilitates the core temperature drop necessary for sleep initiation and maintenance. A room that's too cold can also be disruptive, causing discomfort. The data from your wearable can help you find your personal ideal setting.
Air Quality & Allergens: Often overlooked, poor air quality or allergens (dust mites, pet dander) can cause subtle inflammation and nasal congestion, potentially worsening breathing during sleep and increasing restlessness.
Think of your sleep environment as the laboratory where the experiment of recovery takes place. You are the scientist. By systematically controlling these variables—darkening, quieting, and cooling your space—you create the conditions under which your body can execute its natural sleep programs flawlessly, leading to higher, more consistent Sleep Scores. For more ideas on crafting the perfect sleep sanctuary, our blog has dedicated guides on environment optimization.
Your sleep dashboard may show biometrics, but the numbers are often telling an emotional story. The bridge between your daytime psychological state and your nighttime physiological data is robust and bidirectional. High stress and unmanaged anxiety are among the most potent thieves of sleep quality, and they leave clear fingerprints on your Sleep Score.
The mechanism is rooted in biology. When you experience stress or anxiety, your body activates the sympathetic nervous system and releases cortisol. This is the "fight or flight" response, designed for acute danger. In the modern world, this response is often chronically triggered by work deadlines, financial worries, or social tensions. Elevated evening cortisol is the enemy of melatonin. It keeps your heart rate elevated, your HRV low, and your mind racing—a state entirely antithetical to sleep.
In your sleep data, this manifests as:
The reverse is also true: poor sleep lowers your resilience to stress, creating a vicious cycle. A night of fragmented sleep leads to higher daytime cortisol reactivity, making you more irritable and anxious, which then sabotages the next night's sleep.
Breaking this cycle is critical. Your Sleep Score can be the canary in the coal mine, alerting you to accumulating stress before you consciously acknowledge it. Observing a dip in your score can prompt proactive stress-management techniques:
By viewing your Sleep Score through the lens of the mind-body connection, you move from merely tracking sleep to managing your overall emotional and physiological resilience.
You now understand the individual players, but how does the game produce a final score? The calculation and weighting of Sleep Score components are the proprietary secret sauce of each wellness platform, but the general principles follow a hierarchy rooted in sleep science. It’s not a simple average; it’s a weighted model that prioritizes the factors most critical to health and next-day functioning.
While exact formulas vary, a typical advanced algorithm might weigh components something like this:
It’s also crucial to understand personal baselining. A good algorithm doesn't just compare you to a population average; it learns your personal norms over a few weeks. Your "good" HRV might be someone else's "low." The score increasingly reflects deviations from your own baseline, making it more personally meaningful. A drop of 10 points for you is a signal worth investigating, regardless of the absolute number.
This complex, multi-factor analysis is what separates a sophisticated score from a simple step counter. It aims to synthesize the quantitative (how long, how stable) with the qualitative (how restorative) into a single, actionable metric. Understanding this weighting helps you prioritize: fixing chronically short sleep will yield a bigger score improvement than obsessing over a 5% shift in deep sleep percentage.
A number, no matter how sophisticated, is useless without interpretation and action. The true value of your Sleep Score lies not in the nightly digit, but in the trends, correlations, and insights you derive from it over time. This transforms you from a passive observer into an active participant in your own well-being. Here’s a framework for turning data into change.
Step 1: Look Beyond the Single Score. Don't fixate on one night's 75 vs. 85. Instead, look at your weekly average and trend line. Is your average slowly climbing or declining? A downward trend over a week is a more significant signal than a single "bad" night.
Step 2: Drill Down to the Component Level. When your score is low or drops, immediately investigate the contributing factors. Did the breakdown show poor Efficiency, low Deep Sleep, or elevated HR? This pinpoints the system that failed. For example:
Step 3: Correlate with Lifestyle Tags. Use the journal or tagging feature in your app. Tag days with "late workout," "alcohol," "high stress," or "caffeine after 2 PM." After a few weeks, you can run your own experiments. Filter your data to see: "What is my average Sleep Score on nights after I have a drink vs. nights I don't?" The data will give you a personal, irrefutable answer.
Step 4: Implement One Change at a Time. You cannot optimize all levers at once. If your data shows poor efficiency and late timing, first focus on a consistent wake-up time for two weeks. Once that's locked in, then work on a earlier bedtime. This methodical approach shows you the specific impact of each intervention.
Step 5: Celebrate the Positive Reinforcements. The brain responds to rewards. When you see your score improve after a week of better habits, that positive feedback is powerful motivation. Share progress with a partner or a community. This turns a chore into a game of bio-hacking.
The goal is not to chase a perfect 100 every night—that's neither realistic nor healthy. The goal is to understand your body's language, identify the lifestyle factors that serve you or sabotage you, and use that knowledge to build sustainable habits for better rest and resilience. For specific questions on interpreting your data or using advanced features, our comprehensive FAQ is a valuable resource.
As with any powerful tool, there are pitfalls. Misinterpreting your Sleep Score can lead to unnecessary anxiety ("sleep anxiety" or orthosomnia) or cause you to miss important signals. Navigating these nuances is key to a healthy relationship with your data.
Pitfall 1: Obsessing Over the Absolute Number. A score of 82 is not inherently "bad" if your personal baseline is 85. Conversely, a 90 might be low for you if you typically average 95. Focus on deviations from your own norm, not a mythical ideal. The score is a relative gauge, not an absolute judgment.
Pitfall 2: Equating Sleep Score with How You Feel. Sometimes, you'll score an 88 but feel groggy (sleep inertia). Other times, you'll score a 78 but feel great. This disconnect is important data! If you feel good with a "low" score, it could mean the algorithm is weighting something (like short duration) that your body is currently coping with. If you feel bad with a "high" score, it could indicate an unmet need not captured by the metrics (e.g., sleep quality despite an ongoing infection). Always use subjective feeling as the ultimate validator.
Pitfall 3: Over-Interpreting Single-Night Stage Data. The accuracy of sleep stage tracking (Deep, REM, Light) from wearables, while impressive, is not clinical-grade. It's estimated to be about 80-90% accurate compared to a lab polysomnogram. A one-night dip in REM sleep might be a measurement blip, not a biological reality. Look for stage trends over weeks, not night-to-night fluctuations.
Pitfall 4: Ignoring Context for "Bad" Scores. A period of low scores isn't a failure; it's information. It could coincide with a tough training block (intentional strain), a stressful work project, traveling across time zones, or fighting off a cold. In these contexts, a lower score reflects your body doing exactly what it should be doing—allocating resources to meet a challenge. The key is to recognize this and not add self-criticism to your stress load.
Pitfall 5: Letting Data Increase Pre-Sleep Anxiety. Checking your score immediately upon waking and feeling disappointed can set a negative tone for the day. Worse, worrying about achieving a good score can make it harder to fall asleep. It's crucial to establish boundaries. Perhaps check your data later in the morning as a curious review, not a first-thing judgment.
The most sophisticated users of sleep data treat it as a guide, not a gospel. It is a conversation starter with your own body, filled with insights but also requiring interpretation, context, and a dose of common sense. The technology, like the Oxyzen smart ring, provides the detailed map, but you are still the navigator of your own health journey.
The frontier of sleep science and consumer technology is moving beyond the standard Sleep Score into even more predictive and health-critical domains. The next generation of sleep tracking is focusing on metrics that offer earlier warnings and deeper physiological insights. These are beginning to integrate into holistic wellness scores and will redefine what we consider "complete" sleep analysis.
1. Sleep Apnea Risk Detection & Breathing Disturbance Index (BDI): As mentioned, SpO2 tracking is a proxy for apnea. Future algorithms are moving toward calculating a rough Breathing Disturbance Index—estimating the number of potential apnea/hypopnea (shallow breathing) events per hour. This could provide a life-saving, accessible screening tool, prompting users to seek professional diagnosis for a condition that affects millions who are undiagnosed.
2. Pulse Arrival Time (PAT) & Blood Pressure Trends: Research shows that the time it takes for a pulse wave to travel from the heart to the peripheral sensor (like your finger) correlates with blood pressure. Monitoring PAT trends overnight could reveal nocturnal hypertension, a major risk factor for cardiovascular events that often goes unnoticed because it happens during sleep.
3. Glucose Trends & Metabolic Health: While continuous glucose monitors (CGMs) are separate devices, there is a growing intersection between sleep and metabolic data. Future integration could show how sleep quality (particularly deep sleep) impacts nocturnal glucose stability and next-day insulin sensitivity, providing powerful motivation for those managing metabolic health.
4. Skin Temperature Dynamics: Beyond the nightly curve, the rate of temperature change, the difference between wrist and ambient temperature, and even minute, cyclical fluctuations linked to sleep cycles are areas of research. These dynamics could offer even finer-grained insight into circadian rhythm strength and sleep stability.
5. Sleep Consistency Scores: Beyond simple bedtime regularity, this could evolve into a metric that scores the micro-architecture—the predictability and stability of your 90-minute sleep cycles themselves. High cycle regularity may be a marker of robust neurological health.
These advancements point toward a future where your nightly sleep report functions as a preventative health dashboard, flagging not just poor recovery but early signs of systemic issues. It transforms the smart ring or wearable from a fitness accessory into a true guardian of long-term health, working silently while you rest to keep you informed and in control. This forward-looking vision of technology as a health partner is central to the mission at Oxyzen.
For nearly half the population, a critical layer of context is missing from a generic Sleep Score: the menstrual cycle. The hormonal fluctuations of the cycle—estrogen, progesterone, and others—profoundly influence core body temperature, heart rate, heart rate variability, and sleep architecture. A woman’s Sleep Score that doesn’t account for her cycle phase is like a weather report that doesn’t know the season. The future of personalized wellness lies in syncing these two powerful biological rhythms.
The Hormonal Landscape & Its Sleep Impact:
What This Means for Your Data:
The Actionable Insight: By tracking your cycle alongside your sleep, you move from frustration to foresight. A drop in your Sleep Score during your luteal phase becomes expected data, not a cause for alarm. You can adapt:
For wearables that offer cycle syncing features, this integration is revolutionary. It personalizes your baseline. Instead of comparing your "low" luteal-phase score to your "high" follicular-phase score, the system can provide phase-specific insights, helping you optimize sleep within the natural context of your body’s rhythm. This level of personalized understanding is a cornerstone of modern wellness technology that truly serves the individual.
Just as a 20-year-old and a 60-year-old have different nutritional or fitness needs, they have different sleep architectures. A "good" Sleep Score is not a static target; it evolves throughout your lifespan. Understanding these normal, age-related changes prevents unnecessary concern and allows you to optimize sleep for your current life stage.
The Science of Sleep Across the Decades:
What This Means for Your Sleep Score:
An intelligent algorithm may subtly adjust its expectations or provide age-contextual insights. For you, the user, it means adjusting your personal goals and interpretations:
By framing your Sleep Score within the context of your age, you move from comparison to empowerment. The data helps you understand your unique sleep landscape and reveals which levers—consistency, environment, stress management—will yield the highest return on investment for your rest and health right now. This lifelong journey with sleep is a fascinating one to document, a narrative many of our users share in their personal stories and testimonials.
In the burgeoning market of sleep trackers, three names dominate the conversation: Oura Ring, Whoop Strap, and Apple Watch. Each generates a proprietary "Sleep Score" or equivalent (Whoop calls it a "Recovery" score based heavily on sleep). While they all tap into similar biometrics, their philosophies, algorithms, and end goals differ, leading to sometimes divergent scores for the same night. Understanding these differences is crucial for choosing the right tool and interpreting its data.
1. Oura Ring: The Holistic Sleep Specialist
2. Whoop Strap: The Athlete’s Recovery Engine
3. Apple Watch: The Integrated Ecosystem Player
The Takeaway: If you see an 82 Sleep Score on Oura and a 65% Recovery on Whoop the same morning, it’s not an error. Oura is saying your sleep structure was good; Whoop is saying your nervous system is still stressed and not fully recovered. One is a description of the night; the other is a prescription for the day. Your choice depends on whether you seek detailed sleep insight or a clear performance directive.
The true power of a detailed Sleep Score is revealed not in charts, but in changed lives. Let’s examine three anonymized, composite case studies that show how breaking down the numbers led to specific, impactful transformations.
Case Study 1: The "Healthy" Executive with Hidden Fatigue
Case Study 2: The Dedicated Athlete Hitting a Plateau
Case Study 3: The Perimenopausal Professional
These stories illustrate that a Sleep Score is the beginning of a conversation. By learning its language, you can diagnose issues, test solutions, and write a new, healthier story for yourself. For a broader collection of such transformative journeys, you can explore real user experiences shared here.
For nearly half the population, a critical layer of context is missing from a generic Sleep Score: the menstrual cycle. The hormonal fluctuations of the cycle—estrogen, progesterone, and others—profoundly influence core body temperature, heart rate, heart rate variability, and sleep architecture. A woman’s Sleep Score that doesn’t account for her cycle phase is like a weather report that doesn’t know the season. The future of personalized wellness lies in syncing these two powerful biological rhythms.
The Hormonal Landscape & Its Sleep Impact:
What This Means for Your Data:
The Actionable Insight: By tracking your cycle alongside your sleep, you move from frustration to foresight. A drop in your Sleep Score during your luteal phase becomes expected data, not a cause for alarm. You can adapt:
For wearables that offer cycle syncing features, this integration is revolutionary. It personalizes your baseline. Instead of comparing your "low" luteal-phase score to your "high" follicular-phase score, the system can provide phase-specific insights, helping you optimize sleep within the natural context of your body’s rhythm. This level of personalized understanding is a cornerstone of modern wellness technology that truly serves the individual.
Just as a 20-year-old and a 60-year-old have different nutritional or fitness needs, they have different sleep architectures. A "good" Sleep Score is not a static target; it evolves throughout your lifespan. Understanding these normal, age-related changes prevents unnecessary concern and allows you to optimize sleep for your current life stage.
The Science of Sleep Across the Decades:
What This Means for Your Sleep Score:
An intelligent algorithm may subtly adjust its expectations or provide age-contextual insights. For you, the user, it means adjusting your personal goals and interpretations:
By framing your Sleep Score within the context of your age, you move from comparison to empowerment. The data helps you understand your unique sleep landscape and reveals which levers—consistency, environment, stress management—will yield the highest return on investment for your rest and health right now. This lifelong journey with sleep is a fascinating one to document, a narrative many of our users share in their personal stories and testimonials.
In the burgeoning market of sleep trackers, three names dominate the conversation: Oura Ring, Whoop Strap, and Apple Watch. Each generates a proprietary "Sleep Score" or equivalent (Whoop calls it a "Recovery" score based heavily on sleep). While they all tap into similar biometrics, their philosophies, algorithms, and end goals differ, leading to sometimes divergent scores for the same night. Understanding these differences is crucial for choosing the right tool and interpreting its data.
1. Oura Ring: The Holistic Sleep Specialist
2. Whoop Strap: The Athlete’s Recovery Engine
3. Apple Watch: The Integrated Ecosystem Player
The Takeaway: If you see an 82 Sleep Score on Oura and a 65% Recovery on Whoop the same morning, it’s not an error. Oura is saying your sleep structure was good; Whoop is saying your nervous system is still stressed and not fully recovered. One is a description of the night; the other is a prescription for the day. Your choice depends on whether you seek detailed sleep insight or a clear performance directive.
Your Trusted Sleep Advocate: Sleep Foundation — https://www.sleepfoundation.org
Discover a digital archive of scholarly articles: NIH — https://www.ncbi.nlm.nih.gov/
39 million citations for biomedical literature :PubMed — https://pubmed.ncbi.nlm.nih.gov/
Experts at Harvard Health Publishing covering a variety of health topics — https://www.health.harvard.edu/blog/
Every life deserves world class care :Cleveland Clinic - https://my.clevelandclinic.org/health
Wearable technology and the future of predictive health monitoring :MIT Technology Review — https://www.technologyreview.com/
Dedicated to the well-being of all people and guided by science :World Health Organization — https://www.who.int/news-room/
Psychological science and knowledge to benefit society and improve lives. :APA — https://www.apa.org/monitor/
Cutting-edge insights on human longevity and peak performance:
Lifespan Research — https://www.lifespan.io/
Global authority on exercise physiology, sports performance, and human recovery:
American College of Sports Medicine — https://www.acsm.org/
Neuroscience-driven guidance for better focus, sleep, and mental clarity:
Stanford Human Performance Lab — https://humanperformance.stanford.edu/
Evidence-based psychology and mind–body wellness resources:
Mayo Clinic — https://www.mayoclinic.org/healthy-lifestyle/
Data-backed research on emotional wellbeing, stress biology, and resilience:
American Institute of Stress — https://www.stress.org/

