Sleep Stage Tracking: What Your Wearable Is Actually Measuring
Wearables estimate sleep stages using movement and heart rate data, but their accuracy for specific stages can be limited.
Wearables estimate sleep stages using movement and heart rate data, but their accuracy for specific stages can be limited.
The journey into sleep has always been one of life's great mysteries—a nightly voyage that profoundly impacts our health yet remains largely invisible to us. For centuries, the only evidence of this journey was the simple act of waking, refreshed or fatigued. Today, the rise of wearable technology promises to map this mysterious terrain, offering detailed charts of our nightly voyages through light, deep, and REM sleep stages. Millions now glance at their sleep scores each morning as routinely as checking the weather.
But what exactly is your wearable device measuring when it tells you that you spent 1 hour and 42 minutes in deep sleep? The numbers and colorful charts imply scientific precision, yet the technology creating them is interpreting your body’s signals through complex algorithms, not directly reading your brainwaves. Understanding this distinction is crucial for making sense of the data. Is your smart ring providing a medical-grade analysis of your brain activity, or is it offering an educated estimate based on your heart rate and movement? The answer determines how seriously you should take its advice.
This exploration begins by contrasting the sophisticated, multi-sensor world of the traditional sleep lab with the elegant, minimalist technology on your wrist or finger. We will demystify the core science of sleep architecture, explain the proxy signals your wearable actually tracks, and critically examine how accurate these consumer devices truly are compared to the medical gold standard.

To understand what consumer wearables are attempting to measure, you must first appreciate the staggering complexity of the system they are trying to emulate: the clinical polysomnography (PSG) study. Recognized globally as the gold standard for sleep assessment, PSG is not a single measurement but a symphony of physiological data recorded simultaneously throughout the night.
Imagine preparing for a night in a sleep lab. A sleep technologist attaches approximately 20 individual sensors to your body. On your scalp, a network of small electrodes is positioned according to an international "10-20" system to record electroencephalogram (EEG) activity from multiple regions of your brain. This is the core signal, as the shifting patterns of electrical brain waves—alpha, theta, delta, and spindles—are the definitive markers used to classify every 30-second epoch of the night into Wake, N1, N2, N3, or REM sleep.
Near your eyes, electrooculogram (EOG) electrodes detect the rapid eye movements that characterize REM sleep. On your chin, electromyogram (EMG) sensors monitor muscle tone, which plummets during REM (a state known as atonia). Belts around your chest and abdomen measure respiratory effort, while a small sensor near your nose and mouth monitors airflow. A pulse oximeter on your finger tracks blood oxygen saturation, and additional electrodes may be placed on your legs to detect periodic limb movements. This comprehensive montage is supervised by a trained technologist and later scored by a certified sleep expert, providing an unparalleled, multi-system view of your sleep architecture and identifying disorders like sleep apnea, narcolepsy, and restless legs syndrome.
The process is resource-intensive, expensive, and conducted in an unfamiliar environment that can itself disrupt sleep—a phenomenon known as the "first-night effect". Furthermore, it provides only a single-night snapshot, which may not reflect a person's typical sleep patterns. This creates a significant gap between the need for sleep insight and the accessibility of the best tool to provide it.
Driven by a growing public awareness of sleep's importance for everything from cognitive performance to metabolic health, consumer sleep technology has exploded to fill this gap. The core promise is seductive: take the core concepts of sleep staging and make them accessible, affordable, and usable in your own bed, night after night.
The evolution has been rapid. It began with simple actigraphy—using wrist-worn accelerometers to infer sleep and wake from periods of movement and stillness. While validated for estimating total sleep time over long periods, actigraphy cannot distinguish sleep stages and often overestimates sleep by misclassifying motionless wakefulness as sleep.
The current generation of devices, including smart rings and advanced smartwatches, represents a massive technological leap. They don't just track motion; they are miniaturized physiological labs. By employing photoplethysmography (PPG)—using tiny LED lights to sense blood volume changes in the capillaries—they measure heart rate and its subtle beat-to-beat variations, known as heart rate variability (HRV). Many now include pulse oximetry for blood oxygen, skin temperature sensors, and sophisticated 3D accelerometers. The magic, however, lies not in any single sensor but in the proprietary algorithms that fuse these multiple data streams. These algorithms are trained on vast datasets, often including simultaneous PSG recordings, to infer sleep stages from the physiological proxies they can detect.
The distinction is paramount: PSG measures the direct electrophysiological signatures of sleep stages (like brain waves), while consumer wearables estimate those stages by analyzing correlated bodily signals (like heart rate and movement). It's the difference between listening to an orchestra directly and trying to identify the piece of music by feeling the vibrations in the concert hall floor. This fundamental difference sets the stage for everything that follows about accuracy, utility, and interpretation.

Before a device can claim to track your sleep stages, it must know what to look for. Sleep is not a monolithic state of unconsciousness but a dynamically structured process with distinct, repeating phases, each with unique physiological and neurological characteristics. The American Academy of Sleep Medicine (AASM) manual provides the universal map for this terrain, dividing sleep into four non-REM (NREM) stages and one REM stage, typically scored in 30-second intervals called epochs.
A healthy sleep cycle progresses through these stages in a predictable pattern, repeating every 90-120 minutes. The early cycles are rich in N3 deep sleep, while later cycles feature longer periods of REM. The visual plot of this progression is called a hypnogram. The ultimate goal of any sleep tracker, from the PSG to the simplest wearable, is to reconstruct an accurate hypnogram of your night. For more detailed insights into how your body's nightly rhythms impact your daily wellness, you can explore related articles on our blog[https://oxyzen.ai/blog].
Since consumer wearables lack the direct EEG, EOG, and EMG sensors of a PSG, they rely on a clever toolbox of alternative sensors to gather clues about your sleep state. None of these signals directly reveal your sleep stage, but each provides a piece of the puzzle that machine learning algorithms assemble into a complete picture.
Photoplethysmography (PPG): The Heart of the Matter
This is arguably the most critical sensor for modern sleep staging in wearables. PPG uses green (and sometimes red/infrared) LEDs to shine light into the skin. A photodetector measures the amount of light reflected back, which fluctuates with each heartbeat as blood volume pulses through the capillaries. From this raw signal, the device extracts:
The Accelerometer: Tracking the Body’s Nocturnal Symphony
The 3D accelerometer is the modern successor to basic actigraphy. It doesn't just detect whether you're moving; it measures the intensity, frequency, and pattern of movement.
Additional Physiological Proxies
To improve confidence in its stage predictions, advanced devices incorporate other biometrics:
The genius—and the challenge—of wearable sleep tracking lies in the sensor fusion algorithm. This software must weigh inputs from all these channels in real-time, reference its training on thousands of nights of PSG-correlated data, and make a best guess for each 30-second epoch: Wake, Light, Deep, or REM. It's a remarkable feat of engineering that turns indirect signals into a seemingly direct window into your sleep.
With millions relying on wearable sleep data, the critical question is: can we trust it? The answer is nuanced and depends heavily on what metric you care about. Validation studies consistently show a clear hierarchy of accuracy: wearables are excellent at the binary task of sleep versus wake but face significant challenges in correctly discriminating between specific sleep stages.
Sleep vs. Wake: A Strong Suit
For simply determining whether you are asleep or awake, modern wearables perform very well. Studies report sensitivity (the ability to correctly identify sleep) often at 95% or higher compared to PSG. This means if the PSG shows you were asleep, the wearable will almost always agree. This high performance makes them reliable for estimating Total Sleep Time (TST)—one of the most fundamental and useful metrics for most users.
The Stage-by-Stage Challenge
When we drill down into the accuracy of staging Light (N1+N2), Deep (N3), and REM sleep, the picture becomes more complex. A landmark 2023 multicenter study evaluating 11 consumer devices found "substantial performance variation," with macro F1 scores (a balanced accuracy metric) ranging from a modest 0.26 to a more respectable 0.69 across different devices. A 2024 study from Brigham and Women’s Hospital provides a clearer snapshot for popular devices:
The Notorious "N1" Problem
A recurring finding across validation research is that the transitional N1 stage is the hardest for any system to identify correctly, whether it's a PSG scorer or an algorithm. One 2024 study on EEG headbands noted that N1 was frequently "confounded with N2". A 2025 meta-analysis confirmed that N1 poses "significant classification challenges" for all devices. This is a critical point for users to understand: the "Light Sleep" reported by your wearable is a broad category, and the very light, transitional N1 sleep is often misclassified. This is one reason why the deep sleep stage (N3) is often the most reliably detected—its physiological signatures (very low heart rate, high HRV, profound stillness, and stable breathing) are more distinct and easier for algorithms to recognize.
For a wellness-focused user, this level of accuracy is often sufficient for tracking meaningful trends. Seeing your deep sleep duration dip for three nights in a row after starting a new medication or during a period of high stress is valuable information, even if the absolute minute count for a single night has a margin of error. The data becomes a tool for observing patterns and correlations in your own life, not a clinical diagnostic. For those interested in the rigorous science and research behind these validation efforts, you can learn more about our data-driven approach on our about page[https://oxyzen.ai/about-us].

While sleep stage percentages capture the imagination, the most actionable insights from a wearable often come from other, more directly measured nocturnal metrics. These data points provide a richer context for your sleep quality and can be powerful levers for behavior change.
Heart Rate Variability (HRV): Your Benchmark for Recovery
HRV has emerged as a flagship metric for advanced wearables. Unlike sleep stages, which are inferred, HRV is directly measured from the PPG signal and is considered highly accurate in research-grade devices. Your nighttime HRV—particularly the average or peak during deep sleep—is a robust indicator of your autonomic nervous system balance and overall recovery status. A consistently low or dropping nighttime HRV trend is a clear signal from your body that it is under strain from stress, illness, overtraining, or poor lifestyle choices. It’s a quantitative measure of your resilience.
Resting Heart Rate (RHR) and Its Nocturnal Dip
Your 24-hour resting heart rate is informative, but its nocturnal dip is even more telling. In healthy sleep, your heart rate should drop significantly below your daytime resting average. A blunted or absent nocturnal dip is a recognized physiological red flag, associated with poor cardiovascular recovery, stress, and sleep fragmentation. Your wearable tracks this curve effortlessly, giving you a nightly snapshot of this critical recovery process.
Respiratory Rate: The Silent Rhythm of Sleep
The calm, steady rhythm of breathing is a cornerstone of good sleep. Many wearables now report your average nighttime respiratory rate (breaths per minute). While it varies from person to person (typically 12-20 bpm), tracking your own personal baseline is key. A significant, sustained increase in your nighttime respiratory rate can be an early sign of infection, heart failure exacerbation, or worsening sleep apnea.
Skin Temperature Trends
Your body uses temperature as a powerful signal to regulate sleep-wake cycles. By tracking the temperature at your finger (a good proxy for peripheral temperature), a smart ring can reveal your personal circadian thermal rhythm. A failure of your skin temperature to rise appropriately in the late night/early morning can be associated with poor sleep quality and difficulty waking. For women, these temperature trends are also foundational for cycle and fertility tracking.
The Limits of Interpretation
It is crucial to remember that these metrics, while powerful, are trend-based and personal. There is no universally "good" HRV number or "perfect" respiratory rate. The power lies in observing your own baselines and noticing significant deviations. A wearable provides the data; the user must learn to interpret it within the context of their own life. For common questions on how to interpret specific metrics or understand your data, our FAQ page offers detailed guidance and support.
Raw sensor data—a stream of light reflections, movement impulses, and temperature readings—is meaningless on its own. The transformation into a clean sleep stage hypnogram and insightful wellness scores is the work of the proprietary algorithm, the true "brain" of your wearable. This process is a multi-stage feat of modern data science.
Step 1: Signal Acquisition and Cleaning
The first challenge is obtaining a clean signal. The PPG sensor on a ring or watch must contend with motion artifacts (like tossing and turning), poor fit, and even skin tone, which can affect light absorption. Advanced algorithms use the accelerometer data to identify and often discard PPG data corrupted by major movement, switching to other signals during those periods. This is a key area of innovation, as maximizing "wearable time" (the percent of the night with usable data) is critical for accuracy.
Step 2: Feature Extraction
Once cleaned, the raw signals are processed to extract specific "features" that are physiologically relevant to sleep. From the PPG waveform, the algorithm extracts not just heart rate, but also heart rate variability in different frequency bands (LF, HF), pulse arrival time, and waveform amplitude. From the accelerometer, it extracts not just movement count, but the spectral power of movement in different frequencies. Dozens of such features are calculated for each epoch.
Step 3: Classification via Machine Learning
This is where the "magic" happens. The extracted features for a given 30-second epoch are fed into a pre-trained machine learning model. The most common architectures are ensemble models (like random forests or gradient-boosted trees) or deep neural networks. These models were trained on massive datasets where the input (wearable sensor features) was paired with the ground-truth output (PSG-scored sleep stages). The model learned the complex, non-linear relationships between, for example, a specific pattern of heart rate deceleration combined with low-movement variance and a rising skin temperature, and the probability that the person is in N3 deep sleep.
The Training Data Determines the Output
The quality and diversity of the training data are paramount. A model trained only on healthy, young adults may perform poorly on an older population with different heart rate patterns or on individuals with sleep disorders. Leading companies invest heavily in creating diverse training datasets, sometimes through collaborations with academic sleep centers. This is why algorithm updates can improve accuracy over time—as the model is retrained on new, larger, and more diverse data, its ability to generalize improves.
Step 4: Post-Processing and Smoothing
Finally, the algorithm applies rules based on the known structure of sleep. It's biologically implausible, for instance, to jump directly from Wake to REM sleep (except in narcolepsy). The model's initial epoch-by-epoch predictions are therefore "smoothed" using these rules to produce a more realistic and consistent hypnogram that respects the basic architecture of human sleep cycles.
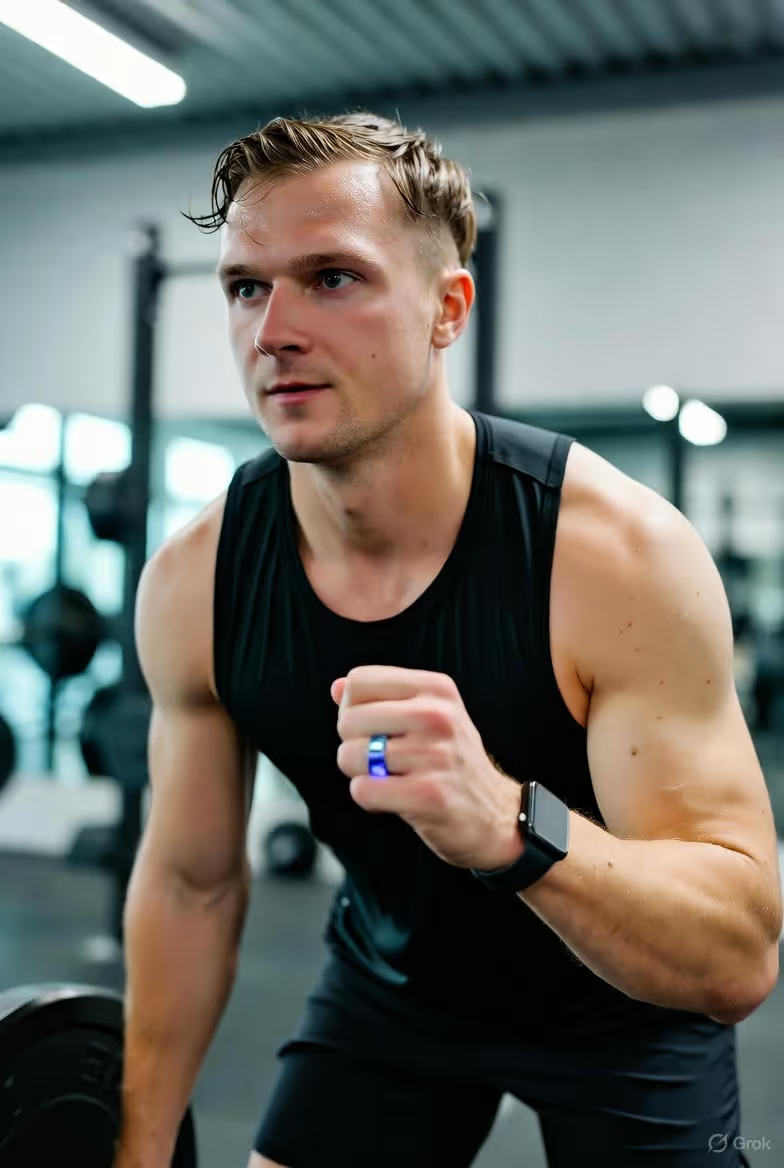
Not all wearables are created equal, and the physical design of the device—its form factor—profoundly influences what it can measure, how comfortable it is, and ultimately, its accuracy for sleep tracking. The marketplace has settled into several distinct categories, each with strengths and compromises.
Smart Rings: The Unobtrusive Night Watchman
Exemplified by devices like the Oura Ring and OxiZen, the ring form factor has unique advantages for sleep.
Smartwatches: The Versatile Powerhouse
Devices like the Apple Watch, Fitbit, and Samsung Galaxy Watch dominate the wrist.
EEG Headbands: The Direct Brainwave Readers
Devices like Dreem or earlier versions of the Muse headband take a different approach: they incorporate dry EEG electrodes on the forehead to directly measure brain waves, much like a simplified PSG.
Nearables and Bed Sensors: The Contact-Free Option
This category includes under-mattress pads (Withings), bedside radar (Amazon Halo Rise), and even smartphone apps that use sonar. They track sleep without any wearable at all.
The choice depends on your priority: maximum accuracy for sleep science (leaning toward an EEG headband), balanced accuracy and 24/7 convenience (a ring), or multifunctionality (a watch). The OxiZen Smart Ring, for example, is designed for those seeking a sleek, minimalist form factor that prioritizes continuous, comfortable health monitoring without the bulk of a watch. For a deeper look at the philosophy behind creating technology that fits seamlessly into life, you can read our story.
You’ve worn your device, it has collected a night’s worth of data, and the algorithm has done its work. Now, you open your app to a dashboard of numbers, graphs, and scores. Knowing how to interpret this report is where the real value is unlocked. Let’s translate the common elements.
The Hypnogram: Your Sleep Story
This is the timeline graph of your night. Time is on the horizontal axis, and sleep stages (Wake, Light, Deep, REM) are on the vertical axis. A healthy hypnogram shows clear, cyclical waves: you descend into deep sleep early in the night, have your first REM period after about 90 minutes, and then cycle between light and REM, with deep sleep phases getting shorter or disappearing in later cycles.
Sleep Stage Percentages: The Big Picture
These are the simple breakdowns: X% Light, Y% Deep, Z% REM. Remember the accuracy limitations, so focus on long-term trends rather than nightly absolutes. Is your deep sleep percentage consistently lower this month than last? That trend is meaningful, even if the exact number for any given night is an estimate.
The Readiness or Recovery Score: The Algorithmic Summary
Many devices distill all the data into a single score (like Oura’s Readiness Score or Whoop’s Recovery). This is a weighted composite of your sleep data, nighttime HRV, resting heart rate, and sometimes temperature.
Key Supporting Metrics
Putting It All Together: A Case Example
Imagine your report shows a decent 7.5 hours of total sleep but a low readiness score. Your hypnogram reveals you had several long awakenings (high WASO) in the second half of the night. Your HRV was lower than your baseline, and your nighttime heart rate didn’t dip as much as usual. This cohesive picture tells a clear story: your sleep was long but not restorative. The cause could be late-night eating, alcohol, stress, or an undiagnosed issue like mild sleep apnea. The data gives you a starting point for investigation. For inspiration on how others have used their data to make positive changes, browse real-world experiences in our testimonials section.
A wearable is a sophisticated tool, but it is not infallible. The accuracy and usefulness of the data it produces are heavily dependent on you, the user. Your habits and choices directly impact signal quality and, therefore, algorithmic performance. Think of it as a partnership: you provide the best possible conditions for measurement, and the device provides the best possible interpretation.
The Prime Directive: Wear It Correctly and Consistently
This is the most critical factor. For a ring or watch using PPG, consistent, snug contact with the skin is non-negotiable.
Lifestyle Factors That Corrupt the Signal
Your choices before bed directly affect the signals your body sends.
Managing Expectations and Avoiding Orthosomnia
Perhaps the most important user habit is psychological. A phenomenon dubbed "orthosomnia"—an unhealthy preoccupation with achieving perfect sleep data—has been identified by sleep physicians. Becoming anxious because your deep sleep was 8% instead of 20%, or checking your device repeatedly after a nighttime awakening, is counterproductive and can itself cause insomnia.
Your wearable is a powerful feedback tool, but it is not the boss of your sleep. You are. The goal is to use the objective data to inform your subjective choices, creating a positive feedback loop for better health. For more resources on developing healthy sleep habits and making the most of your wearable data, a wealth of information is available on the Oxyzen.ai blog.
The evolution of sleep tracking technology is accelerating beyond the current paradigm of heart rate and movement sensing. While today's wearables provide valuable estimates, researchers and companies are pushing toward more direct, comprehensive, and clinically-relevant measurements that could eventually bridge the gap between consumer devices and medical-grade diagnostics.
Several emerging sensor technologies promise to add new dimensions to our understanding of sleep physiology:
Advanced Electrodermal Activity (EDA) Sensors: While current implementations measure basic skin conductance, next-generation EDA sensors will track the intricate patterns of sympathetic nervous system arousal throughout the night. These could identify micro-arousals that fragment sleep without fully waking you—events that current wearables often miss but which significantly impact sleep quality and next-day functioning. Research from Stanford Sleep Center shows these micro-arousals may be particularly important indicators of early-stage sleep disorders.
Core Body Temperature Estimation: Current skin temperature measurements are limited by their distance from the body's thermal core. New approaches using multi-point thermal sensing and advanced algorithms are being developed to estimate true core temperature trends from peripheral measurements. Since the circadian rhythm of core body temperature is one of the most powerful drivers of sleep-wake timing, accurate tracking could revolutionize personalized sleep schedule recommendations.
Blood Pressure Waveform Analysis: Emerging research suggests that subtle changes in the pulse waveform captured by advanced PPG sensors may provide clues about nocturnal blood pressure patterns. Nocturnal hypertension ("non-dipper" pattern) is a significant cardiovascular risk factor that often goes undetected in standard daytime measurements. While not replacing a blood pressure cuff, this could provide screening-level insights.
Some of the most exciting developments move beyond wearables entirely:
Radio Frequency (RF) Sensing: Devices like Google's Nest Hub use low-power radar to detect subtle movements like breathing patterns and heartbeats without any contact. A 2024 study in Sleep Medicine showed that RF sensing could distinguish sleep stages with approximately 85% agreement with PSG—approaching the accuracy of some wearables. As algorithms improve, such contactless solutions could become viable options for those who cannot or prefer not to wear devices.
Acoustic Analysis: Advanced microphone arrays and ultrasonic sensors can analyze breathing sounds, snoring patterns, and even sleep talking. When combined with AI, these systems can identify potential signs of sleep-disordered breathing and provide more detailed analysis of respiratory events than simple SpO2 measurements. Privacy remains a significant concern, but on-device processing is alleviating some of these issues.
Smart Bedding Integration: The integration of sensors directly into mattresses, pillows, and bedding creates a distributed sensor network that can track sleep position, pressure points, and micro-movements with unprecedented spatial resolution. These systems can identify positional sleep apnea (when breathing issues occur only in certain positions) and provide feedback on optimal sleeping positions for individual health concerns.
Artificial intelligence is transforming not just how data is processed, but what insights can be derived:
Personalized Baseline Modeling: Instead of comparing users to population averages, next-generation algorithms will develop highly individualized baselines that account for your unique physiology, genetics, age, and lifestyle factors. This will make deviations from your personal norm more meaningful than comparisons to generalized "healthy ranges."
Predictive Health Insights: By analyzing longitudinal sleep data alongside other health metrics, AI models are beginning to identify subtle patterns that may precede noticeable health changes. Research teams have demonstrated that changes in sleep architecture can precede clinical symptoms of conditions like depression, Parkinson's disease, and cognitive decline by months or even years. While not diagnostic, these early indicators could prompt timely medical consultation and intervention.
Causal Inference Modeling: Beyond correlation, advanced AI techniques are being employed to help understand what factors in your life causally affect your sleep quality. By analyzing hundreds of variables from diet to daily activities to environmental factors, these models can suggest personalized interventions with higher confidence that they will work for your specific situation.
The future of sleep tracking lies not in isolated devices but in integrated systems:
Environmental Optimization: Imagine your sleep tracker communicating with your smart thermostat to gradually lower the bedroom temperature as you progress through sleep stages, or with smart blinds to simulate sunrise at the optimal point in your sleep cycle. Research shows that synchronized environmental cues can improve sleep quality by up to 30% compared to static conditions.
Circadian Lighting Integration: Your wearable's sleep stage data could inform dynamic lighting systems that adjust color temperature and intensity throughout the evening to optimally support your natural circadian rhythm, potentially improving both sleep onset and morning alertness.
Sound Environment Personalization: Advanced systems could analyze your sleep stages in real-time and adjust white noise, binaural beats, or other soundscapes to promote deeper sleep or extend REM periods based on your physiological state.
As these technologies advance, significant challenges remain:
FDA Clearance Pathways: An increasing number of sleep tracking technologies are seeking FDA clearance as Software as a Medical Device (SaMD). This regulatory pathway requires rigorous validation but opens doors for insurance reimbursement and clinical adoption. The first consumer sleep tracker to receive such clearance for detecting sleep apnea (the Withings ScanWatch) represents just the beginning of this trend.
Standardization of Validation: The sleep research community is pushing for standardized protocols for validating consumer sleep technologies against PSG. Current studies vary widely in methodology, making comparisons difficult. The National Sleep Foundation and American Academy of Sleep Medicine are collaborating on guidelines that could eventually lead to certification programs similar to what exists for fitness trackers.
Ethical Data Use: As sleep data becomes more detailed and potentially more sensitive, questions of data ownership, privacy, and ethical use become increasingly important. The intimate nature of sleep data—which can reveal mental health states, relationship patterns, and potential health conditions—requires particularly careful handling and transparent user control.
The trajectory is clear: sleep tracking is evolving from general estimates toward personalized, predictive, and preventive health insights. While today's devices provide a valuable window into our nights, tomorrow's technologies promise a more comprehensive, integrated, and clinically meaningful view of our sleep health. For those interested in staying at the forefront of these developments, resources like the Oxyzen.ai blog regularly cover emerging sleep science and technology trends.
Having sophisticated sleep data is one thing; applying it effectively to improve your health and wellbeing is another. This section provides actionable strategies for transforming raw data into meaningful lifestyle changes that can enhance both sleep quality and overall wellness.
Before making any changes, you need to understand what's normal for you:
The 30-Day Observation Period: Commit to wearing your device consistently for one month without trying to "optimize" your sleep. The goal is to establish your personal baseline across key metrics: total sleep time, sleep efficiency, deep/REM percentages, HRV, and resting heart rate. Track these alongside simple notes about your daily routine, stress levels, exercise, and alcohol consumption.
Identify Your Natural Patterns: Look for patterns in your baseline data. Are you naturally a night owl or early bird? Do you see better sleep quality after certain types of exercise? Does your sleep suffer after late meals? This observational phase removes judgment and establishes objective facts about your sleep habits.
Calculate Your Personal Averages: Once you have 30 days of data, calculate your averages for each metric. These become your personal reference points—far more meaningful than comparing yourself to population norms. For example, if your average deep sleep is 15%, a night at 20% is excellent for you, even if a friend averages 25%.
Different sleep issues require different approaches:
If Your Data Shows Poor Sleep Efficiency (<85%):
If Your Data Shows Inadequate Deep Sleep:
If Your Data Shows Fragmented REM Sleep:
The most powerful insights come from connecting sleep data with lifestyle factors:
Create a Simple Sleep Journal: Beyond what your wearable tracks, note: caffeine intake (time and amount), alcohol consumption, exercise (type, intensity, and timing), stress level (1-10 scale), daytime naps, and subjective sleep quality rating.
Look for Delayed Effects: Some factors affect sleep with a delay. You might notice that intense evening workouts don't impact that night's sleep but reduce sleep quality the following night. Or that alcohol affects sleep architecture for two nights, not just one.
Identify Your Personal Triggers: Through careful correlation, you'll discover your unique sensitivities. One person might find that even a single afternoon coffee disrupts their sleep, while another can have espresso after dinner with no effect. The same applies to food, exercise timing, and evening light exposure.
Your wearable can indicate when professional help might be warranted:
Consistent Signs of Potential Sleep Disorders: If your data consistently shows any of the following patterns, consider consulting a sleep specialist:
Bring Your Data to Your Appointment: Many sleep specialists now welcome patient-collected data. Bring summary reports showing trends over weeks or months—this longitudinal data can be more informative than a single night in a sleep lab, which is affected by the "first night effect."
Understand the Limits: A wearable can suggest but not diagnose conditions like sleep apnea, insomnia, or circadian rhythm disorders. Use it as a screening tool and conversation starter with healthcare providers, not as a replacement for professional diagnosis.
The ultimate goal is to internalize healthy sleep habits:
Start Small and Build Consistency: Rather than overhauling everything at once, pick one small change and stick with it for two weeks while monitoring its effect on your data. For example, implement a consistent wake time for two weeks before tackling bedtime.
Use Your Device as a Feedback Loop, Not a Scorekeeper: Check your data weekly rather than daily to avoid "orthosomnia" (an unhealthy preoccupation with perfect sleep data). Look for trends, not nightly scores.
Celebrate Progress, Not Perfection: Sleep naturally varies. A 5% improvement in sleep efficiency over a month is meaningful progress. Notice how even small improvements in sleep metrics correlate with better energy, mood, and focus during the day.
By approaching your sleep data with curiosity rather than judgment, and using it to inform small, sustainable changes, you can transform numbers on a screen into genuinely better sleep and improved wellbeing. For additional guidance on specific sleep challenges, our comprehensive FAQ section addresses many common questions about sleep optimization.
As sleep tracking technology becomes more sophisticated and integrated into daily life, it's crucial to understand its limitations and the ethical questions it raises. A critical perspective ensures that these powerful tools are used responsibly and effectively, without causing unintended harm.
The Inference Gap Revisited
It bears repeating: consumer wearables estimate sleep stages through correlation, they do not measure them directly. This fundamental limitation means:
Missing Metrics That Matter
Current wearables fail to capture several important aspects of sleep physiology:
The Problem of Placebo and Nocebo Effects
Research suggests that simply wearing a sleep tracker can alter sleep behavior and perception—the "tracker placebo effect." Conversely, seeing a "poor" sleep score can create anxiety that actually impairs subsequent sleep—the "nocebo effect." One 2023 study found that participants who were told they had poor sleep quality (regardless of actual data) reported significantly more daytime sleepiness and performed worse on cognitive tests.
Sleep data is uniquely intimate, revealing patterns that could be misused:
What Your Sleep Data Could Reveal
Beyond sleep quality, analysis of your nocturnal biometrics might infer:
Data Ownership and Third-Party Sharing
Most users don't realize how their sleep data might be used:
Security Vulnerabilities
Like any connected device, sleep trackers present potential security risks:
The Quantification of Rest
Sleep is fundamentally a subjective, restorative experience. Reducing it to scores and percentages risks:
Relationship Dynamics
When one partner uses a sleep tracker and the other doesn't, or when both track with conflicting results:
Health Inequality and Access
Advanced sleep tracking technology risks exacerbating existing health disparities:
Given these limitations and concerns, consider adopting these principles for ethical sleep tracking:
Practice Data Minimalism
Maintain Human-Centric Interpretation
Advocate for Ethical Standards
Cultivate Digital Boundaries
By acknowledging both the power and the limitations of sleep tracking technology, we can harness its benefits while mitigating potential harms. The goal should be technology that serves human flourishing, not humans serving technological optimization. For those interested in how responsible technology development aligns with ethical principles, our about page details our commitment to these values.
With numerous sleep tracking devices on the market, each takes a slightly different approach to measuring and interpreting sleep. Understanding these differences can help you select the device that best matches your needs, preferences, and health goals.
Oura Ring (Generation 3)
Circular Ring
Oxyzen Smart Ring
Apple Watch (with Sleep App)
Fitbit (Various Models)
Garmin Watches
Muse S (EEG Headband)
Withings Sleep Analyzer (Under-Mattress Pad)
For General Wellness and Lifestyle Tracking: Consider a ring or watch you'll wear consistently. Rings often have better compliance for sleep specifically.
For Athletic Recovery Focus: Garmin or Whoop (not covered in detail here) offer strong integration with training load and recovery metrics.
For Maximum Scientific Accuracy in Sleep Staging: An EEG headband like Muse provides the closest approximation to PSG available to consumers.
For Sleep Apnea Screening or Concerns: Withings Sleep Analyzer or devices with FDA clearance for apnea detection.
For Minimalist, Unobtrusive Tracking: A smart ring typically offers the least intrusive experience, especially for sleep.
For Ecosystem Integration: Choose based on your existing tech ecosystem (Apple vs. Google/Fitbit vs. Garmin).
Regardless of device choice, the most important factor is consistent wear. A moderately accurate device worn every night provides more valuable trend data than a highly accurate device worn sporadically. Most users find their best experience comes from matching the device form factor to their lifestyle and comfort preferences first, then comparing specific features second. To see how real users have chosen and benefited from different approaches, our testimonials page shares authentic experiences with various tracking strategies.
Sleep does not exist in isolation—it is deeply interconnected with virtually every other aspect of health. The most powerful application of sleep tracking emerges when you connect your nocturnal data with daytime metrics, creating a comprehensive picture of your health ecosystem. This integrative approach reveals how sleep influences and is influenced by activity, nutrition, stress, and recovery.
Two-Way Relationship: Exercise affects sleep, and sleep affects exercise capacity. Tracking both reveals optimal timing and intensity:
Practical Integration Strategy: Use your wearable's activity data alongside sleep metrics. Notice patterns: Do high-step-count days correlate with better sleep? How does the timing of your last workout affect sleep latency and quality? This can help you personalize your exercise routine for both fitness gains and sleep optimization.
Meal Timing and Composition: What and when you eat significantly influences sleep architecture:
Caffeine and Alcohol Logging: These substances have profound, measurable effects:
Hydration Tracking: Both dehydration and excessive evening fluid intake can disrupt sleep. Notice if days with different hydration patterns affect nighttime awakenings (potentially for bathroom trips) or sleep quality.
Daytime Stress Impact: Daytime stress doesn't end at bedtime—it carries into your sleep physiology:
Sleep's Role in Stress Resilience: Conversely, track how sleep quality affects next-day stress resilience. Poor sleep typically lowers stress threshold—notice if days following poor sleep show higher stress metrics or subjective stress reports.
Circadian Rhythm Synchronization: Consistent sleep-wake times help regulate cortisol (stress hormone) rhythms. Use your device's sleep consistency metrics alongside daytime energy and stress patterns to find your optimal schedule.
For women, sleep patterns interact significantly with menstrual cycle phases:
Temperature Tracking Integration: Basal body temperature or wearable temperature data can help identify cycle phases. Many women notice:
Hormonal Influences: Tracking your cycle alongside sleep metrics can reveal personalized patterns:
Practical Application: Use this knowledge to adjust expectations and self-care. If you know your sleep is typically poorer in the week before your period, you might schedule fewer demanding activities during that time or prioritize sleep hygiene practices.
To integrate these connections effectively:
Choose a Central Hub: Apple Health, Google Fit, or specialized platforms like Oura's or Fitbit's ecosystems can serve as central repositories where data from multiple sources integrates.
Look for Cross-Correlations, Not Just Isolated Metrics: Instead of just checking your sleep score, ask: "How did yesterday's activity, nutrition, and stress relate to last night's sleep, and how is today's energy relating to that sleep?"
Establish Personal Baselines for Combined Metrics: For example, establish what your typical HRV is after different types of days. What's your "good day" HRV vs. your "stressful day" HRV? How does sleep efficiency change based on weekly exercise volume?
Notice Lag Effects: Some effects are delayed. A stressful Tuesday might not affect Tuesday night's sleep but could impact Wednesday night's. A heavy Saturday workout might affect Sunday night's recovery sleep.
Use Data for Compassion, Not Judgment: When you see poor sleep following a stressful day, frame it as: "My body is showing me the impact of that stress" rather than "I failed at sleep last night." This reframe makes the data empowering rather than shaming.
By viewing sleep as one vital thread in the broader tapestry of your health, you gain more nuanced insights and more effective intervention points. Small, coordinated adjustments across activity, nutrition, and stress management often yield greater improvements in sleep than focusing on sleep habits alone. This holistic perspective transforms sleep tracking from a isolated curiosity into a central component of comprehensive wellbeing. For more resources on integrating various health metrics, our blog features articles on connected health ecosystems and holistic wellness strategies.
While sleep tracking provides valuable feedback, optimizing sleep requires implementing evidence-based strategies. This section reviews the most scientifically-supported approaches to improving sleep quality, with guidance on how to use your wearable data to personalize these strategies for maximum effectiveness.
The Mechanism: Light is the primary Zeitgeber (time-giver) for your circadian clock. Specialized retinal ganglion cells detect light intensity and especially blue wavelengths, signaling the suprachiasmatic nucleus in your brain to regulate melatonin production and sleep-wake timing.
Evidence-Based Implementation:
Using Your Wearable to Optimize: Track how days with different light exposure patterns affect your sleep metrics. Notice if days with good morning light correlate with better sleep efficiency or more consistent sleep timing. Some advanced wearables now include ambient light tracking to help you monitor this crucial variable.
The Science: Core body temperature must drop approximately 1°C (1.8°F) to initiate and maintain sleep. This drop is facilitated by increased blood flow to the extremities, releasing heat.
Optimization Strategies:
Using Your Wearable: Many devices track skin temperature. Notice how your temperature curve correlates with sleep onset and quality. If your skin temperature doesn't show the expected rise in the late evening (which facilitates subsequent cooling), it might indicate circadian misalignment or poor peripheral circulation.
The Evidence: Maintaining consistent sleep and wake times (even on weekends) is one of the most powerful sleep interventions. Variability in sleep timing creates "social jet lag," disrupting circadian rhythms. A 2023 study found that every hour of weekend sleep schedule variance correlated with a 11% increase in risk of heart disease markers.
Implementation:
Using Your Wearable: Most devices provide sleep consistency scores. Work to improve this
Your Trusted Sleep Advocate: Sleep Foundation — https://www.sleepfoundation.org
Discover a digital archive of scholarly articles: NIH — https://www.ncbi.nlm.nih.gov/
39 million citations for biomedical literature :PubMed — https://pubmed.ncbi.nlm.nih.gov/
Experts at Harvard Health Publishing covering a variety of health topics — https://www.health.harvard.edu/blog/
Every life deserves world class care :Cleveland Clinic - https://my.clevelandclinic.org/health
Wearable technology and the future of predictive health monitoring :MIT Technology Review — https://www.technologyreview.com/
Dedicated to the well-being of all people and guided by science :World Health Organization — https://www.who.int/news-room/
Psychological science and knowledge to benefit society and improve lives. :APA — https://www.apa.org/monitor/
Cutting-edge insights on human longevity and peak performance:
Lifespan Research — https://www.lifespan.io/
Global authority on exercise physiology, sports performance, and human recovery:
American College of Sports Medicine — https://www.acsm.org/
Neuroscience-driven guidance for better focus, sleep, and mental clarity:
Stanford Human Performance Lab — https://humanperformance.stanford.edu/
Evidence-based psychology and mind–body wellness resources:
Mayo Clinic — https://www.mayoclinic.org/healthy-lifestyle/
Data-backed research on emotional wellbeing, stress biology, and resilience:
American Institute of Stress — https://www.stress.org/

