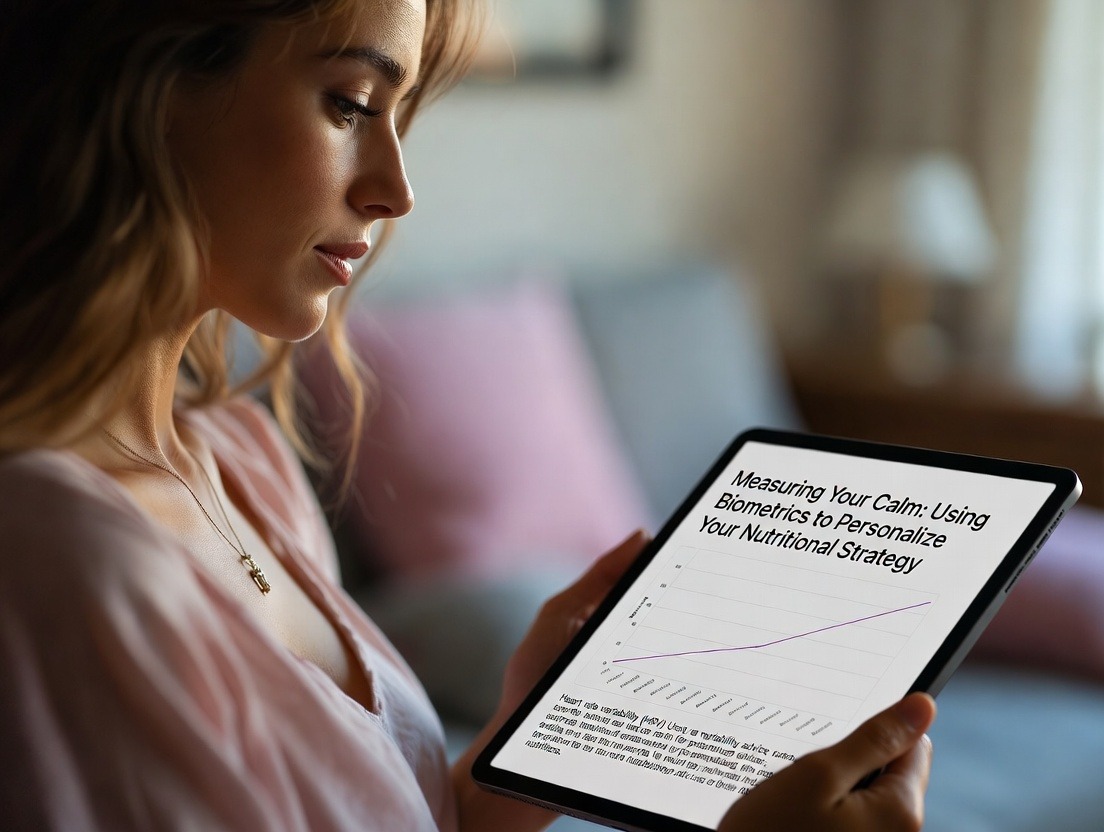
The Daily Performance Dashboard: HRV as Your Central Metric
Using HRV as the central metric on your daily performance dashboard.
Using HRV as the central metric on your daily performance dashboard.
We wake up, check our phones, and are immediately bombarded with metrics: emails waiting, social media notifications, calendar appointments. We have dashboards for our finances, our work projects, and even our fitness. Yet, for the most complex, mission-critical system we will ever operate—our own body and mind—we often fly blind, relying on vague feelings of "tired" or "stressed" to guide our most important daily decisions.
What if you had a CEO-level dashboard for your personal performance? Not just a fitness tracker counting steps, but a nuanced, real-time readout of your nervous system’s readiness, resilience, and recovery. A metric that could tell you, objectively, whether you are primed for a high-stakes negotiation, truly recovering from a workout, or silently teetering on the edge of burnout. This isn't science fiction. This is the reality unlocked by a simple, profound, and increasingly accessible biomarker: Heart Rate Variability (HRV).
For decades, HRV was confined to cardiology clinics and elite sports labs. Today, thanks to advances in wearable technology like the smart ring, it has moved from the lab to your finger, offering a continuous, non-invasive window into your autonomic nervous system (ANS). Think of your ANS as your body's autopilot, managing everything from your heart rate and digestion to stress response and recovery. HRV, the subtle variation in the milliseconds between each heartbeat, is its most direct and eloquent output. A higher, more robust HRV generally signals a flexible, resilient, and recovery-dominant state—your "green light." A suppressed, low HRV is your body's dashboard warning light, indicating stress, fatigue, or illness—a clear "proceed with caution."
This article is your master guide to transforming HRV from a confusing data point into the central metric of your daily life. We will explore the deep science behind why HRV is the ultimate biofeedback tool, how to measure it accurately with modern devices like the Oxyzen smart ring, and, most importantly, how to interpret its daily fluctuations to make smarter choices about training, work, sleep, and life. This is about moving from reactive health management to proactive performance optimization. It's about building your Daily Performance Dashboard, with HRV as the central gauge, empowering you to not just live, but thrive.
Your Body's Most Honest Metric: Unpacking the Science of HRV
Heart Rate Variability isn't about how fast your heart beats, but about the timing between beats. If your heart beats exactly once per second (60 BPM), it would sound like a robotic metronome: beat...beat...beat. A healthy, resilient heart is more like a skilled jazz drummer: the overall rhythm is steady, but the subtle micro-variations between beats are rich, complex, and responsive. This variability is a very good thing.
At its core, HRV is a proxy for the tug-of-war between the two branches of your autonomic nervous system:
A high HRV indicates that both systems are active and engaged in a dynamic balance. Your body can strongly rev the engine when needed (e.g., during a sprint) and then powerfully hit the brakes to recover afterward. It's a sign of cardiovascular fitness, nervous system resilience, and strong stress adaptability. A low HRV suggests one system is dominating—typically, a stressed, sympathetic-dominant state where the "accelerator" is chronically pressed. This can be a precursor to fatigue, burnout, lowered immunity, and poor performance.
The game-changing insight for daily life is that HRV is acutely sensitive to everything. It's not just influenced by a hard workout. It dips in response to a stressful work meeting, a poor night's sleep, an emotional argument, dehydration, or even the beginnings of a cold. It rises with quality sleep, proper nutrition, mindfulness practices, and positive social connections. This makes it an unparalleled, holistic feedback system. By tracking your HRV trends, you're not just tracking your fitness; you're tracking your life's load and your body's response to it. To learn more about the fascinating science behind how devices like our smart ring capture this data, you can explore our detailed blog articles on biometrics.
While the morning readiness score sets the stage, the workday itself is a dynamic series of storms and calms. A project setback, a tense call, an overwhelming inbox—these micro-events can trigger a stress response that hijacks your prefrontal cortex (the seat of rational decision-making) and sends your physiology into a tailspin. The insidious part is that we often become so habituated to this state that we don’t even recognize we’re in it until we’re exhausted. This is where the real-time capability of advanced smart rings becomes a game-changing intervention.
Many smart rings now offer a continuous stress or ANS measurement feature (often derived from HRV and heart rate dynamics). When this metric spikes beyond a personalized threshold, the paired app can send a subtle notification to your phone or watch. This isn’t an alarm; it’s a biofeedback cue—a gentle, objective tap on the shoulder from your physiology saying, “You’ve just been triggered.”
For the professional, this instant feedback loop is transformative. Here’s how they use it:
1. The Pattern Recognition Trigger: The first response to an alert is non-judgmental awareness. “Ah, my stress score just spiked. What happened right now?” Was it the email from a difficult client? The sudden change in a deadline? The interruption during deep work? Over time, these alerts create a map of your unique stress triggers, many of which may have been subconscious.
2. The Real-Time Pivot: The alert creates a crucial moment of choice—the gap between stimulus and response. Instead of staying in a reactive, sympathetic-dominant state for the next hour, you can deploy a “circuit-breaker” technique. This is a 60- to 90-second deliberate intervention to engage the parasympathetic nervous system:
These micro-practices, prompted by the alert, can dramatically shorten the duration of the stress response, preserving cognitive function and emotional balance.
3. The Post-Event Analysis: Later, you can review the stress timeline in your app. You might see that your physiological stress remained elevated for 45 minutes after that difficult meeting, even though you thought you’d “shaken it off.” This data reinforces the cost of unchecked reactions and the value of your real-time interventions.
Consider a trial lawyer who receives a stress alert during a hostile cross-examination. That cue reminds them to consciously regulate their breathing and posture, maintaining a calm, commanding presence. Or a project manager who sees their stress graph skyrocket during a chaotic daily stand-up. This data becomes objective evidence to restructure the meeting format for greater efficiency and less collective anxiety.
By turning invisible internal states into visible, manageable data points, professionals gain agency over their workday experience. They stop being passengers on a rollercoaster of stress and become pilots, making constant, small adjustments to stay on course. The Oxyzen smart ring is designed specifically for this kind of seamless, real-world biofeedback, as detailed in our story of creating technology that integrates into life, not interrupts it.
For driven professionals, exercise is often a double-edged sword. It’s a critical tool for mental clarity, resilience, and health, but it’s also a physiological stressor. In the mindset of “more is better,” it’s easy to fall into overtraining—pushing hard in the gym to manage work stress, only to further deplete a system that’s already running a deficit. This leads to diminishing returns, injury, and burnout. Smart ring HRV data provides the objective intelligence needed to solve this equation, ensuring training supports professional performance rather than sabotages it.
Elite athletes have long used HRV to guide training load. Now, professionals in all fields are adopting this same principle. The rule is simple: align your workout intensity with your body’s readiness to receive it.
The Power of the Long-Term Trend: Beyond daily decisions, weekly and monthly HRV trends reveal the cumulative impact of your training regimen. A professional might notice that a program of four weekly HIIT sessions is causing a gradual, downward drift in their baseline HRV. This is a clear sign of chronic strain. The data-informed response isn’t to push harder, but to periodize: introduce a deload week with reduced volume and intensity, allowing the body to super-compensate and rebuild a higher baseline.
Furthermore, the smart ring can reveal the nuances of recovery. How long does it take your system to bounce back from a heavy leg day versus a high-volume workday? You may find that a hard workout on a Friday night impairs your weekend recovery, leaving you less prepared for Monday. This might lead you to shift intense training to Tuesday or Wednesday, when you can better absorb and recover from the stress within the workweek cycle.
This data-driven approach transforms exercise from a rigid schedule to a fluid dialogue with your body. A financial analyst, for instance, might see that during quarterly reporting periods (with high cognitive load and poor sleep), his HRV plummets. He learns to automatically switch his training plan to a low-intensity “maintenance phase” for those two weeks, preserving energy for his work and preventing illness. He then ramps up training in the quieter weeks that follow. This intelligent flexibility is the hallmark of a professional who manages their entire energy portfolio, not just their work tasks. For more on designing a personalized, data-backed wellness regimen, our blog offers extensive resources and guides.
For HRV to be useful, you need a consistent, convenient, and accurate way to measure it. Enter the smart ring. While wrist-worn devices and chest straps have their place, the smart ring represents a paradigm shift in personal biometric monitoring for daily life.
The primary advantage is measurement location. The finger hosts a rich capillary bed, providing a strong, consistent photoplethysmogram (PPG) signal for optical heart rate sensors. This is often superior to the wrist, which is prone to motion artifacts from daily activities. Furthermore, you wear a ring 24/7—through sleep, workouts, work, and showers (with a water-resistant design). This continuous wear enables the most critical data capture for HRV: overnight measurements.
The most reliable, standardized HRV reading for trend analysis is a resting, consistent measurement, typically taken during sleep. While you sleep, confounding variables like movement, caffeine, and acute stress are minimized. A smart ring silently collects thousands of data points each night, calculating your Nightly Average HRV or using a specific, consistent 5-minute segment (like the last deep sleep phase). This creates an apples-to-apples comparison from day to day, isolating your body's recovery state from the noise of daily life. Comparing your daily HRV to this personal, established baseline is far more meaningful than comparing it to population averages.
Modern rings, like those developed by Oxyzen, go far beyond simple HRV tracking. They synthesize this core metric with complementary data to paint a complete picture:
By fusing these metrics, your smart ring doesn't just give you a number; it generates a Readiness Score or Recovery Index. HRV is the heavyweight component of this score, contextualized by how you slept and moved. This integrated dashboard is what turns raw data into an actionable morning briefing. Discover how this seamless integration of technology and biology is at the heart of our mission at Oxyzen.
So, your ring syncs, and your app delivers your "Readiness Score": 78. What now? The novice mistake is to obsess over the single score or the raw HRV number. The masterful practice is to trend, contextualize, and correlate.
First, trend is everything. A single day's dip in HRV is meaningless noise. Life happens. Perhaps you had a late meal, a glass of wine, or an intense evening workout. The power lies in observing the trend line over weeks and months. Is your baseline HRV gradually climbing? That's a sign of improving fitness and resilience. Is it on a steady, multi-day decline despite normal sleep? That's a red flag signaling accumulated stress, potential overtraining, or illness onset. Your dashboard should prominently display this trend line, making deviations immediately visible.
Second, contextualize with tags. This is where you become a scientist of your own life. Every morning, when you review your score, you should log potential influencing factors, or "tags." Most good apps allow this. Did you have alcohol? Caffeine after 2 PM? A high-stress workday? A strenuous leg day? A difficult conversation? A fantastic social outing? By tagging these events, you start to build a personal database. After a few weeks, you can look back and see clear patterns: "Every time I have a late dinner, my HRV drops 8%," or "My HRV consistently trends up the day after my yoga class."
Third, correlate with other metrics. Don't view HRV in isolation. Cross-reference it with other tiles on your dashboard:
Your morning review should be a 60-second ritual: Check the score, note the trend, see the supporting data, and log your tags. This process builds self-awareness that is objective, not subjective. As one user shared on our testimonials page, "It was the trend, not the single number, that finally made me take my burnout seriously. The data didn't lie."

Now comes the transformative part: letting the dashboard guide your day. This is the shift from passive tracking to active performance management.
For Athletes & Fitness Enthusiasts (The Training Governor):
The old paradigm: follow a rigid, pre-written training plan regardless of feel. The new paradigm: autoregulation.
For Professionals & Knowledge Workers (The Cognitive Load Manager):
Your mental performance is inextricably linked to your physiological state. A low HRV doesn't just affect your muscles; it impairs your prefrontal cortex—the brain region responsible for executive function, decision-making, and emotional control.
This decision-making framework turns HRV from a curiosity into a strategic tool. It helps you align your effort with your capacity, maximizing results while minimizing the risk of burnout. For those curious about how different professions are using this data, we've compiled several case studies in our blog.
While physical strain is a major HRV influencer, psychological and emotional stress are often the dominant factors in our modern lives. HRV provides a tangible, physiological bridge to our intangible emotional world.
Chronic worry, anxiety, and rumination keep the sympathetic nervous system in a low-grade, sustained activation. This constant "background stress" can suppress HRV as effectively as a hard workout. Conversely, positive emotions like gratitude, joy, and social connection have been shown to boost parasympathetic activity and, thus, HRV.
Here’s how to use your dashboard for emotional intelligence:
This application transforms HRV from a fitness metric into a holistic wellness metric. It helps you see stress not as a nebulous concept, but as a quantifiable physiological load that must be managed alongside physical load. Understanding this deep connection is part of our story and the reason we built a tool for holistic awareness, not just step counting.
What you put into your body directly fuels—or disrupts—your autonomic nervous system. Your HRV dashboard is a sensitive meter for this.
The Acute Effects (Visible within hours):
The Chronic Patterns (Visible in trends):
Actionable Insight: Use your dashboard to run self-experiments.
This turns nutrition from dogma ("I should eat healthy") to a personalized discovery process ("My body recovers significantly better when I avoid gluten"). For more on designing such self-experiments, our FAQ section offers practical guidance.
Sleep is non-negotiable for recovery, and HRV is its most telling report card. However, sleep tracking in isolation can be misleading. You might get 8 hours in bed, but your dashboard reveals the truth through the synergy of sleep data and HRV.
The Synergy of Sleep & HRV Data:
HRV and Sleep Stages: Deep, slow-wave sleep (SWS) is particularly associated with parasympathetic dominance and physical restoration, often correlating with peaks in HRV during the night. REM sleep, while crucial for cognitive and emotional processing, can be more sympathetically active, with more variable heart rate. A healthy sleep cycle shows a natural ebb and flow of HRV in concert with these stages. Disrupted sleep architecture flattens this rhythm.
By using HRV to qualify your sleep, you move beyond "I got 7 hours" to a precise understanding of how restorative those hours actually were. This stops you from blaming a single bad night and guides you to look at the bigger picture of your life load. Many users find that tracking this synergy is the first step to truly respecting their sleep needs, a journey we support with resources on our blog.
Tracking is informative, but the ultimate goal is improvement. Raising your HRV baseline over months is synonymous with building a more resilient, adaptable, and healthier nervous system. It's a marathon, not a sprint, built on consistent lifestyle pillars.
1. Consistent, Prioritized Sleep: This is the number one lever. Aim for 7-9 hours of quality, regular sleep. Protect your sleep time as you would a critical business meeting. The cumulative effect on your HRV baseline will be greater than any other intervention.
2. Intelligent, Periodized Training: Avoid chronic, high-intensity training without adequate recovery. Follow the dashboard's guidance, incorporate deload weeks, and include a large volume of low-intensity, parasympathetic-friendly activity like walking, hiking, or easy cycling.
3. Purposeful Stress Modulation: Actively engage in practices that stimulate the vagus nerve and the parasympathetic system:
4. Nutritional Support: Fuel your nervous system with anti-inflammatory, nutrient-dense foods. Ensure adequate intake of electrolytes (magnesium, potassium) and consider omega-3 supplementation if you don't eat fatty fish regularly.
5. Mind Your Mind: Work on cognitive reframing, gratitude, and reducing exposure to chronic low-grade stressors like doomscrolling news or toxic social media. Your psychological environment is your physiological environment.
The beautiful feedback loop here is that as you engage in these practices, your rising HRV baseline gives you positive reinforcement. You feel better, perform better, and the data proves it. This creates a virtuous cycle of healthy habits. The entire Oxyzen ecosystem is designed to support you in building and maintaining this cycle, providing not just data, but the insights to act on it.
Navigating the Nuances: Advanced HRV Interpretation for Real Life
You’ve established your baseline. You’re tracking diligently and making better daily decisions. Yet, you’ll inevitably encounter confusing days—situations where the data seems contradictory or where life throws a complex scenario that your dashboard must decode. This is where we move from basic interpretation to advanced fluency. Understanding the nuances of HRV is what separates the casual user from the true biohacker.
One of the most common points of confusion is the acute exercise response. A very intense training session will almost certainly cause a sharp dip in your HRV that night and into the next morning. This is not inherently bad; it’s a sign of a potent physiological stimulus. The critical question is: What is the recovery trajectory? In a resilient system, HRV should rebound to baseline or higher within 24-48 hours. This is called functional overreaching—the very process that drives adaptation and growth. The danger sign is when HRV remains suppressed for three, four, or five days. This is non-functional overreaching, edging into overtraining syndrome. Your dashboard’s trend line is your early warning system. If you see a precipitous drop with no rebound, it’s a command to insert extra recovery days, dial back intensity, and investigate other stressors that might be blocking recovery.
Similarly, travel presents a fascinating stress test for your system. Jet lag, time zone changes, disrupted sleep, dehydration, and the general strain of travel create a perfect storm for suppressed HRV. By tracking through a trip, you gain objective insight into your personal resilience. You might see that eastward travel crushes your metrics for three days, while a north-south trip has minimal effect. This data can inform future planning—perhaps you schedule a critical meeting for day four of a trip, not day two, based on your known recovery curve. The dashboard removes guesswork, allowing you to manage your energy proactively even in disruptive environments. For insights from other frequent travelers, our testimonials page shares real-world stories of using data to combat jet lag.
For anyone who menstruates, interpreting HRV without considering hormonal cycles is like trying to navigate with a map that’s missing half its landmarks. The ebb and flow of estrogen and progesterone have a profound, predictable impact on the autonomic nervous system, and thus, on HRV.
Typically, a pattern emerges across a 28-day cycle (though individual patterns vary):
The Revolutionary Insight: By tracking HRV alongside your cycle in your app, you stop pathologizing these natural fluctuations. A dip in week three is not a failure; it’s biology. This allows for cycle-synced planning. You can periodize your training and workload to align with your body’s natural rhythms: push hard in the follicular phase, focus on maintenance and technique in the luteal phase, and honor recovery during menstruation. This respectful alignment with your physiology reduces frustration, prevents injury, and can lead to better long-term results and well-being. It transforms the monthly cycle from a confounding variable into a predictable, manageable rhythm on your performance dashboard. We delve deeper into this topic with expert insights on our blog.

While daily decisions are powerful, the true north star of HRV tracking is the long-term trend. Viewing your data over quarters and years reveals a story about your overall health trajectory and can serve as a powerful predictive and preventive tool.
A steadily rising or stable HRV baseline over years is one of the strongest biomarkers of healthy aging. It suggests you are maintaining autonomic flexibility, managing stress effectively, and supporting your cardiovascular system. It’s a quantitative measure of your "healthspan."
Conversely, a gradual, persistent decline in your HRV baseline, independent of normal aging, is a significant warning signal. It can indicate:
This predictive power makes HRV a cornerstone of preventive health. It’s not about diagnosing disease; it’s about spotting a negative trajectory early enough to intervene with lifestyle changes. If you see a six-month downtrend, it’s a data-driven mandate to audit your sleep, nutrition, stress, and training. You can then make changes and watch the trend line for a response. It turns you into the principal investigator of your own well-being, empowered to course-correct before a minor issue becomes a major one. This philosophy of empowered, preventive health is central to our story at Oxyzen.
Beyond the Individual: HRV in Relationships and Team Dynamics
The implications of a personal performance dashboard extend beyond solo optimization. When we understand that HRV reflects stress and readiness, it opens up profound applications for interpersonal relationships and professional teams.
In Personal Relationships: Imagine a couple who both track their HRV. They might notice that after certain types of conflicts, both their scores plummet. This isn’t about blame; it’s about objectively quantifying the physiological cost of unproductive communication patterns. Conversely, they might see that spending a relaxed day in nature together boosts both their scores. This data can inspire more empathetic communication. Saying, "My nervous system is really taxed today, can we table this discussion for tomorrow?" is supported by objective data, not just a feeling. It fosters a culture where respecting each other’s biological state becomes a norm, reducing friction and improving connection.
In High-Performance Teams (Sports, Business, Healthcare): The concept of team-level HRV is emerging in elite sports. By aggregating anonymized, trend-level data from athletes, coaches and performance staff can gauge the overall fatigue and readiness of the team. A cluster of low scores might lead to a surprise day off or a shift from physical practice to film review. This prevents mass overtraining and injury clusters.
In knowledge work or high-stakes professions (like surgeons, pilots, or financial traders), the principle is similar. While individual data must remain private, educating a team on the science of resilience creates a shared language. A team leader, aware of their own dashboard, might model healthier behaviors by not sending late-night emails, encouraging breaks, or promoting mindfulness practices. The result is a team that collectively manages its energy, reduces burnout, and sustains high performance. The shift is from glorifying "hustle at all costs" to strategically managing the human capacity for focused work. Understanding this broader impact is part of our mission to enhance human performance holistically.
With such powerful insights, it’s crucial to establish boundaries. The Daily Performance Dashboard is an exceptional tool for guidance, but it is not an oracle, a doctor, or a judge. Misinterpretation can lead to orthosomnia (an unhealthy obsession with perfect sleep data) or performance anxiety centered on the metrics themselves.
HRV is Not a Single-Player Game. It reflects the total load on your system, but it cannot pinpoint the exact source of that load without your contextual input. A low score could mean you’re fighting a virus, are emotionally heartbroken, dehydrated, or simply in a deep training adaptation phase. The number gives you the "what"; your mindful self-inquiry provides the "why."
It is Deeply Individual. Comparing your absolute HRV number to a friend’s or an online forum average is meaningless and often discouraging. Genetics play a huge role in baseline values. A person with a baseline of 30 ms can be incredibly healthy, while someone with a baseline of 100 ms can be overtrained. The only valid comparison is you against your own historical data.
It Can Create Noise. There will be daily fluctuations you cannot explain. The human body is complex. It’s important to develop a healthy relationship with the data, viewing it as a helpful guidepost, not a punitive scorecard. On days with unexplained dips, the best practice is often to simply acknowledge it ("My body is asking for something") and choose gentle recovery, rather than spiraling into diagnostic overanalysis.
It is Not a Medical Device. While it can show trends that may warrant a doctor’s visit, a smart ring is not FDA-cleared to diagnose, treat, or prevent any disease. It is a wellness and performance tool. Any persistent, concerning health trend should be discussed with a healthcare professional, bringing your data as a helpful log of your subjective experience. For common questions on the limits and use of this technology, please refer to our detailed FAQ.
Knowledge is only power when applied. Here is a concrete 30-day plan to move from learning to living with your Daily Performance Dashboard.
Days 1-7: The Observation Phase.
Days 8-21: The Correlation Phase.
Days 22-30: The Intervention Phase.
By the end of 30 days, the dashboard will have transformed from a novel gadget into an integrated part of your self-awareness toolkit. You will have begun the journey from being ruled by external schedules and vague feelings to being guided by internal, biological intelligence. For ongoing support and new ideas as you progress, our blog is continually updated with user stories and protocol deep-dives.
The Future of the Dashboard: Where Personalized Biometrics Are Headed
The evolution of the Daily Performance Dashboard has just begun. The current synthesis of HRV, sleep, and activity is powerful, but the future holds even more personalized, predictive, and proactive potential.
Multi-Sensor Fusion: The next generation will incorporate data from continuous glucose monitors (CGM), which would show how different foods affect your metabolic stress and, consequently, your HRV. Coupling this with HRV creates a powerful duo for nutritional personalization.
Advanced Biomarkers: Future wearables may non-invasively track key blood biomarkers like cortisol (the stress hormone), CRP (inflammation), and electrolytes, providing an even more detailed picture of your internal state and its reflection in your HRV.
AI-Powered Personalization: Instead of generic advice, artificial intelligence will analyze your unique data patterns—your sleep, HRV, activity, menstrual cycle, and tags—to provide hyper-personalized recommendations. It might say: "Based on your 12% HRV drop after client meetings and your current low baseline, I recommend a 15-minute walk in nature before your 3 PM call today, and schedule the follow-up work for tomorrow morning."
True Predictive Analytics: The dashboard will move from showing your current readiness to forecasting your readiness. By analyzing patterns, it could alert you: "Your trend suggests high burnout risk in 10-14 days if current load continues. Suggested action: Schedule two recovery days next week."
This future is not about more data for data’s sake; it’s about clearer, more actionable insight. It’s about the dashboard fading into the background, providing gentle, anticipatory nudges that keep your most complex system—you—operating in its optimal zone. At Oxyzen, we are committed to being at the forefront of this responsible innovation, always focusing on empowering the user with clarity, not complexity.

Understanding the theory is one thing; seeing it transform real lives is another. Let's move from the conceptual to the concrete with a series of anonymized case studies that illustrate the profound, practical impact of making HRV the central metric of one's daily dashboard.
Case Study 1: The Overtrained Marathoner
*Sarah, 38, was deep into training for her third marathon. Despite following a popular online plan to the letter, she was constantly fatigued, irritable, and her last two long runs had been a struggle. Her sleep was fragmented. She attributed it all to "hard training." Upon getting a smart ring, her baseline HRV was revealed to be in the 20s (ms), with a clear downward trend over her first week of tracking. Her Resting Heart Rate was 10 BPM above her normal. After a particularly hard interval session, her HRV crashed and stayed low for four days—a classic sign of non-functional overreaching. The data was irrefutable. With this insight, she took an unplanned "reboot" week: only walking, yoga, and extra sleep. By day five, her HRV not only rebounded but climbed to a new baseline in the 40s. She resumed training at 80% volume, using her morning HRV reading to decide between a tempo run or a recovery day. She not only completed her marathon but set a personal best, feeling stronger than ever. "The ring didn't train for me," she said. "It told me when my body was actually ready to train."*
Case Study 2: The Burnt-Out Executive
David, 52, a tech startup CFO, operated in a perpetual state of "busy." He survived on 6 hours of sleep, endless coffee, and weekend crash sessions. He felt "fine," equating stress with importance. His initial HRV readings were shockingly low, with high variability from night to night—a sign of a nervous system in chaos. The "aha" moment came when he tagged a day with "Board Meeting." The subsequent HRV dip was the largest he'd seen, and it took three days to recover. The dashboard quantified the hidden cost of his leadership role. He started using his morning score to block his calendar: "Red" days were for internal work and deferred decisions; "Green" days were for external meetings and strategic pushes. He instituted a strict 9 PM device curfew, which improved his deep sleep and, within three weeks, raised his HRV baseline by 30%. "I'm working fewer perceived hours, but my output and clarity are higher. I finally understand what 'working smarter' means," he shared. His story is one of many highlighting the shift from hustle culture to sustainable performance, a theme we explore further in our blog on executive wellness.
Case Study 3: The Perimenopausal Professional
*Maria, 47, began experiencing unexplained fatigue, brain fog, and night sweats. Her doctor told her it was "just perimenopause" and to manage stress. Frustrated, she turned to her biometric data. By tracking her HRV alongside her cycle and symptoms, a clear pattern emerged: her HRV would plummet and her resting heart rate would spike in the 10 days before her period, coinciding with her worst cognitive symptoms. This objective data empowered her to return to her doctor with a precise log. It also allowed her to adapt her life. She now blocks her calendar for deep-focus work during her high-HRV follicular phase and schedules administrative tasks and client check-ins for her lower-HRV luteal phase. She uses evening breathwork to mitigate the pre-sleep arousal that was crushing her sleep scores. "The data gave me back a sense of control and understanding. It's not 'all in my head'; it's in my nervous system, and I can work with it," she explained. Her journey is a powerful example of using technology to navigate a major life transition with agency.*
These cases underscore a universal truth: the Daily Performance Dashboard excels at making the invisible visible. It converts subjective suffering—fatigue, burnout, confusion—into objective, manageable patterns. For more real-world transformations, the Oxyzen testimonials page is filled with such stories of empowerment.
Your dashboard is only as good as its primary sensor. The market is flooded with wearables claiming to measure HRV, but accuracy, consistency, and user experience vary wildly. Here’s a guide to choosing and optimizing your device.
Key Considerations for Your Wearable:
Choosing the right tool is the first step in a committed partnership with your own biology. It’s an investment in self-knowledge. For a detailed comparison of technologies and what makes our approach unique, you can learn more on our about page.
The Mindset Shift: From Ignorance to Agency, Without Obsession
Implementing a Daily Performance Dashboard requires a fundamental mindset shift. It’s a journey from operating on assumptions and societal "shoulds" to making decisions based on personalized, biological feedback. This journey has distinct stages, and navigating them successfully is key to long-term benefit.
Stage 1: Ignorance & Guesswork. You operate on caffeine, willpower, and vague feelings. Performance and health are erratic.
Stage 2: Awareness & Curiosity. You start tracking. You see the numbers, notice patterns, and begin asking "why?" This stage can be thrilling as you gain initial insights.
Stage 3: Data-Driven Agency. You confidently use the data to guide decisions. You reschedule a workout, decline a late-night social event, or prioritize sleep before a big day—all without guilt, because the data supports the choice. Your actions are aligned with your capacity. This is the sweet spot.
Stage 4: The Pitfall – Data Obsession. A potential derailment is becoming overly attached to the numbers. Checking the app incessantly, feeling anxiety over a single dip, or letting the score dictate your self-worth. This turns a tool for freedom into a source of stress, ironically lowering your HRV.
Cultivating a Healthy Data Relationship:
The ultimate goal is informed intuition. After a year of tracking, you may find you can often guess your score within a few points based on how you feel. The dashboard has trained your self-awareness. At that point, the tool becomes a periodic check-in system, a trusted advisor rather than a daily crutch. This balanced approach is core to the philosophy behind Oxyzen—technology should enhance human experience, not dominate it.
Integrating with Professional Care: A Tool for Doctors and Coaches
The Daily Performance Dashboard is not meant to replace professional healthcare; it is designed to augment it. When used responsibly, it can create a powerful partnership between an individual and their doctor, therapist, or coach, providing objective data that bridges the gap between subjective reports and clinical assessment.
For Physicians & Functional Medicine Practitioners: A patient presents with chronic fatigue. Instead of relying solely on memory, they can share a 90-day trend of their HRV, sleep, and RHR. A graph showing a persistent, suppressed HRV despite adequate sleep is a powerful diagnostic clue, pointing toward adrenal dysregulation, systemic inflammation, or another underlying issue. The data helps target lab tests (e.g., cortisol, thyroid, CRP) and provides a baseline to measure the effectiveness of a treatment protocol. As the patient implements dietary changes, stress management, or supplements, rising HRV trends offer early, positive feedback that the intervention is working.
For Therapists & Mental Health Professionals: Clients with anxiety or PTSD often live in a state of sympathetic hyperarousal. HRV biofeedback is a proven therapeutic tool. By using a wearable, clients can practice breathing or grounding techniques in session and see their HRV rise in real-time on their phone screen, creating a powerful somatic connection between the practice and calm. They can then track how daily mindfulness practice affects their nocturnal HRV trend, reinforcing adherence. The data objectifies progress in a realm that often feels subjective.
For Athletic Coaches & Personal Trainers: Sharing readiness data (with athlete permission) revolutionizes program design. A coach can see that an athlete hasn't recovered from Tuesday's session, so Thursday's high-intensity workout is automatically swapped for active recovery. This prevents overtraining and builds trust. It moves the coaching relationship from a top-down authority model to a collaborative partnership based on the athlete's unique biological responses.
The Protocol for Collaboration:
This collaborative model represents the future of proactive health and performance management. For professionals interested in how to integrate this data into their practice, we provide resources and support—you can reach out via our contact page.
The Ethical Dimension: Privacy, Data Sovereignty, and the Human Future
As we invite these intimate devices into our lives, collecting our most personal biological rhythms, ethical considerations must be at the forefront. Who owns your sleep data? Your stress patterns? Your fertility window? The promise of the dashboard comes with the responsibility of data stewardship.
As a User, Your Responsibilities Include:
The mission of companies in this space must be to build tools that enhance human autonomy, not undermine it. At Oxyzen, we are committed to these principles, believing that technology should be a bridge back to our own biological wisdom, not a wall. You can read more about our commitments in our privacy policy and our story.
Your HRV is not static. It is a dynamic reflection of your life’s journey. Understanding how it naturally fluctuates across different life stages allows you to use your dashboard with appropriate context and self-compassion.
In Your 20s & 30s: This is often the era of building career, family, and pushing physical limits. HRV can be highly variable, reacting sharply to late nights, intense training, and new stressors. The dashboard is a crucial tool for establishing healthy baselines and learning your personal stress signatures before bad habits become entrenched.
In Your 40s & 50s: This period often brings peak career responsibility alongside perimenopause/menopause for women and andropause for men. Natural, age-related declines in HRV baseline may begin, but lifestyle factors dominate. This is the most critical time to use the dashboard for prevention. Monitoring trends can help you navigate hormonal shifts, manage mid-life stress, and proactively protect cardiovascular and metabolic health.
In Your 60s and Beyond: The focus often shifts from performance optimization to healthspan and vitality maintenance. A stable or gently declining HRV is expected, but a sharp drop is still a vital warning sign. The dashboard becomes a tool for monitoring the effectiveness of healthy aging practices—like strength training, social connection, and cognitive exercise—on maintaining autonomic nervous system flexibility. It can provide early signals that warrant a check-in with a physician.
Through Major Life Events: Your dashboard will objectively capture the physiological toll and recovery from events like having a child, grieving a loss, undergoing surgery, or retiring. Seeing a long-term dip during a difficult period can normalize the experience ("No wonder I feel this way"), while observing the slow climb back to baseline can provide hope and confirm that your recovery practices are working.
This lifelong perspective frames HRV tracking not as a short-term biohack, but as a long-term dialogue with your body. It’s a practice of listening, responding, and adapting—a central thread of self-care woven through the decades. It empowers you to meet each season of life with the appropriate resources and resilience.
Conclusion of This Portion: Your Data-Powered Journey Begins
We have journeyed from the fundamental science of a single heartbeat interval to its implications for a lifetime of health and performance. We’ve explored how Heart Rate Variability, once an obscure medical metric, can now sit at the center of a personalized, actionable Daily Performance Dashboard—a dashboard that tells the truth about your recovery, your readiness, and your resilience.
The promise of this technology is not a life of perfect scores, but a life lived with greater alignment. Alignment between your effort and your capacity. Between your lifestyle and your long-term health goals. Between your conscious mind and the silent, intelligent systems of your body that work tirelessly to keep you alive and thriving.
This journey begins with a single step: the decision to listen. To trade guesswork for guidance, and assumption for awareness. The tools are here, on your finger and in your pocket, waiting to transform the invisible rhythms of your heart into a clear map for living well.
Your next step is to begin. Start observing. Start tagging. Start experimenting. Learn what a green light day truly feels like in your body. Respect the yellow and red lights as the protective signals they are. Build your resilience not through force, but through intelligent, responsive practice.
The dashboard is ready. The central metric is waiting. The rest of your data-powered journey awaits.
Your Trusted Sleep Advocate (Sleep Foundation — https://www.sleepfoundation.org/)
Discover a digital archive of scholarly articles (NIH — https://www.ncbi.nlm.nih.gov/
39 million citations for biomedical literature (PubMed — https://pubmed.ncbi.nlm.nih.gov/)
experts at Harvard Health Publishing covering a variety of health topics — https://www.health.harvard.edu/blog/)
Every life deserves world class care (Cleveland Clinic -
https://my.clevelandclinic.org/health)
Wearable technology and the future of predictive health monitoring. (MIT Technology Review — https://www.technologyreview.com/)
Dedicated to the well-being of all people and guided by science (World Health Organization — https://www.who.int/news-room/)
Psychological science and knowledge to benefit society and improve lives. (APA — https://www.apa.org/monitor/)
Cutting-edge insights on human longevity and peak performance
(Lifespan Research — https://www.lifespan.io/)
Global authority on exercise physiology, sports performance, and human recovery
(American College of Sports Medicine — https://www.acsm.org/)
Neuroscience-driven guidance for better focus, sleep, and mental clarity
(Stanford Human Performance Lab — https://humanperformance.stanford.edu/)
Evidence-based psychology and mind–body wellness resources
(Mayo Clinic — https://www.mayoclinic.org/healthy-lifestyle/)
Data-backed research on emotional wellbeing, stress biology, and resilience
(American Institute of Stress — https://www.stress.org/)

