The Silent Messenger: How Health Tracking Technology Decodes Your Heart's Hidden Language

Imagine a vital sign more revealing than your resting heart rate, more sensitive than your blood pressure, and more personal than your step count. It’s a metric that can whisper warnings of impending stress, sing praises of your recovery, and provide a real-time window into the balance of your entire nervous system. This is Heart Rate Variability (HRV), the subtle, millisecond variation between each heartbeat. For decades, it was a secret known only to cardiologists and elite sports physiologists, measured in clinical labs with cumbersome electrodes. Today, it’s a feature on your wrist, on your finger, and in your pocket.

The democratization of HRV is one of the most significant leaps in personal health technology. We’ve moved from a world of annual check-ups to one of continuous, intimate biofeedback. But this shift raises a critical question: Can the sleek device on your finger truly measure something as nuanced as HRV with clinical accuracy? The answer is a fascinating journey through physics, physiology, and cutting-edge software—a story of how consumer technology is not just simplifying, but revolutionizing, access to deep health insights.

This article is your deep dive into that very question. We will unravel the complex science behind the simple reading, exploring exactly how modern health trackers capture, calculate, and interpret your HRV. From the photoplethysmography (PPG) sensors in smart rings and watches to the proprietary algorithms that clean the signal, we’ll demystify the process. You’ll learn why accuracy isn't just about hardware, but about context, consistency, and intelligent interpretation. By understanding the "how," you can finally harness the "why"—transforming this esoteric data point into a powerful tool for managing stress, optimizing performance, and truly listening to what your body has to say. For a deeper exploration of how this technology integrates into daily life, you can always discover how Oxyzen works in our detailed guides.

The Rhythm of Resilience: What HRV Is and Why It’s Your Ultimate Biofeedback Tool

To appreciate how technology measures HRV, we must first understand what it is we’re measuring. Contrary to popular belief, a healthy heart is not a metronome. It’s a dynamic, responsive symphony. Heart Rate Variability is the natural variation in time intervals between consecutive heartbeats, measured in milliseconds. If your heart beats at 60 beats per minute, it’s not beating exactly once every second. The intervals might be 0.95 seconds, then 1.05 seconds, then 0.98 seconds. This variability is not an error; it’s a sign of health.

At its core, HRV is a direct proxy for your autonomic nervous system (ANS)—the unconscious control center regulating your digestion, respiration, and, crucially, your heart. The ANS has two primary branches engaged in a constant, delicate tug-of-war:

  • The Sympathetic Nervous System (SNS): Your "fight or flight" system. It mobilizes energy, increases heart rate, and prepares you for action. It decreases HRV.
  • The Parasympathetic Nervous System (PNS): Your "rest and digest" system. It conserves energy, promotes recovery, and slows the heart. It increases HRV.

A high HRV typically indicates a strong, resilient parasympathetic influence and a flexible nervous system that can adapt smoothly to stress and recover effectively. A low HRV can suggest sympathetic dominance, often associated with stress, fatigue, overtraining, or illness. However, context is everything—HRV is highly individual. Comparing your number to someone else’s is meaningless. The power lies in tracking your own trends over time.

Why has this metric exploded in popularity? Because it’s profoundly actionable. It moves beyond simple activity tracking into the realm of readiness and resilience.

  • For the Athlete: HRV can guide training intensity. A sudden drop may signal insufficient recovery, suggesting a light day instead of a hard session, thus preventing overtraining.
  • For the Stressed Professional: Morning HRV can be a mirror of your previous day’s stress load and sleep quality, offering objective data to justify meditation, an early night, or a walk in nature.
  • For the Health-Conscious Individual: Tracking long-term trends can reveal the impact of lifestyle changes—whether a new diet, consistent sleep schedule, or mindfulness practice is genuinely improving your nervous system balance.

The journey from this clinical understanding to a nightly reading on your smartphone is a marvel of modern engineering. It begins with a fundamental choice: how to detect the heartbeat itself.

Beyond the EKG: The Rise of Optical Heart Rate Monitoring

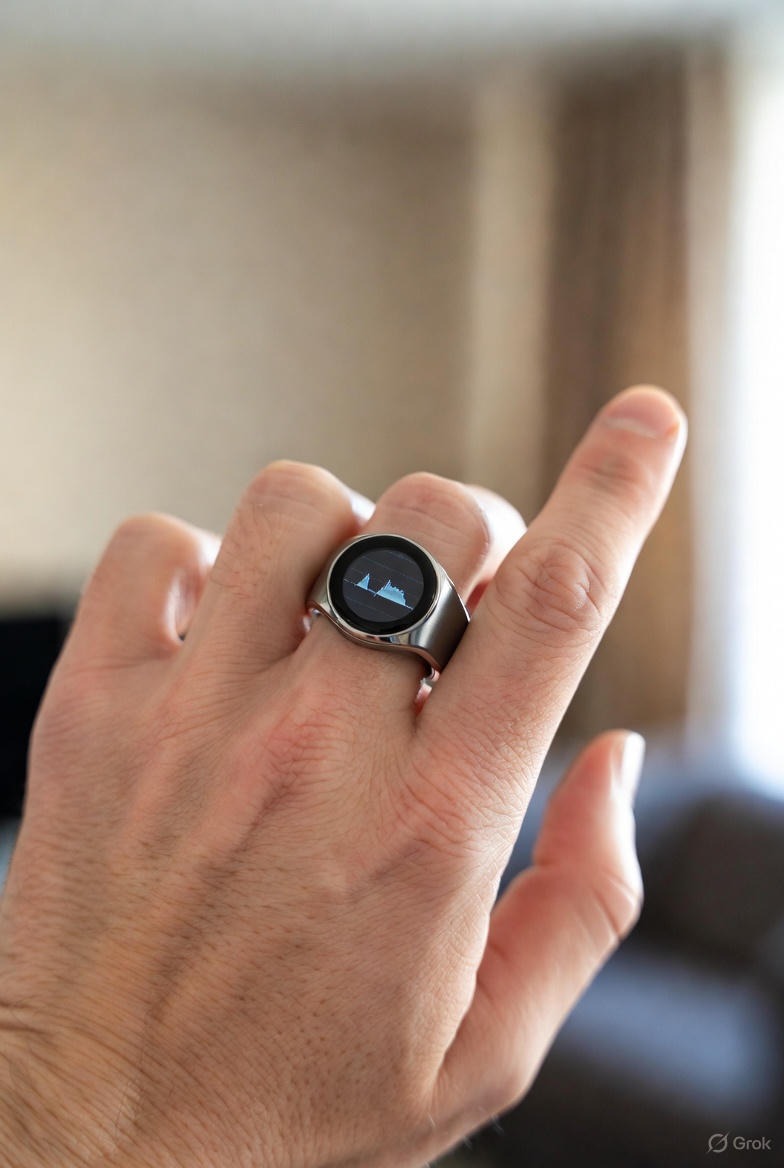
The gold standard for measuring HRV is an electrocardiogram (EKG or ECG). It uses electrodes placed on the skin to detect the tiny electrical impulses that trigger each heartbeat. This method is highly accurate for timing each beat but is impractical for continuous, all-day wear. Enter photoplethysmography (PPG), the technology that powers virtually every consumer health tracker, from smartwatches to smart rings like the Oura or our own Oxyzen ring.

PPG is deceptively simple in principle. A small LED (usually green light, sometimes red or infrared) shines into the skin. A photodetector opposite the LED measures the amount of light that is reflected back. Here’s the key: blood absorbs light more effectively than surrounding tissue. With each heartbeat, a pulse of blood surges through your capillaries, momentarily increasing blood volume in the area. This absorbs more light, causing a slight dip in the amount of light reflected back to the sensor. The interval between these dips corresponds to your heart rate, and the subtle timing differences between them form the basis for calculating HRV.

The wrist and the finger present two very different environments for PPG sensors, which critically impacts data quality.

  • Wrist-Based PPG (Smartwatches): Convenient and popular, but challenged by motion artifact (the sensor moves with every hand gesture) and a less consistent blood flow. The bony wrist structure and tendons can make it harder to get a clean, strong signal, especially during activity.
  • Finger-Based PPG (Smart Rings): The finger, particularly the base, is rich in capillaries and has a consistent, strong blood flow. A ring form factor is also inherently more stable, minimizing motion noise. This is why many experts believe the finger is a superior location for continuous, passive PPG monitoring, especially for nocturnal HRV readings when you’re still. For a comparison of how different form factors approach wellness tracking, explore our blog for more insights.

But capturing the raw pulse wave is only the first step. The true magic—and the source of differentiation between devices—happens in the digital realm, where algorithms work tirelessly to find the signal in the noise.

The Algorithmic Cleanup: How Software Finds Your Heartbeat in a Sea of Noise

A raw PPG signal is messy. It’s contaminated by a symphony of interference known as "artifact":

  • Motion Artifact: The biggest culprit. Walking, typing, gesturing, even shivering can cause blood flow changes and sensor movement that drown out the heart's signal.
  • Environmental Artifact: Changes in ambient light sneaking under the device.
  • Physiological Artifact: Blood flow changes from temperature shifts, respiration, or even subtle changes in how the device is worn.

This is where sophisticated proprietary algorithms come into play. They act as a digital sieve, filtering out the garbage to isolate the true cardiac rhythm. The process typically involves:

  1. Signal Acquisition: The sensor collects raw optical data hundreds of times per second.
  2. Pre-processing: Initial filters remove high-frequency noise (like electrical interference) and very low-frequency drift (like slow changes in blood volume).
  3. Peak Detection: The algorithm scans the smoothed waveform to identify the precise moment of each heartbeat's peak (the "I-beat" or pulse peak). This requires immense precision, as an error of just 10 milliseconds can significantly skew HRV calculations.
  4. Artifact Rejection: This is the core of the intelligence. Using machine learning models trained on vast datasets, the algorithm identifies patterns that don't match a plausible heartbeat. A sharp spike from a hand clap is flagged and discarded. Some advanced systems even use accelerometer data (to detect motion) in tandem with the optical signal to identify and subtract motion-based noise.
  5. Interpolation: If a beat is deemed too corrupted, the algorithm may intelligently "fill in the gap" based on surrounding clean data to maintain a continuous record.

The outcome of this digital cleanup is a series of timestamps for each valid heartbeat—a "beat-to-beat" or "RR interval" series. This series is the pure, time-stamped raw material from which HRV is derived. The relentless focus on this algorithmic refinement is central to our mission at Oxyzen, as detailed in our story of innovation and vision.

From Beat to Metric: The Mathematical Language of HRV

With a clean RR interval series in hand, the device now faces a mathematical question: How do you quantify variability? The HRV you see in your app is not a direct measurement but a statistical summary of the interval series. Different metrics emphasize different aspects of the variability, and understanding them is key to interpreting your data.

The most common metrics derived from consumer devices fall into two categories: Time-Domain and Frequency-Domain. Most consumer apps simplify this by presenting one primary score, often a time-domain metric.

Time-Domain Metrics: These are calculated directly from the intervals between beats.

  • RMSSD (Root Mean Square of Successive Differences): This is arguably the most important and commonly reported HRV metric in consumer health tech. It calculates the square root of the average of the squares of the differences between adjacent RR intervals. In simpler terms, it’s especially good at capturing short-term, beat-to-beat variability, which is heavily influenced by the parasympathetic (rest-and-digest) nervous system. It’s robust and well-suited for shorter measurement periods (like a 5-minute reading or overnight average).
  • SDNN (Standard Deviation of NN Intervals): The standard deviation of all normal RR intervals. This reflects overall variability and is influenced by both sympathetic and parasympathetic branches. It’s more meaningful over longer periods (like 24 hours) and is a strong predictor of cardiovascular health in clinical settings.
  • pNN50: The percentage of adjacent RR intervals that differ by more than 50 milliseconds. A higher percentage suggests stronger parasympathetic activity.

Frequency-Domain Metrics: These use power spectral analysis to break down the heart rhythm into its constituent frequency "waves," like separating a chord into individual musical notes. The main bands are:

  • High Frequency (HF): (0.15-0.4 Hz) Linked to parasympathetic activity and respiration (respiratory sinus arrhythmia).
  • Low Frequency (LF): (0.04-0.15 Hz) A more complex mix of sympathetic and parasympathetic influences, also related to blood pressure regulation.
  • Very Low Frequency (VLF) & Ultra-Low Frequency (ULF): Related to longer-term regulatory processes.

Most consumer devices, for simplicity and to preserve battery life, focus on time-domain metrics like RMSSD for your daily score. The device’s firmware performs these complex calculations locally or sends the interval data to a companion app where the math is done. The result is that single, often confusing, number that holds so much meaning.

The Critical Window: Why Nighttime Is the Gold Standard for HRV Tracking

If you take a reading while checking email, walking the dog, or after a cup of coffee, your HRV will be chaotic and nearly meaningless. Context controls the signal. This is why the best practice, and the method adopted by leading devices, is to measure HRV during a standardized, controlled state. For daily trending, no state is more controlled than sleep.

Measuring HRV during sleep, particularly during deep non-REM sleep, provides the ideal physiological baseline. During sleep:

  • Consistency is Achieved: You are physically still (minimizing motion artifact), fasted, and in a predictable postural position.
  • External Influences Are Minimized: Cognitive stress, digestion, and voluntary movement are absent.
  • The Parasympathetic System Dominates: Especially during deep sleep, allowing for a clear reading of your recovery-centric nervous system activity.

A device like a smart ring is uniquely positioned for this. Worn overnight, it can passively collect thousands of data points across all sleep stages. The software then typically calculates an average HRV for the entire night, or for specific stable segments (like your longest deep sleep period). This nightly average becomes your baseline datum. Day-to-day fluctuations in this number—a drop of 10-20% or more—are what hold actionable insight, suggesting your body is under some form of strain (training, emotional stress, illness onset).

This focus on nocturnal measurement transforms HRV from a spot-check curiosity into a longitudinal trend. You’re not looking at a single point, but at a moving average of your physiological resilience. This foundational philosophy guides the design of devices focused on recovery, and you can read our complete guide to understanding these nightly biomarkers.

The Consistency Imperative: Why Your Ring Finger Is a Data Goldmine

Accuracy in HRV tracking isn't just about a single perfect reading; it's about consistent comparability from day to day. You need to know that a change in your number is due to your physiology, not a change in measurement conditions. This is where wearability and sensor placement become paramount.

The finger, as a measurement site, offers inherent advantages for consistency:

  1. Consistent Anatomy: The vascular bed at the base of the finger is relatively uniform from person to person and stable on the same person over time.
  2. Stable Placement: A well-fitted ring sits snugly on a specific part of the finger. Unlike a watch that can slide up and down the wrist or be worn loosely, a ring maintains a more constant pressure and position relative to the capillaries. This reduces day-to-day measurement variance caused by device placement.
  3. Reduced Motion Artifact: During key measurement periods (sleep, seated rest), the hands and fingers are naturally still. Even during the day, finger motion is generally less frequent and impactful than the complex, multi-axis movements of the wrist.

This consistency allows the algorithms to work with a more predictable signal. When the hardware provides a stable foundation, the software can focus on fine physiological details rather than compensating for large positional shifts. It turns the finger into a dedicated, always-on bio-data port. Achieving this level of consistent, user-friendly monitoring is a core challenge we embrace, as outlined in our company's mission and values.

The Human Factor: How Physiology and Behavior Influence the Signal

Even with perfect technology, HRV is not a number generated in a vacuum. It is deeply personal and influenced by a myriad of factors that users must understand to interpret their data wisely. A drop in HRV isn't an alarm bell; it's a question. The technology provides the question, and your lifestyle provides the context for the answer.

Expected Influences That Lower HRV:

  • Intense Physical Training: The purpose of training is to create manageable stress. A temporary HRV dip post-workout is normal and expected; a failure to rebound indicates poor recovery.
  • Psychological Stress: Deadlines, arguments, and anxiety can create a similar physiological strain as physical exercise.
  • Poor Sleep Quality or Short Sleep Duration: Perhaps the most direct correlate. Fragmented sleep severely blunts the parasympathetic recovery reflected in HRV.
  • Illness or Infection: Your body diverts resources to the immune system, often lowering HRV days before symptoms appear.
  • Alcohol Consumption: Alcohol disrupts sleep architecture and is a direct nervous system depressant, reliably lowering next-day HRV.
  • Digestion: A large meal, especially before a measurement period, can shift blood flow and lower HRV.

Expected Influences That May Raise HRV:

  • Adequate Recovery: Quality sleep, rest days, and relaxation practices.
  • Consistent Meditation or Breathwork: Practices like coherent breathing (5-6 breaths per minute) can directly stimulate the vagus nerve and boost parasympathetic tone.
  • Good Hydration and Nutrition: Providing the raw materials for cellular repair and function.
  • Positive Social Connection and Mindfulness: States of safety and contentment promote the "rest and digest" mode.

The most advanced platforms don't just show you your HRV number; they provide a space for you to log these very factors—training, stress, nutrition, alcohol. Over time, you can begin to see your unique, personalized correlations. This transforms the device from a tracker into a coach.

Bridging the Gap: Clinical Validation and the Quest for Medical-Grade Accuracy

The million-dollar question for the health-tech industry is: How do these convenient PPG-based measurements stack up against the clinical gold standard of an EKG? The answer is found in validation studies.

Reputable manufacturers invest in and publish peer-reviewed studies where participants wear both the consumer device (like a smart ring or watch) and a medical-grade EKG holter monitor simultaneously. The data is compared to assess metrics like:

  • Bias: Is the PPG device consistently over- or under-estimating the EKG value?
  • Limits of Agreement: What is the range of error for most measurements?
  • Correlation: How strongly do the trends from the PPG device follow the trends from the EKG?

The consensus from rigorous studies is encouraging. For nocturnal, resting HRV measurements (like RMSSD), modern PPG devices, particularly those in a stable form factor like a ring, show high correlation and acceptable agreement with EKG. They are excellent tools for tracking relative changes and trends in an individual's HRV over time, which is precisely their intended use case.

However, it is crucial to understand the limits:

  • Not a Medical Diagnostic Device: No consumer tracker is FDA-cleared to diagnose arrhythmias like atrial fibrillation based on HRV (though some have specific EKG features for that purpose). They are for "general wellness" and lifestyle insight.
  • Dynamic Situations: Accuracy can decrease during high-intensity exercise where motion artifact is extreme. HRV during activity is also physiologically complex and less commonly used.
  • Individual Variation: Skin tone, tattoo ink, perfusion, and finger/hand temperature can theoretically affect PPG signal quality, though advanced multi-wavelength sensors aim to mitigate this.

The goal is not to replicate a lab EKG on your finger, but to provide a valid, reliable, and actionable trend line for personal health optimization. For common questions on accuracy and use, our FAQ and support section provides detailed answers.

From Data to Wisdom: Interpreting Your HRV Trends for Actionable Insight

A number without interpretation is noise. The final and most critical layer of technology is the app ecosystem that translates your HRV data into personalized insight. This is where raw biophysics becomes practical wellness.

Modern platforms use several methods to make your HRV meaningful:

  1. Baseline Establishment: Over the first few weeks of use, the app learns your normal range. It calculates a rolling baseline (often a 3-4 week average). All daily readings are then interpreted relative to this personal baseline.
  2. Trend Analysis: The app doesn't just look at today's number. It analyzes the direction and steepness of change. A single low reading may be a blip; three consecutive dropping readings are a trend worthy of attention.
  3. Contextual Integration: The best systems don't show HRV in isolation. They present it alongside other relevant data: sleep score, resting heart rate, respiratory rate, and body temperature. Seeing that a low HRV coincides with a high resting heart rate and poor sleep score creates a much stronger, multi-faceted picture of systemic strain.
  4. Readiness or Recovery Scores: Many devices synthesize HRV and other metrics into a single, simple "Readiness" or "Recovery" score (e.g., out of 100). This is a heuristic—an educated algorithm that weighs the various inputs to give a straightforward recommendation: "Push hard today," or "Focus on recovery."
  5. Personalized Tagging: As mentioned, allowing you to log behaviors (alcohol, late meal, intense workout, sick) creates a feedback loop. Over time, you may receive insights like: "On days after you log alcohol, your HRV is 15% lower on average."

This transformation—from millisecond intervals to a clear message like "Consider a lighter workout today"—is the ultimate promise of the technology. It externalizes your internal state, giving you a chance to make conscious, data-informed choices that support your body's needs. For real-world examples of how this impacts users, explore the real customer reviews and experiences shared by our community.

The Evolution of Precision: Multi-Wavelength PPG and Sensor Fusion

The frontier of wearable sensing is moving beyond the single green LED. To tackle remaining challenges like signal loss during low perfusion (cold hands, poor circulation) or more accurately parsing blood constituents, advanced devices are incorporating multi-wavelength PPG and sensor fusion.

Multi-Wavelength PPG: This involves using different colors of light that penetrate tissue and interact with blood in distinct ways.

  • Green Light (~500-600nm): Excellent for detecting heart rate at the capillary level. It's the standard workhorse but can be more susceptible to motion.
  • Red Light (~600-750nm) & Infrared (IR) Light (~850-1000nm): These longer wavelengths penetrate deeper into tissue. They are better at tracking blood oxygen saturation (SpO2) and can be more reliable in situations where green light fails, such as with darker skin tones or during low peripheral perfusion. By using multiple wavelengths simultaneously, the device can cross-verify the signal and choose the clearest one, or even combine them for a more robust reading.

Sensor Fusion: This is the practice of combining data from multiple physical sensors to create a more accurate picture than any one sensor could alone. A prime example relevant to HRV is fusing the PPG optical sensor with a 3-axis accelerometer.

  • The accelerometer detects precise movement of the limb.
  • The algorithm uses this movement data to identify and subtract motion-related noise from the PPG signal in real-time. It can essentially say, "This spike in the optical data happened at the exact millisecond the hand jerked; therefore, it is likely motion artifact, not a heartbeat."

The combination of multi-wavelength PPG and sophisticated sensor fusion represents the cutting edge, pushing consumer devices closer than ever to providing medical-grade data in a seamless, user-friendly package. This relentless pursuit of precision is at the heart of the innovation you can learn more about on our homepage.

The Future Beat: Where HRV Technology Is Heading Next

The journey of HRV tracking is far from over. We are on the cusp of a new era where this metric will become even more integrated, predictive, and personalized. Several exciting frontiers are emerging:

  • Continuous, Real-Time HRV: Moving beyond a single nightly score to true real-time streaming. Imagine a gentle vibration on your ring when your HRV dips during a stressful meeting, prompting you to take a mindful breath. This would close the biofeedback loop instantly.
  • Predictive Health Analytics: With machine learning analyzing long-term HRV trends alongside other biomarkers (temperature, respiration, sleep), devices may move from describing your current state to predicting future ones. Subtle, long-term declines in HRV could be correlated with general wellness trends, prompting early lifestyle interventions.
  • Deep Neural Network Analysis: Instead of just calculating RMSSD, future algorithms may use deep learning to analyze the entire, complex morphology of the PPG waveform itself, extracting dozens of subtle "digital biomarkers" related to vascular health, stress response, and more that are currently invisible.
  • Enhanced Personalization: Algorithms will become so personalized they won't just know your baseline, but will understand your unique response patterns. "For you, a 30-minute intense run causes an HRV drop that recovers in 24 hours. For you, it takes 36 hours."

The mission remains constant: to give individuals an intimate, accurate, and actionable understanding of their own physiology. To turn the silent, rhythmic language of the heart into a conversation we can all understand and learn from. The technology measuring HRV is not just a feat of engineering; it's a bridge to greater self-knowledge and a more responsive, resilient life. To follow this ongoing journey of discovery and innovation, you are invited to explore our brand's founding story and vision for the future.

Mastering Your Baseline: The Foundational Step for Personal HRV Insights

Your HRV number is meaningless in isolation. A score of 50 ms could be excellent for one person and dangerously low for another. Age, genetics, fitness level, and even gender create wide natural variations. This is why the most important phase of using any HRV tracker isn't the first week of data—it's the first month.

Establishing a robust personal baseline is a process of calibration, where your device learns the unique rhythm of your nervous system. During this period, typically 3 to 4 weeks, the algorithm collects your nocturnal HRV readings under various, normal-life conditions: after easy days, hard workouts, stressful workdays, and relaxed weekends. It uses this data to calculate your personal range—often expressed as a rolling average or a "normal zone."

How to Approach Your Baseline Period:

  1. Live Normally: Do not try to "optimize" your life to produce perfect scores. The goal is to capture your authentic, varied rhythm. Eat, train, work, and socialize as you typically would.
  2. Prioritize Consistency in Measurement: Wear your device every night, ensure it's charged, and aim for consistent sleep and wake times where possible. This gives the algorithm clean, comparable data points.
  3. Observe, Don't Judge: Resist the urge to analyze daily fluctuations during this phase. The noise will outweigh the signal. Your focus should be on forming the habit of wearing the device and perhaps logging basic lifestyle factors.

Once your baseline is set, the magic begins. Now, daily and weekly deviations become meaningful. The platform will likely present your data in one of two ways:

  • As a Deviation from Baseline: Showing your score as "+5" or "-12" relative to your personal average.
  • As a "Readiness" Percentage: Synthesizing your HRV deviation with other metrics (like resting heart rate and sleep) into a single score that indicates your body's preparedness for stress.

This personalized framework transforms HRV from an abstract statistic into your personal biometric compass. It answers the only question that matters: "Am I more or less resilient today than I normally am?"

The Pitfalls of Misinterpretation: Common HRV Tracking Mistakes to Avoid

Even with a perfect baseline, the path from data to wise action is littered with potential misunderstandings. The human tendency is to see a simple metric and desire a simple rule: "Higher is always better." But with HRV, this oversimplification can lead to anxiety and poor decisions—the exact opposite of its intended benefit.

Mistake #1: Chasing a High Number
The wellness culture often glorifies "biohacking" to optimize numbers. With HRV, this mindset is counterproductive. Artificially trying to push your HRV higher every day is like trying to force your nervous system to be perpetually in a state of deep relaxation. It’s not sustainable or healthy. Stress is a necessary and productive part of life. The goal is resilience—the ability to dip in response to stress and then efficiently recover, not to avoid dipping at all.

Mistake #2: Overreacting to a Single Low Reading
A single day's low HRV is rarely a cause for alarm. It could be due to a heavy meal before bed, a single night of poor sleep, or a minor, unnoticed stressor. The intelligent approach is to look for trends. Two or three consecutive days of a depressed HRV, especially when coupled with an elevated resting heart rate and poor sleep feedback, form a much stronger case for needing intentional recovery.

Mistake #3: Ignoring Contextual Logs
If you don't tell the app you had three glasses of wine, ran a marathon, or started a new medication, you are trying to interpret a puzzle with missing pieces. The correlation between these behaviors and your physiology is where the deepest learning occurs. Without logging, a low score is just a mystery. With logging, it becomes a lesson: "Ah, my system really needs two nights to recover from that level of intensity."

Mistake #4: Comparing Your Score to Others
This is the most fundamental error. HRV ranges vary dramatically. A supremely fit, young endurance athlete might have an RMSSD baseline of 100ms. A healthy, fit individual in their 50s might have a perfectly healthy baseline of 30ms. Comparing your 35 to a friend's 80 is physiologically meaningless and psychologically destructive. Your only valid comparison is you, yesterday, last week, and last month.

Mistake #5: Measuring at the Wrong Time
Taking a spot reading in the middle of a busy workday and expecting it to reflect your recovery status is a recipe for confusion. For daily trend tracking, trust the nightly, passive measurement. If you do use morning spot checks (a common practice with some chest straps), always do them immediately upon waking, before coffee, food, or looking at your phone, and maintain a consistent posture (usually seated).

Avoiding these pitfalls is the key to developing a healthy, productive relationship with your HRV data. It should serve you, not stress you. For more on developing this balanced approach, our blog offers numerous user guides and perspectives.

The Holistic Picture: Integrating HRV with Other Key Biomarkers

HRV is a powerful narrator, but it tells the richest story when it has a supporting cast. In isolation, a low HRV is ambiguous—it could mean you're getting sick, you're overcooked from training, or you're emotionally drained. When combined with other metrics, the picture comes into sharp focus. Modern wellness trackers, especially comprehensive devices like smart rings, measure a symphony of biomarkers that, together, provide a holistic view of your readiness.

The Core Quartet for Recovery Assessment:

  1. HRV: The primary indicator of autonomic nervous system balance and stress/recovery status.
  2. Resting Heart Rate (RHR): The number of times your heart beats per minute while at complete rest. Trend Relationship: Often, when HRV drops due to systemic strain (like illness or overtraining), RHR will rise. Seeing both move in this opposing direction is a strong, dual-signal that your body is under significant load.
  3. Sleep Quality & Duration: This is the primary input for recovery. A low HRV coupled with poor sleep score clearly points to sleep as a likely cause or contributor. Conversely, a great night's sleep with a still-low HRV might suggest the stressor is deeper (e.g., lingering inflammation).
  4. Body Temperature: Often measured as peripheral temperature or skin temperature from the wrist/finger. A sustained elevation in your nighttime temperature relative to your personal baseline is one of the earliest and most sensitive signs of physiological stress, including the onset of illness, menstrual cycle changes, or inflammatory response to heavy training.

Secondary Supporting Metrics:

  • Respiratory Rate: The number of breaths per minute during sleep. Like RHR, a sustained increase can be a subtle sign of strain or illness.
  • Activity & Workout Strain: The stress input from your day. This contextualizes the recovery data. A high HRV after a rest day is expected; a high HRV after a brutal workout is a sign of exceptional recovery capacity.

Advanced platforms don't just show these metrics in separate silos. They use algorithms to synthesize them into a unified picture. For example:

  • Scenario A: Low HRV + High RHR + Poor Sleep + Slightly Elevated Temp. This constellation strongly suggests your body is fighting something—perhaps an oncoming illness or severe overtraining. Recommendation: Rest, hydrate, prioritize sleep, and avoid additional stress.
  • Scenario B: Low HRV + Normal RHR + Good Sleep + Normal Temp. This might indicate primarily neurological or psychological stress. Your body is physically recovered, but your nervous system is still "on alert." Recommendation: Focus on parasympathetic nervous system activation through meditation, gentle walks in nature, or relaxing activities.

By learning to read these metrics as an interconnected system, you move from guesswork to guided understanding. This integrated approach to biometrics is central to the philosophy behind devices designed for true wellness, a principle you can discover more about in our company's mission.

HRV in Action: Real-World Protocols for Athletes, Executives, and Everyone Else

Theory is vital, but application is where life changes. How do different people actually use HRV data to make better decisions? The protocols vary by goal, but the underlying principle is the same: use objective data to inform subjective choice.

For the Athlete & Fitness Enthusiast (The Training Optimization Protocol):

  • Daily Morning Check: Before planning the day's session, check your readiness score or HRV/RHR trend.
  • Green Light (HRV baseline/above, RHR baseline/below): Proceed with your planned moderate or high-intensity workout. Your body is signaling readiness.
  • Yellow Light (HRV slightly depressed, RHR slightly elevated): Pivot. Consider a low-intensity "active recovery" session (light cycling, walking, yoga), a technique-focused session, or an extra rest day. The goal is to provide a positive stimulus without digging a deeper recovery hole.
  • Red Light (HRV significantly down for 2-3 days, RHR up, sleep poor): This is a mandatory rest day. The risk of injury, illness, or prolonged burnout is high. Focus on hydration, nutrition, and genuine rest.
  • Long-Term: Track how different training blocks (e.g., a hypertrophy phase vs. a peak phase) affect your trends. Learn the unique recovery demands of your sport.

For the High-Performance Executive (The Stress Management Protocol):

  • Weekly Review: Instead of a daily training decision, use the weekly trend as a mirror for your work life.
  • Insight: If you see a consistent HRV drop from Wednesday through Friday every week, it's a data-driven sign your workweek structure is cumulatively depleting. This objective evidence can justify instituting "meeting-free Friday afternoons" or a hard stop at 6 PM.
  • Experiment: Log stressful events (major presentations, difficult conversations). See their physiological footprint. Then, log your stress-management techniques (20-minute meditation, post-work walk). Quantify their positive impact. This turns self-care from a vague notion into a validated, reinforced habit.
  • Preventive Action: Use a sustained downward trend as a non-negotiable signal to use vacation days, delegate more aggressively, or seek support.

For the Health-Conscious Individual (The Lifestyle Experiment Protocol):

  • The N=1 Experiment: HRV is the perfect outcome measure for personal lifestyle experiments.
    • Question: Does a 10 PM digital curfew improve my recovery? Method: Implement it for two weeks, observe HRV/sleep trends.
    • Question: Does dairy affect my inflammation? Method: Remove it for 3 weeks, reintroduce, and watch HRV and temperature metrics.
    • Question: Which type of evening routine helps me unwind best—reading, tea, or light stretching? Method: Try each for a week and compare your average nightly HRV.
  • Motivation: Seeing a tangible, positive response in your HRV to a positive behavior is a powerful reinforcement loop, making healthy habits stick.

These protocols demonstrate that HRV isn't just for elite performers; it's a tool for anyone seeking a more conscious, responsive relationship with their body. For inspiration from others on this journey, real customer reviews and stories can provide powerful examples.

Beyond the Individual: HRV and Its Connection to Broader Health Narratives

While personal tracking is powerful, HRV also sits at the intersection of larger, compelling health and wellness narratives. Understanding these connections enriches the meaning of your own data and places it within the wider context of human health.

HRV and the Science of Longevity:
Research consistently links higher HRV (particularly SDNN over 24 hours) with better health outcomes and longevity. Low HRV is a known predictor of future cardiovascular events and all-cause mortality. Why? Because HRV is a marker of your system's complexity and adaptive capacity—key features of a resilient, aging organism. By improving and maintaining your HRV through lifestyle, you are not just optimizing for tomorrow's workout; you are potentially investing in your systemic health for decades to come. It is a quantifiable measure of your "healthspan."

HRV and Mental Health:
The mind-body connection is vividly illustrated through HRV. Conditions like anxiety, depression, and PTSD are frequently associated with chronically low HRV and a dysregulated autonomic nervous system stuck in a sympathetic-dominant state. Conversely, interventions proven to benefit mental health—Cognitive Behavioral Therapy (CBT), mindfulness-based stress reduction (MBSR), and certain antidepressants—have been shown to increase HRV. For many, tracking HRV provides physical proof of the efficacy of their mental health work, making an intangible struggle feel more manageable and visible.

HRV and Metabolic Health:
Emerging research points to a connection between low HRV and insulin resistance, metabolic syndrome, and type 2 diabetes. The autonomic nervous system plays a crucial role in regulating glucose metabolism and inflammation. A rigid, low-variability nervous system may contribute to a dysregulated metabolic state. This positions HRV not just as a fitness metric, but as a potential early-warning sign and tracking tool for metabolic wellness.

HRV and Women's Health:
For women, HRV tracking must be viewed through the lens of the infradian rhythm—the monthly hormonal cycle. HRV naturally fluctuates with estrogen and progesterone levels. Typically, HRV is highest during the follicular phase (post-menstruation, as estrogen rises) and lowest in the late luteal phase (pre-menstruation). A woman using HRV for training must therefore compare her scores to her phase-based baseline, not her overall average. This allows for cycle-synced training, planning higher-intensity work during the higher-HRV follicular phase and prioritizing recovery and lower-intensity exercise in the luteal phase. This application is a profound example of personalized, female-specific health tech.

By understanding these broader connections, your daily data point becomes part of a larger conversation about integrative health. It underscores that caring for your nervous system is foundational to virtually every aspect of well-being.

The Technology Deep Dive: Understanding Sampling Rates, Data Integrity, and Battery Life Trade-offs

To be an informed user, it helps to peek under the hood at some of the technical decisions manufacturers make—decisions that directly impact your experience and data quality. Three critical, interconnected factors are: sampling rate, data processing, and battery life.

Sampling Rate (Hz): How Often the Sensor Listens
This is how many times per second the PPG sensor takes a reading. A higher sampling rate (e.g., 250 Hz) captures a more detailed, higher-fidelity waveform than a lower rate (e.g., 25 Hz). For accurate peak detection—especially important for HRV's millisecond precision—a sufficiently high sampling rate is crucial. Most modern devices use rates between 25 Hz and 250 Hz for all-day tracking, which is more than adequate for reliable RR interval detection. However, continuously running a sensor at its maximum rate would drain a small battery in hours.

Data Processing: On-Device vs. Cloud Analysis
Where does the number crunching happen?

  • On-Device Processing: The raw PPG data is converted into heartbeats and HRV metrics directly on the ring or watch. This is faster and protects privacy but requires more powerful (and power-hungry) local chips.
  • Cloud Processing: The device streams raw or partially processed data to your phone, which sends it to a server. The powerful algorithms run in the cloud, and the results are sent back to your app. This allows for more complex computations without draining the wearable's battery but introduces a slight delay and requires an internet connection.

The Battery Life Trade-off: The Eternal Dance
This is the central engineering challenge. Every technical choice has a battery cost:

  • Higher Sampling Rate & Constant Measurement: Drains battery faster.
  • On-Device Processing: Drains battery faster than just collecting raw data.
  • Frequency of Bluetooth Syncing: Syncing data to your phone every minute vs. every hour impacts battery.

Manufacturers make strategic compromises. A device focused on continuous, clinical-grade data might have shorter battery life (1-2 days). A device optimized for convenience and passive, daily trend tracking—like a smart ring—will often use intelligent, adaptive sampling. For example:

  • Taking high-frequency readings during sleep for optimal HRV.
  • Switching to lower-frequency heart rate sampling during sedentary daytime hours.
  • Using motion sensors to trigger more frequent measurements during activity.
  • Processing data in batches to minimize Bluetooth transmission costs.

The result is a device that can last 5-7 days on a charge while still capturing the essential, high-fidelity nocturnal data needed for accurate HRV trends. Understanding this balance helps you choose the right tool for your needs and appreciate the engineering behind the seamless experience. For detailed technical questions, our FAQ and support page often covers these specifics.

Choosing Your Tool: A Comparative Guide to HRV Tracking Form Factors

With an understanding of the science and technology, you are equipped to make an informed choice about the right device for you. The market offers several form factors, each with strengths and compromises for HRV tracking.

1. Smart Rings (e.g., Oura, Circular, Ultrahuman, Oxyzen)

  • Pros for HRV:
    • Optimal Sensor Location: The finger provides a strong, consistent PPG signal with minimal motion artifact, especially during sleep.
    • Passive & Unobtrusive: Easy to wear 24/7, leading to consistent data. No need to remember to put it on at night.
    • Focus on Recovery: Most ring platforms are designed around nocturnal biomarker analysis (HRV, RHR, temp, sleep), providing a holistic recovery score.
    • Long Battery Life: Typically 5-7 days, reducing charging hassle.
  • Cons:
    • Limited Display: No screen for real-time feedback (data is viewed in the app).
    • Activity Tracking: Can be less precise for specific workout metrics (e.g., GPS, rep counting) compared to a dedicated sports watch.
    • Sizing/Fit: Requires careful sizing for consistent sensor contact.

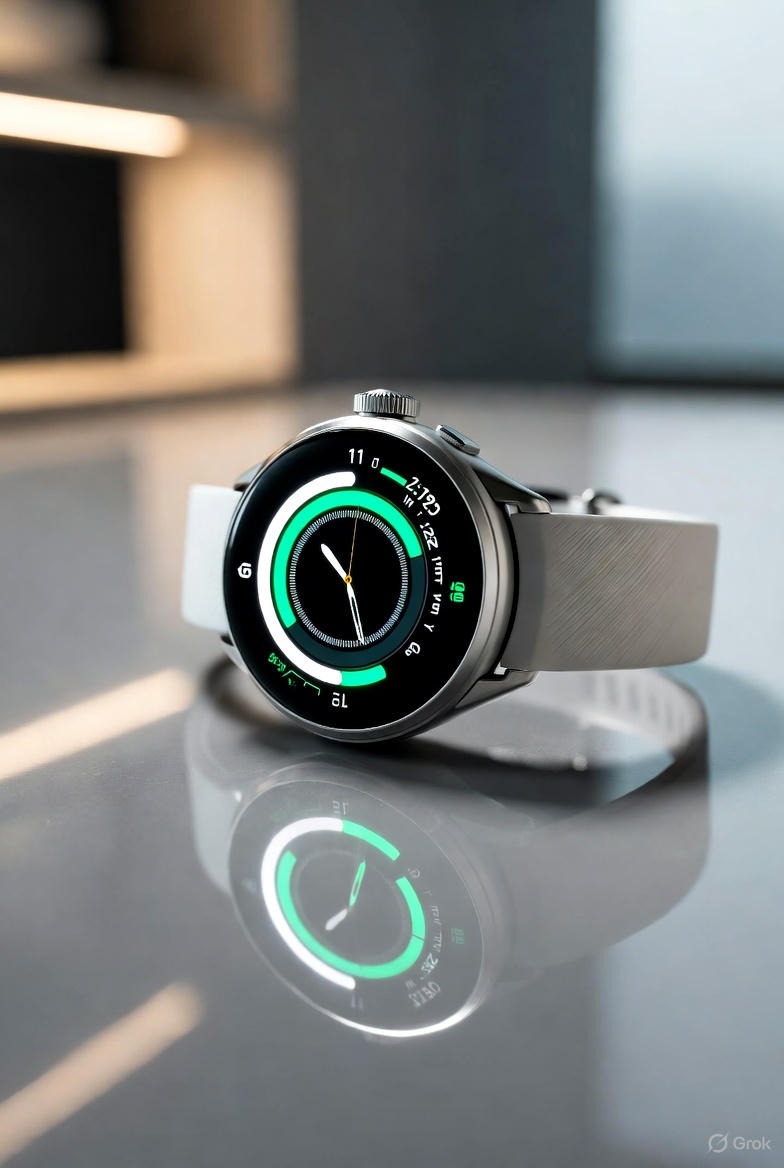
2. Smartwatches & Fitness Bands (e.g., Apple Watch, Garmin, Whoop Strap)

  • Pros for HRV:
    • Comprehensive Ecosystem: Often integrate HRV with extensive activity, GPS, and notification features.
    • Real-Time Feedback: Displays can show live HRV during meditation or breathwork sessions.
    • Broad Adoption & Apps: Large developer ecosystems for third-party app integration.
  • Cons:
    • Wrist-Based PPG Limitations: More prone to motion noise and "cadence lock" during high-intensity exercise. Signal can be weaker at night depending on fit.
    • Battery Life: For full-featured watches (Apple Watch), daily charging is often required, risking missed overnight data.
    • Potential for Data Overload: The sheer volume of features and notifications can distract from the core recovery insights.

3. Chest Strap Monitors (e.g., Polar H10, Garmin HRM-Pro)

  • Pros for HRV:
    • Gold-Standard Accuracy (for wearables): Uses EKG-based electrodes, providing the most accurate RR interval data available outside a clinical setting.
    • Ideal for Spot Checks: The recommended tool for controlled morning readiness measurements (e.g., the Elite HRV protocol).
  • Cons:
    • Not Continuous: Impractical for all-day, everyday wear. Cannot provide passive, nocturnal HRV.
    • Requires Proactive Use: You must remember to put it on for workouts or morning measurements.
    • Comfort: Can be uncomfortable for extended wear and requires moisture (sweat or gel) for optimal contact.

4. Dedicated HRV Sensors (e.g., Elite HRV CorSense)

  • Pros:
    • Clinical-Grade Finger Sensor: Uses PPG or EKG at the finger for highly accurate spot-check readings.
    • Purpose-Built: Software is specifically designed for HRV analysis and coaching.
  • Cons:
    • Spot-Check Only: No continuous or sleep tracking capability.
    • Another Device to Manage: It's a single-purpose tool you must carry and remember to use.

Recommendation:

  • For seamless, passive recovery tracking and lifestyle insight, a smart ring is arguably the most effective and user-friendly tool.
  • For athletes wanting real-time HRV during specific workouts or the absolute most accurate spot checks, a chest strap is an excellent complementary tool.
  • For those deeply embedded in a specific ecosystem (Apple, Garmin) who want an all-in-one device, a high-quality smartwatch can provide good HRV trends, especially if you prioritize nocturnal wear.

Your choice should reflect your primary goal: effortless trend awareness or precise workout/spot-check data. Many serious users end up with a combination—a ring for 24/7 recovery and a chest strap for intense training sessions. To compare these approaches and discover what might work for you, exploring dedicated resources can be invaluable.

The Art of Mindful Tracking: Cultivating a Healthy Relationship with Your Data

In an age of quantification, it’s paradoxically easy to become a slave to the numbers we measure. HRV, with its intimate connection to stress and performance, is particularly prone to triggering anxiety or obsessive checking—a phenomenon sometimes called "quantified self-stress." The goal, therefore, is not just to track, but to track mindfully. This means using data as a guide, not a gospel; a source of curiosity, not condemnation.

Principles of Mindful HRV Tracking:

  1. Adopt a Weekly, Not Daily, View: While daily data is collected, make your primary review a weekly one. Look at the trend line over the past seven days. This broader perspective smooths out daily noise and reveals the true narrative. Did you start the week strong and taper off? Was there a mid-week dip and recovery? This macro view prevents overreaction to single data points.
  2. Embrace the Dips: Reframe a low HRV reading. Instead of seeing it as a failure ("I'm not recovered"), see it as valuable feedback ("My body is communicating a need"). It is your physiology honestly reporting the load you've placed upon it. Thank it for the information, then act compassionately. This shift from judgment to curiosity is fundamental.
  3. Let Data Confirm, Not Dictate, Sensations: Always pair the objective number with your subjective feeling. Before checking your app in the morning, ask yourself: "How do I feel today? Rested? Dragged? Energized?" Then, see if the data aligns. This practice hones your interoception—your ability to sense your internal state—with the data acting as a calibration tool. Over time, you may find you can often predict the trend based on feel alone.
  4. Schedule Data Reviews: Don't let notifications or a compulsive urge pull you into the app constantly. Designate specific times for review—perhaps Sunday evening to plan the coming week, or Monday morning to assess weekend recovery. This contains the data within a ritual, preventing it from bleeding into and potentially stressing your entire day.
  5. Know When to Take a Break: If you find yourself feeling anxious, controlled by, or overly fixated on the numbers, take a week off from looking at them. Continue wearing the device to collect data, but hide the scores in the app. Use the time to reconnect with how you feel without the digital intermediary. The data will be there when you return, often with a healthier perspective.

Mindful tracking transforms HRV from a performance metric into a partnership. It becomes less about "hacking" your biology and more about listening to it and responding with respect. For more perspectives on building a balanced approach to wellness technology, our blog features thoughtful discussions on this very topic.

The Power of the Long View: What Your Longitudinal HRV Data Truly Reveals

The daily and weekly fluctuations of HRV provide tactical guidance. But the true transformative power of this technology is unlocked over months and years. Longitudinal data—the hundreds of nightly readings collected over seasons—paints a profound portrait of your life’s impact on your biology. It moves from measuring states to revealing stories.

What Longitudinal HRV Analysis Can Uncover:

  • Seasonal Rhythms: You may discover your HRV naturally dips in the deep winter and peaks in early autumn, reflecting changes in daylight, activity, and perhaps seasonal affective tendencies. This knowledge can help you anticipate and plan for these cyclical energy shifts.
  • Life Event Impact: The data becomes a biometric journal. You can scroll back and see the physiological signature of a stressful job transition, a joyful vacation, a period of grief, or the birth of a child. It quantifies the often-overwhelming notion that "this is a hard time" or "I was so happy then."
  • Aging Trajectory: While HRV naturally declines with age, the rate of decline is influenced by lifestyle. Long-term tracking can show you whether your habits are accelerating or slowing this process. Seeing a stable or even improving trendline in your 40s or 50s can be a powerful motivator, proving that your health investments are paying systemic dividends.
  • The Efficacy of Major Lifestyle Changes: Did that switch to a plant-based diet two years ago move your baseline? Did committing to a weekly yoga practice six months ago increase your resilience? Longitudinal data provides an objective, lagging indicator of the true, deep impact of these choices, far beyond short-term weight or fitness changes.
  • Identifying Personal Triggers and Buffers: With enough data, you can run personal correlations. Does pollen season consistently depress your HRV? Does a weekly nature hike reliably boost it? These become your personal, data-validated principles for well-being.

This long view is where the device transitions from a cool gadget to a legacy tool. It provides a form of biological autobiography, one that can inform not just your next workout, but your next decade. Companies focused on this long-term partnership, like Oxyzen, build their platforms with this journey in mind, as reflected in our story and vision for enduring user value.

Advanced Frontiers: HRV Biofeedback, Coherence Training, and Real-Time Intervention

The future of HRV technology is not just about better passive measurement, but about active modulation. This is the realm of HRV biofeedback (HRV-B), a well-researched therapeutic technique that is now entering the consumer mainstream through accessible apps and devices.

How HRV Biofeedback Works:
The principle is elegant: since your breathing rhythm directly influences your heart rhythm (a phenomenon called respiratory sinus arrhythmia), you can use conscious, paced breathing to entrain and elevate your HRV. In a biofeedback session, you see your HRV or a derived "coherence" score in real-time on a screen while practicing specific breathing techniques (typically at 5-6 breaths per minute). The visual feedback allows you to see instantly which patterns increase coherence, training your nervous system to access a calm, resilient state on demand.

Integration with Consumer Technology:
Modern wearables are bringing this out of the clinic and into daily life.

  • Guided Breathing Sessions: Apps like Apple's Breathe, or dedicated ones like Elite HRV or HeartMath, use your device's optical sensor to guide you through a breathing pacer while displaying your real-time heart rate or HRV coherence.
  • The Goal: To increase "Heart Rate Variability Coherence," a state where your heart rhythm shows a smooth, wave-like pattern synchronized with your breath. This state is associated with optimal autonomic balance, reduced cortisol, and improved emotional regulation.
  • Proactive Stress Management: Instead of waiting for a low HRV score to tell you to de-stress, you can use a 5-minute HRV-B session as a proactive tool to create coherence before a big meeting, after a stressful event, or as part of a morning routine.

The Next Step: Contextual, Real-Time Nudges
Imagine a device that doesn't just report your overnight state in the morning, but intervenes helpfully in the moment. Early implementations of this are here:

  • A smart ring senses a rapid rise in heart rate and a dip in HRV coherence while you're sitting at your desk—signs of acute stress. It sends a gentle, silent vibration and a notification to your phone: "Your body shows signs of stress. Take a 2-minute breathing break?"
  • After a high-intensity workout, the device could automatically launch a guided cool-down breathing session tailored to help kickstart your parasympathetic recovery.

This evolution turns the tracker from a historian into a coach, using the very data it collects to prompt restorative actions in real-time. It closes the biofeedback loop, making the technology an active partner in nervous system regulation. For users curious about how these advanced features are implemented, our FAQ section often covers such interactive functionalities.

The Ecosystem Integration: How HRV Data Connects to Broader Digital Health

Your HRV does not exist in a vacuum. Its true potential is multiplied when it can converse with other sources of health and lifestyle data. The most powerful personal health insights will come from the integration of biometric, behavioral, and environmental data streams—a concept known as the "digital phenotype."

Potential Integration Points:

  • Calendar and Productivity Apps: Could your HRV data be cross-referenced with your calendar to identify which types of meetings (e.g., large presentations vs. one-on-ones) carry the highest physiological cost? Could it suggest optimal times for deep work based on your historical readiness patterns?
  • Nutrition and Meal Logging Apps: Imagine if your food diary could be analyzed alongside your HRV and skin temperature to provide personalized feedback like, "Meals high in refined carbohydrates after 7 PM correlate with a 22% higher resting heart rate and lower HRV for you."
  • Fitness and Training Platforms: Direct integration with apps like Strava, TrainingPeaks, or Peloton could allow these platforms to automatically adjust your suggested workout intensity based on your live readiness score fed from your wearable.
  • Mental Wellness and Meditation Apps: Apps like Calm or Headspace could receive data that your pre-session HRV coherence is low, and therefore recommend a specific "Stress Release" meditation, then show you the coherence improvement achieved by the end of the session.
  • Electronic Health Records (The Future Frontier): With user permission, longitudinal HRV trends could one day be shared with healthcare providers as a rich, objective record of a patient's functional health and response to treatment between visits, useful in managing conditions like hypertension, anxiety, or chronic fatigue.

This ecosystem approach moves us toward a truly holistic and personalized health model. The smart ring or watch becomes the central hub of your personal health data, synthesizing information from multiple domains to offer contextual, actionable wisdom. It’s a vision that guides the development of open platforms, a topic explored in resources like those found on our company's website.

Navigating the Gray Areas: Limitations, Ethical Considerations, and Data Privacy

As we embrace the power of this technology, it is responsible to also acknowledge its limitations and the ethical questions it raises. A critical consumer is an empowered one.

Technical and Physiological Limitations:

  • Not a Diagnostic Tool: This cannot be overstated. A consumer HRV tracker cannot diagnose arrhythmias, sleep apnea, or heart disease. While it may provide clues (e.g., wildly erratic nighttime heart rate prompting a doctor's visit), it is for wellness and lifestyle insight only.
  • Individual Algorithmic "Secret Sauce": Each company's algorithms for filtering noise and calculating scores are proprietary. This means an RMSSD of 50 on Brand A's device may not be directly equivalent to a 50 on Brand B's device, as they may process the raw intervals differently. Focus on trends within a single ecosystem.
  • The "Why" is Still Yours to Determine: The device can tell you that your system is stressed, but it cannot tell you why. The crucial work of linking the dip to emotional stress, dietary indiscretion, or an oncoming cold remains a human, interpretive task.

Ethical and Privacy Considerations:

  • Data Ownership and Use: Who truly owns your intimate biometric data—you or the company? It is vital to read privacy policies. Understand if your anonymized data is used for aggregate research (which can be positive) or sold to third parties for advertising.
  • Psychological Risk: For individuals with health anxiety or orthorexia (an obsession with healthy eating), constant biometric feedback can potentially exacerbate fixation and anxiety. It’s not a suitable tool for everyone.
  • Workplace and Insurance Implications: As this data becomes more common, what are the implications if employers request access to "corporate wellness" data? Could insurers one day offer discounts for high HRV, potentially penalizing those with naturally lower variability? These are societal questions that need careful, ethical frameworks.

Best Practices for Privacy and Security:

  • Use strong, unique passwords for your health app accounts.
  • Review app permissions and disable unnecessary data sharing.
  • Choose companies that are transparent about their data practices, employ strong encryption, and allow you to download and delete your raw data. Transparency in these matters is a cornerstone of trust, a value you can learn more about on our about us page.

The Final Integration: Weaving HRV Insight into the Fabric of Daily Life

After understanding the science, technology, protocols, and ethics, we arrive at the ultimate goal: seamless integration. The end state of a mature relationship with HRV tracking is not more time spent analyzing charts, but less. The insights become internalized, informing a more intuitive, responsive way of living.

The Integrated Life with HRV Awareness:

  • Pre-emptive Planning: You know your big project deadline is in two weeks. Instead of burning out, you use your historical data to plan: lighter workouts the week before, strict sleep hygiene, and scheduled HRV biofeedback sessions to maintain coherence under pressure.
  • Informed Recovery: You have a fantastic, hard training session. The old you might have pushed again the next day. The HRV-informed you sees a significant dip in your readiness score. You honor it, taking an active recovery day, and are rewarded two days later with a new personal best, fully recovered and super-compensated.
  • Compassionate Self-Assessment: You feel irritable and off. Instead of self-criticism, you check your data and see a three-day downturn. You think, "Ah, my body is under strain. What do I need?" This leads to compassion—a warm bath, an early night, a call to a friend—rather than frustration.
  • Celebrating Progress: At the end of a year, you look at your longitudinal chart. You see the upward drift in your baseline, the smaller and shorter dips after similar stressors. This isn't about a number; it's about visual proof of your growing resilience, a deeply motivating reward for your consistent healthy habits.

In this state, the technology fades into the background. It becomes like a wise, silent companion that occasionally taps you on the shoulder with a gentle, data-driven nudge, helping you live in closer harmony with your own physiology. It empowers you to not just do more, but to be better—more rested, more resilient, and more in tune.

This journey from millisecond heartbeats to a more conscious life is the grand promise of HRV tracking technology. It represents a pivotal shift in personal health: from reactive care based on symptoms to proactive care based on signals; from generic advice to personalized insight; from ignoring our body's whispers until they become shouts, to listening closely and responding with grace.

Citations:

Your Trusted Sleep Advocate: Sleep Foundation — https://www.sleepfoundation.org

Discover a digital archive of scholarly articles: NIH — https://www.ncbi.nlm.nih.gov/

39 million citations for biomedical literature :PubMed — https://pubmed.ncbi.nlm.nih.gov/

Experts at Harvard Health Publishing covering a variety of health topics — https://www.health.harvard.edu/blog/  

Every life deserves world class care :Cleveland Clinic - https://my.clevelandclinic.org/health

Wearable technology and the future of predictive health monitoring :MIT Technology Review — https://www.technologyreview.com/

Dedicated to the well-being of all people and guided by science :World Health Organization — https://www.who.int/news-room/

Psychological science and knowledge to benefit society and improve lives. :APA — https://www.apa.org/monitor/

Cutting-edge insights on human longevity and peak performance:

 Lifespan Research — https://www.lifespan.io/

Global authority on exercise physiology, sports performance, and human recovery:

 American College of Sports Medicine — https://www.acsm.org/

Neuroscience-driven guidance for better focus, sleep, and mental clarity:

 Stanford Human Performance Lab — https://humanperformance.stanford.edu/

Evidence-based psychology and mind–body wellness resources:

 Mayo Clinic — https://www.mayoclinic.org/healthy-lifestyle/

Data-backed research on emotional wellbeing, stress biology, and resilience:

 American Institute of Stress — https://www.stress.org/