How Smart Rings Calculate HRV: The Sensor Technology Explained
Explains the sensor technology smart rings use to calculate HRV.
Explains the sensor technology smart rings use to calculate HRV.
For decades, the truest measure of your inner physiological state, a window into the delicate balance of your nervous system, was locked away in clinical settings. Heart Rate Variability (HRV)—the subtle, millisecond variations in the time intervals between consecutive heartbeats—was a metric for cardiologists and research scientists, parsed through expensive, cumbersome electrocardiogram (EGG) machines. Today, that profound insight rests quietly on your finger, continuously monitored by a device no larger than a piece of jewelry: the smart ring.
This shift from the clinic to the consumer represents one of the most significant democratizations of health data in recent history. But it begs a critical, technology-driven question: How can a ring, sitting passively on your finger, possibly calculate something as precise and nuanced as HRV? The answer is a breathtaking symphony of miniaturized sensor technology, advanced signal processing, and sophisticated algorithms, all engineered to transform faint biological signals into a clear picture of your autonomic nervous system.
Unlike wrist-worn devices that measure blood flow at the periphery, smart rings like the Oxyzen ring leverage a unique vascular advantage. The finger contains dense, palpable arteries closer to the skin’s surface, offering a robust signal for photoplethysmography (PPG) sensors—the core technology behind this health monitoring revolution. This foundational advantage, however, is just the beginning. From capturing raw light data to delivering a clinically relevant HRV score on your smartphone, the journey is complex and fascinating.
In this deep dive, we will unravel exactly how your smart ring performs this modern alchemy. We will move beyond marketing claims and into the realm of physics, electrical engineering, and data science. You’ll learn not just that it works, but how it works—from the specific wavelengths of light that penetrate your skin, to the mathematical models that filter out the noise of daily life, to the final number that can guide your recovery, sleep, and stress management. For a comprehensive look at how this data integrates into a holistic wellness system, you can always explore the Oxyzen platform to see the full picture.
By understanding the technology, you become an informed interpreter of your own data, empowered to make smarter decisions for your well-being. Let’s begin by exploring the fundamental biological signal that makes everything possible: the pulse wave.
Before we can appreciate the technology that measures HRV, we must first understand the biological phenomenon it is designed to capture. Every heartbeat is not merely a mechanical pump; it is a dynamic pressure wave that radiates throughout your entire arterial system. This pulse wave is the fundamental carrier signal for HRV, and its characteristics are directly influenced by the constant, subtle tug-of-war between your sympathetic ("fight-or-flight") and parasympathetic ("rest-and-digest") nervous systems.
When your heart's left ventricle contracts, it ejects blood into the aorta, creating a sharp rise in pressure. This pressure surge propagates as a wave through the arteries at a speed much faster than the blood flow itself. As this wave travels down to the smaller vessels in your fingertips, it causes the arteries and arterioles to expand minutely with each pulse. This expansion increases the volume of blood in that micro-vascular bed. A fraction of a second later, as the pressure wave recedes and the vessels elasticly recoil, the blood volume decreases. This cyclical, heartbeat-synchronized change in blood volume at any given point in the peripheral circulation is the pulse wave.
Crucially, the timing of this wave is not metronome-perfect. The interval between one pulse wave peak and the next is where HRV lives. Your autonomic nervous system (ANS) is in constant dialogue with your heart via the vagus nerve and sympathetic chains. The parasympathetic system exerts a rapid, beat-to-beat inhibitory influence, subtly slowing the heart and creating variability. The sympathetic system has a slower, more sustained effect, generally reducing that variability. The resulting interplay creates a complex, non-random pattern in the timing of your pulse waves.
Key Characteristics of the Pulse Wave for Smart Rings:
It is this last point—the detection of pulse arrival time—that defines the primary engineering challenge. A smart ring must identify the exact start of the pulse wave’s expansion in the finger with incredible consistency, all while the finger is moving, temperature is fluctuating, and the signal itself can be weak. This brings us to the core technology that solves this problem: photoplethysmography.

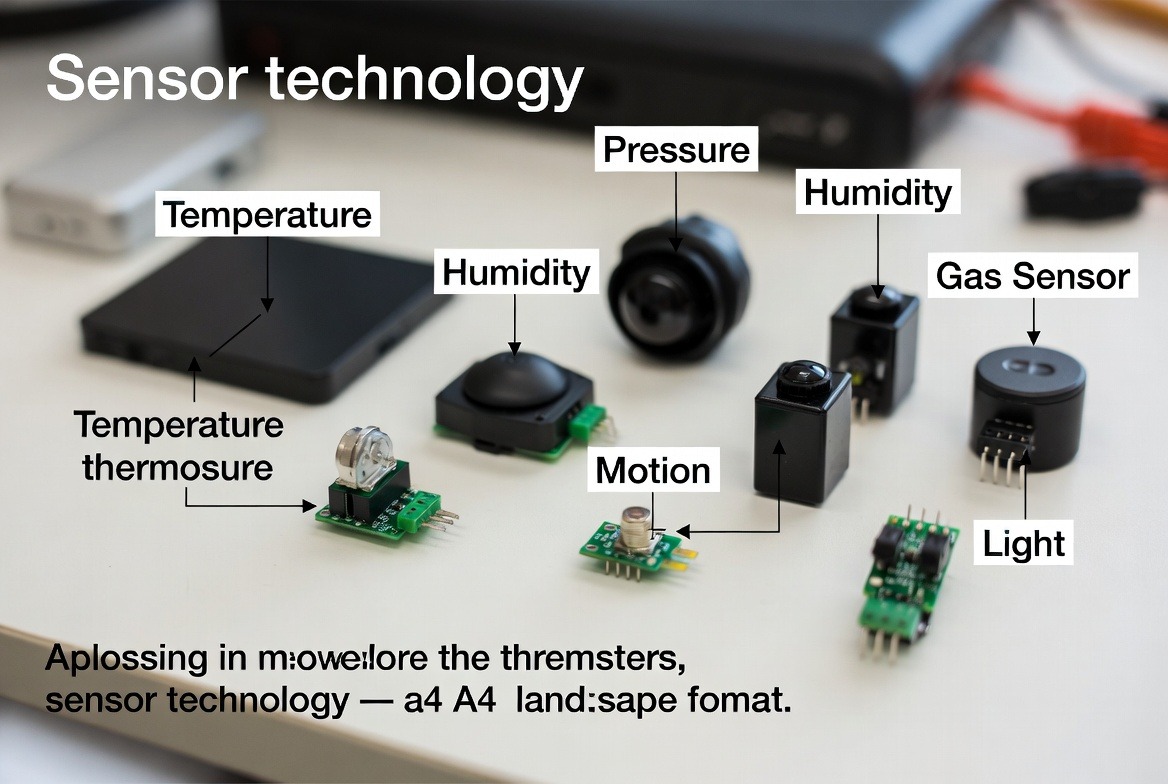
Photoplethysmography (PPG) is the foundational sensing principle for virtually all consumer-grade heart rate and HRV monitors, from smart rings to fitness trackers. At its core, PPG is an elegantly simple optical technique. It involves shining light into the skin and measuring the amount of light that is either absorbed or reflected back. The magic lies in how blood modulates this light.
A PPG sensor in a smart ring is composed of two core components:
Here’s the simple genius: Blood absorbs light more effectively than the surrounding tissue (like skin, fat, and bone). More specifically, oxygenated hemoglobin (HbO2) and deoxygenated hemoglobin (Hb) absorb different wavelengths of light to varying degrees. When your heart beats and the pulse wave causes a momentary increase in blood volume in the capillaries under the ring, more light is absorbed, so less light is reflected back to the photodetector. Between beats, when blood volume is lower, more light is reflected. The photodetector records these tiny, rhythmic fluctuations in light intensity, generating a waveform called the PPG waveform.
This waveform is a visual representation of the pulse wave we discussed earlier. The steep rising edge corresponds to the systolic surge, the peak is the maximum volume, and the falling edge is the diastolic runoff. The valley between pulses is the end-diastolic point. The time between consecutive peaks (or, more accurately, a specific point on the rising edge) is called the Pulse-to-Pulse interval (PPI), which is the raw data equivalent of the beat-to-beat (R-R) intervals from an ECG.
Why the Finger is a Superior Location for PPG:
While wrists and earlobes are also used for PPG, the finger—particularly the base of the finger where most smart rings sit—offers distinct advantages:
However, PPG is not without its challenges. It is notoriously susceptible to motion artifact (the sensor moving relative to the skin) and poor perfusion (cold fingers constrict blood vessels, weakening the signal). This is where sensor design and signal processing become paramount. For a deeper exploration of how Oxyzen tackles these challenges to ensure accuracy, you can read about our sensor technology and design philosophy.
The sleek exterior of a modern smart ring belies a dense, miniaturized world of sophisticated hardware. This internal architecture is meticulously designed to capture the highest fidelity PPG signal possible in a challenging, real-world environment.
1. The Optical Heart Rate Sensor:
This is the primary module for HRV data acquisition. It is far more advanced than a simple LED and light meter.
2. The 3-Axis Accelerometer & Gyroscope:
This is the unsung hero of accurate HRV measurement. Motion is the primary enemy of clean PPG data. The accelerometer (measuring linear movement) and gyroscope (measuring rotational movement) serve a critical dual purpose:
3. Supporting Cast & Integration:
The coordinated operation of this hardware ensemble generates the raw data stream. But this raw data is messy, full of noise and artifacts. Transforming it into a clean, usable PPG waveform requires the next critical stage: signal processing.
The moment you put on a smart ring, it begins generating a relentless stream of raw, analog electrical signals from the photodiode and accelerometer. This data is the digital equivalent of a cacophony—a mixture of the precious pulse wave signal buried within a sea of biological and environmental noise. The journey to extract a clear HRV reading is a multi-stage filtering and processing pipeline.
Stage 1: Analog-to-Digital Conversion (ADC)
The photodiode’s tiny, continuously varying current is first amplified and then fed into an Analog-to-Digital Converter. The ADC samples this signal at a high frequency—anywhere from 25 Hz to over 100 Hz (samples per second) in premium devices. This sampling rate determines the temporal resolution. For HRV, which requires millisecond precision, a higher sampling rate (e.g., 64 Hz or higher) allows for more precise pinpointing of the pulse wave’s exact timing. Each sample becomes a digital value representing light intensity at that microsecond.
Stage 2: Demodulation & DC/AC Separation
The raw digital PPG signal contains two main components:
High-pass filtering is used to remove the slow DC drift, isolating the AC component which contains the heartbeat information. This is the first major step in cleaning the signal.
Stage 3: Noise Filtering & Motion Artifact Reduction
This is where the heavy lifting happens, using data from the accelerometer.
Stage 4: Pulse Wave Detection & Feature Extraction
Once a relatively clean PPG waveform is obtained, the algorithm must locate the precise start of each pulse wave with sub-sample accuracy. This is often done by finding the point of maximum slope on the waveform's upstroke (the first derivative) or using sophisticated template-matching techniques. The timestamp of each detected pulse is recorded with microsecond precision, creating a list of Pulse-to-Pulse Intervals (PPI). This list of intervals is the direct, optically-derived equivalent of the R-R intervals from an ECG and is the primary data set for calculating HRV metrics.
This entire pipeline runs continuously, often on a low-power microcontroller within the ring itself, to preserve battery life before transmitting condensed data packets to your phone for final analysis. To see how this processed data translates into actionable wellness insights for real people, you can read about user experiences and outcomes.
With a clean list of Pulse-to-Pulse Intervals (PPIs) in hand, the smart ring (or more accurately, its paired app) now moves from the domain of signal processing to the domain of statistical and physiological analysis. This is where raw timing data is transformed into the HRV metrics you see on your dashboard. The algorithms here must be robust, as even a clean PPI list can contain occasional erroneous intervals due to signal dropout or arrhythmias like premature ventricular contractions (PVCs).
Step 1: Artifact Correction & NN Interval Creation
The first task is to ensure the interval list represents only intervals from normal sinus rhythms. This involves:
Step 2: Metric Calculation
HRV is not a single number but a constellation of metrics, each revealing a different aspect of autonomic nervous system function. The algorithm calculates several key metrics from the NN interval series:
Time-Domain Metrics (calculated directly from the intervals):
Frequency-Domain Metrics (require more complex spectral analysis):
For practical, daily wellness tracking, RMSSD is the workhorse metric delivered by most smart rings due to its reliability on shorter, clean data segments (like during sleep) and its direct link to recovery state.
Step 3: Contextualization & Baseline Comparison
A raw RMSSD number (e.g., 42 ms) is meaningless in isolation. The final algorithmic step involves comparing your current metric to your own personal baseline, which is established over weeks of observation. The app will typically present a "readiness" or "recovery" score that synthesizes your nightly HRV (often the average or peak during deep sleep), trend direction, and other contextual data like sleep duration and resting heart rate.
This entire algorithmic heart—from artifact correction to final score—is what turns a stream of light data into a profound insight about your nervous system's state, a process you can explore in greater detail through our educational resources.
The theoretical path from sensor to HRV score is elegant, but the real world is messy. Smart rings operate in a hostile environment for precise optical measurement. Their credibility hinges on how effectively they overcome three pervasive challenges: motion artifact, environmental/physiological noise, and variations in skin tone.
1. The Motion Problem:
Motion artifact is the primary source of error in PPG-based HRV. It occurs when the ring moves relative to the skin, changing the optical coupling. This can cause sudden, dramatic shifts in the light signal that can dwarf the actual pulse wave.
How Smart Rings Combat Motion:
2. The Noise Problem:
Beyond gross motion, other factors contaminate the signal:
3. The Skin Tone Problem:
Melanin, the pigment in skin, absorbs light. Higher melanin concentration can attenuate the PPG signal, particularly at the green wavelength, potentially leading to lower signal-to-noise ratios and less reliable readings if not properly accounted for.
How Technology is Achieving Equity:
The relentless engineering focus on these challenges is what separates a robust health tool from a fragile gadget. It ensures that the profound promise of accessible HRV monitoring is delivered reliably to every user, regardless of their activity or physiology.
For all the challenges of daytime monitoring, the smart ring finds its ideal use case and greatest accuracy during sleep. The overnight period provides a controlled, reproducible physiological environment that turns your ring into a powerful sleep lab on your finger. This is where HRV data transitions from interesting to profoundly actionable.
A Controlled Physiological Environment:
During sleep, especially in the earlier parts of the night dominated by deep (N3) sleep and slow-wave sleep, external confounders are minimized.
This environment allows the smart ring's PPG sensor to capture long, pristine segments of data, enabling the calculation of highly reliable HRV metrics.
The Nightly HRV Curve: A Story of Recovery
When you examine high-quality overnight HRV data (typically RMSSD), a distinct pattern emerges:
By analyzing this curve—its peak value, its area under the curve, its trend over time—the ring's algorithms can distill a single, powerful "Overnight HRV" or "Recovery" score. This score reflects how effectively your body achieved a state of physiological rest and nervous system repair.
Why Nightly HRV Trumps Spot Measurements:
This focus on nocturnal monitoring is a strategic masterstroke for smart rings, leveraging their form factor's natural advantage during sleep to deliver their most valuable and accurate health insight. For common questions on how to interpret this nightly data and improve it, our comprehensive FAQ section offers detailed guidance.

While RMSSD is the star of the show for recovery tracking, the rich PPG signal captured by a smart ring is a treasure trove of physiological data. Advanced processing and analysis can extract a suite of complementary metrics that paint a more holistic picture of your cardiovascular and autonomic health. These are not always direct HRV metrics but are derived from the same fundamental pulse wave signal.
1. Resting Heart Rate (RHR) and Its Dynamics:
This is the most straightforward derivative. The ring calculates your true resting heart rate as the lowest stable heart rate during sleep or periods of profound rest. More insightful than a single number is the trend: a creeping rise in overnight RHR is another classic sign of systemic stress, fatigue, or infection.
2. Pulse Rate Variability (PRV) vs. HRV:
It is vital to acknowledge a technical distinction: smart rings measure Pulse Rate Variability (PRV)—the variability in pulse arrival times at the finger. Under most conditions in healthy individuals at rest, PRV is an excellent surrogate for true HRV (which is measured at the heart). However, during periods of high blood pressure change or certain vascular conditions, the pulse wave velocity can change, introducing a tiny lag. Advanced algorithms account for this, but it's a reason why clinical diagnosis still relies on ECG.
3. Respiratory Rate (RR):
This is a powerful, often overlooked metric extracted directly from the PPG signal. The amplitude of the PPG waveform subtly increases and decreases with respiration—a phenomenon called Respiratory-Induced Amplitude Variation (RIAV). Furthermore, the heart rate itself oscillates with breathing (Respiratory Sinus Arrhythmia, captured in HF power). Algorithms can detect this rhythmic pattern to calculate breaths per minute, all without any dedicated breathing sensor. Monitoring nocturnal respiratory rate is particularly valuable, as an elevated rate can indicate sleep disturbances or underlying issues.
4. Pulse Wave Amplitude (PWA) & Perfusion Index (PI):
5. Advanced Pulse Wave Analysis (PWA):
Research-grade analysis of the PPG waveform's shape can infer remarkable information, though this is on the cutting edge for consumer devices:
By synthesizing this multi-metric data stream—HRV, RHR, Respiratory Rate, and perfusion data—a smart ring moves from being a simple tracker to a comprehensive physiological monitoring system. This integrated data approach is central to the mission of providing users with a complete picture of their well-being, a vision you can learn more about by understanding our company's goals and research.
The current state of smart ring technology, with its multi-wavelength PPG and motion fusion, is sophisticated, but it represents just the beginning. The next wave of innovation, already in labs and trickling into prototypes, promises to make HRV monitoring even more accurate, comprehensive, and insightful. These advancements will further blur the line between consumer wellness devices and medical-grade diagnostic tools.
1. Multi-Site PPG and Spatial Averaging:
Future rings may incorporate multiple, spatially separated PPG sensor arrays around the ring's inner circumference. This would allow for spatial averaging, where signals from multiple points are combined. Motion artifact is often localized—if one sensor loses contact, others may maintain it. This architecture could dramatically improve signal robustness during light activity and provide redundancy.
2. Bioimpedance (BIA) Integration:
While challenging to implement in a ring form factor due to the need for separated electrodes, miniaturized bioimpedance sensors could measure the slight changes in electrical conductivity of tissue with each heartbeat (Impedance Plethysmography). This is a fundamentally different physiological principle than PPG and could serve as an independent validation source for pulse timing, especially in low-perfusion scenarios. It could also potentially measure other metrics like fluid levels or body composition trends.
3. Electrocardiogram (ECG) Capability:
Some prototype rings already include two small, exposed electrodes. By touching them with another finger or having them contact different parts of the single finger, they can capture a single-lead ECG. This provides the gold-standard R-R interval for HRV, eliminating the PRV surrogate question entirely. The challenge is user compliance (requiring a deliberate action) and power consumption, making it unlikely to replace continuous PPG but serving as a powerful spot-check tool.
4. Advanced Biomarkers from PPG Waveform:
With more powerful on-device processing and machine learning, the analysis of the PPG waveform's morphology will move beyond research. Algorithms trained on massive, labeled datasets could learn to detect subtle waveform features associated with stress, hydration status, glucose trends (indirectly), and even early signs of atrial fibrillation (AFib). The ring could become a true early-warning screening device.
5. Closed-Loop Systems & Personalized AI:
The ultimate future lies not just in better sensing, but in intelligent intervention. Imagine an AI that learns your unique physiological patterns: it knows that when your HRV drops by X% and your nocturnal respiratory rate increases by Y, you have a 70% probability of catching a cold in 36 hours. It could then prompt you: "Your body shows early signs of fighting something. Consider prioritizing rest, hydration, and maybe taking Vitamin D today." This transforms the device from a passive monitor to an active, personalized health guardian.
The journey of the smart ring is a microcosm of digital health's evolution—relentlessly pushing the boundaries of what's possible in a wearable form factor. As these technologies mature, the humble ring promises to become an even more indispensable partner in our pursuit of understanding and optimizing our own health. To follow the latest developments and insights in this rapidly evolving field, be sure to check our regularly updated blog for in-depth articles and analysis.
The promise of a smart ring delivering clinical-grade HRV data from your finger is extraordinary. But for the data to be truly meaningful—for it to guide training decisions, stress management, and health insights—it must be trustworthy. This brings us to the critical, often overlooked domain of validation. How do we know that the HRV number on your screen is an accurate reflection of your physiology, and not just a clever approximation? The answer lies in rigorous scientific testing, pitting the smart ring against the gold standard in a head-to-head comparison.
Validation is not a single checkmark; it's a multi-layered process that establishes the device's accuracy, reliability, and clinical relevance. For consumers, understanding this process demystifies the technology and provides confidence in the data they are using to make potentially important lifestyle changes.
The Gold Standard: Electrocardiography (ECG)
To validate any HRV device, you need a reference truth. That truth is the medical-grade electrocardiogram (ECG or EKG). An ECG measures the heart's electrical activity directly via electrodes placed on the skin. It captures the precise moment of each ventricular depolarization, visualized as the sharp "R-wave" spike on the familiar ECG trace. The time between consecutive R-waves—the R-R interval—is the definitive, uncontested source for HRV calculation. Any new method claiming to measure HRV, whether from a chest strap, wrist, or finger, must prove its measurements align closely with these ECG-derived R-R intervals.
The Validation Study Protocol
A proper validation study is conducted under controlled laboratory conditions, typically involving dozens or hundreds of participants representing a range of ages, genders, fitness levels, and skin tones. Participants are fitted with both the test device (the smart ring) and a certified, multi-lead ECG holter monitor. They then undergo a series of protocols designed to simulate real-world conditions:
Throughout these protocols, data is collected synchronously from both devices. The raw output—the timestamps of each pulse detection from the ring (PPI) and each R-wave from the ECG (RRI)—is then compared using sophisticated statistical analysis.
Key Statistical Metrics for Validation:
Researchers don't just look at averages; they perform a beat-by-beat analysis.
The Real-World Hurdle: What Validation Studies Reveal
High-quality published studies on devices like the Oura Ring and others consistently show a clear pattern:
Understanding this validation framework empowers you as a user. It tells you that when you see a significant dip in your nightly HRV, it's not a sensor glitch—it's a physiologically valid signal with a strong scientific backing. It also wisely sets expectations: your ring is a superb rest and recovery monitor, not a clinical-grade ECG for diagnosing arrhythmias during your tennis match. This commitment to validated, accurate data is at the core of what we do, and you can learn more about our scientific approach and partnerships.
With multiple wearable technologies offering HRV, how do you choose the right tool for your needs? Each platform—smart ring, chest strap, and smartwatch—has distinct advantages, limitations, and ideal use cases. The "best" device depends entirely on your primary goals, lifestyle, and what you value most in data collection.
The Smart Ring: The Recovery & Sleep Specialist
Chest Strap (with ECG): The Athletic Performance Gold Standard
Smartwatch: The Versatile All-Rounder
The Synergistic Approach:
For the ultimate data geek or performance-focused individual, the ideal setup is not an either/or choice, but a combination. Wear a smart ring 24/7 for seamless recovery, sleep, and lifestyle tracking. Use a chest strap for dedicated, high-intensity training sessions where precision is paramount. The ring provides the background context (how recovered you were before the workout), and the chest strap provides the precise workout load data. They tell two parts of the same story.
Your choice ultimately boils down to a question: What is your primary "job to be done"? If it's understanding and improving your daily recovery and sleep, a smart ring is arguably the most focused and effective tool. If it's capturing perfect data during sweaty workouts, the chest strap wins. If it's having a connected, all-in-one companion for life and fitness, the smartwatch is the answer. To compare how the Oxyzen ring's approach fits into this landscape, you can discover more about our specific product design and capabilities.
While the core principles of photoplethysmography (PPG) are universal, the true differentiation between smart rings lies in their proprietary algorithms. It's in the software—the layers of code that filter noise, detect pulses, clean artifacts, and interpret intervals—where a device transitions from a simple pulse sensor to an intelligent health advisor. This layer is the "secret sauce," and while the exact formulas are closely guarded intellectual property, we can analyze the public-facing approaches and outcomes of the major players in the smart ring arena.
1. Oura Ring: The Pioneering Sleep & Recovery Platform
Oura's algorithm is arguably the most mature and research-backed in the consumer ring space. Its strength is its holistic, multi-parameter scoring system focused squarely on recovery.
2. Whoop Strap (and Pending Ring): The Athlete's Strain/Recovery Coach
While currently a wrist device, Whoop has announced a ring form factor, and its algorithm is a dominant force in the performance recovery space. Its core is the Strain & Recovery feedback loop.
3. Circular Ring Slim: The Context-Aware Assistant
Circular takes a different tack, integrating smart notifications and haptic alerts directly with its health algorithms, aiming to be a proactive life assistant.
4. Ultrahuman Ring Air & Movano's Evie Ring: The Next-Generation Challengers
New entrants are pushing algorithmic boundaries with different specializations.
Comparative Analysis: A Matter of Philosophy
Ring/Platform
Algorithmic North Star
HRV Core Use
Key Differentiator
Oura
Holistic Recovery & Healthspan
Overnight average for Readiness Score
Research-backed, temperature-integrated, long-term trend focus.
Whoop
Performance Optimization
Single morning reading for Recovery Score
Strain/Recovery feedback loop, explicit daily activity recommendation.
Circular
Proactive Life Intervention
Real-time stress detection & readiness
Haptic feedback, smart alerts, high user customization.
Ultrahuman
Metabolic Health Mapping
Recovery context for metabolic insights
Glucose variability modeling from indirect biomarkers.
Movano Evie
Female Health Intelligence
Cycle-phase contextualization
Physiology algorithms tuned for hormonal fluctuations.
The Common Thread: Personal Baselines and Machine Learning
Despite their differences, all leading platforms share a foundational algorithmic principle: everything is relative to you. They use machine learning not to compare you to a population, but to learn your unique patterns. They establish what "normal" HRV, temperature, and sleep look like for you, and then detect meaningful deviations. The algorithm's job is to filter out noise and spotlight the signals that represent a true departure from your personal baseline.
This is why the first weeks of wearing any ring are a "learning period." The device isn't just gathering data; it's training its user-specific model. The sophistication with which a ring's algorithm performs this personalization—and how it synthesizes HRV with other data streams—ultimately defines the user experience and the value of the insights. For a perspective on how Oxyzen approaches algorithmic design with a focus on user-centric clarity, you can delve into our development philosophy.
Heart Rate Variability is not just a metric to observe; it is a physiological parameter you can actively control and enhance. This is the domain of HRV Biofeedback (HRV-B), a well-researched behavioral intervention that uses real-time feedback to teach self-regulation of the autonomic nervous system. While smart rings are primarily monitoring tools, understanding HRV-B reveals the actionable pathway to improving your own numbers and, more importantly, your resilience.
The Foundational Principle: Respiratory Sinus Arrhythmia (RSA)
HRV-B works by harnessing a natural, healthy rhythm: Respiratory Sinus Arrhythmia (RSA). This is the phenomenon where your heart rate naturally increases slightly during inhalation (sympathetic slight activation) and decreases during exhalation (parasympathetic activation via the vagus nerve). The greater this oscillation, the higher your HRV, particularly the High-Frequency (HF) power. HRV-B training essentially involves breathing in a way that maximizes this RSA, thereby exercising and strengthening your vagal tone.
How HRV Biofeedback Works:
A typical HRV-B session involves using a device (a dedicated sensor or an app with a phone's camera) that provides real-time feedback on your heart rhythm. The goal is to create a smooth, sine-wave-like pattern in your heart rate that is in sync with your breathing.
Proven Benefits of HRV Biofeedback Training:
Decades of clinical research have demonstrated significant benefits:
Smart Rings as Biofeedback Tools (Current State & Future Potential)
Currently, most smart rings are not designed as real-time biofeedback devices. Their strength is in longitudinal tracking, not millisecond latency feedback. However, they play a complementary role:
Starting Your Own HRV-B Practice (Without Fancy Gear):
You can begin harnessing these principles today:
By integrating the science of HRV biofeedback with the tracking power of a smart ring, you move from being a passenger in your body to a skilled pilot, capable of navigating toward a state of greater balance and health. For guided resources on beginning such practices, our blog features practical tutorials and expert advice.
The theoretical benefits of HRV tracking become vividly real when applied to individual lives. These case studies illustrate how data from a smart ring, interpreted thoughtfully, can lead to transformative changes in health, performance, and well-being. (Note: These are composites based on common, documented user experiences and published anecdotes, with details anonymized.)
Case Study 1: The Overtraining Executive (Michael, 42)
Case Study 2: The Anxious New Parent (Sofia, 34)
Case Study 3: The Desk-Bound Professional with Metabolic Concerns (David, 50)
The Common Thread in All Cases:
These stories highlight that HRV's power lies in objectification and personalization. It turned subjective feelings of "tiredness" or "stress" into objective, trackable metrics. It provided personalized feedback ("This is what overtraining looks like for you"; "This food impacts your system negatively") that generic advice cannot. Most importantly, it gave each individual agency—a clear signal to know when to push, when to rest, and how their daily choices directly shaped their physiological resilience. To read more authentic accounts of this transformative process, you can explore user testimonials and experiences.
For those who want to move beyond the app's simplified scores and delve into the nuances of their own physiology, becoming a savvy DIY analyst of your HRV data is immensely rewarding. By learning to "read between the lines" of your graphs, you can uncover personalized insights that generic algorithms might miss. Here’s how to elevate your data literacy.
1. Look Beyond the Single Number: Analyze the Waveform & Trends
2. Master the Correlation Game: Tagging and Journaling
The gold standard for personal insight is correlating your HRV with your life log.
3. Cross-Reference with Other Metrics: The Triangulation Method
HRV in isolation can be misleading. Always interpret it alongside its companion metrics:
4. Understand Your Personal Response Profiles
Everyone has unique physiological "fingerprints." Discover yours:
5. Use Export Functions for Deep Dives
If your app allows data export (CSV format), you can become a true data scientist.
A Word of Caution: Avoiding "Neurotic Tracking"
The goal of advanced analysis is empowerment, not obsession. Set boundaries:
By adopting these DIY analyst practices, you transform your smart ring from a black-box advisor into a transparent research partner. You become the expert on the most important subject in the world: your own body. For more technical guides and analysis deep-dives, our resource library on the blog is continually updated.
To ground this exploration in professional and practical reality, we gathered perspectives from those who work with HRV at the extremes: in clinical medicine, in algorithm development, and in elite performance.
Perspective 1: The Cardiologist (Dr. Anya Sharma, MD)
On Clinical Utility vs. Wellness Tracking:
"Clinically, we've used HRV from Holter monitors for decades, primarily to assess risk post-myocardial infarction. Low HRV is a strong predictor of adverse cardiac events. What's fascinating about consumer devices is the longitudinal view. In my clinic, I get a 24-hour snapshot. A patient with a smart ring can show me months of data. I can see how their nervous system reactivity changed with a new medication, or if their stress management program is actually lowering their sympathetic tone. It's a powerful adjunct for managing conditions like hypertension and anxiety, where autonomic balance is key."
On Limitations and Cautions:
"My primary caution is against self-diagnosis. A low HRV trend does not mean you have heart disease. It's a non-specific stress signal. I've had patients panic over a low score when they simply had a cold. Secondly, these devices measure at the finger (PRV). In patients with significant vascular stiffness or arrhythmias like atrial fibrillation, the pulse arrival time at the finger can be unstable, making the HRV data unreliable. They are wellness tools, not diagnostic ECG monitors."
On the Future:
"The integration of passive, continuous HRV with other biomarkers is the real promise. Imagine a system that flags a user: 'Your HRV has dropped, your nocturnal respiratory rate is up, and your activity is down—consider a telehealth consult.' That's proactive, preventative healthcare."
Perspective 2: The Data Scientist (Mark Chen, Lead Algorithm Engineer, Wearable Tech Co.)
On the Algorithmic Challenge:
"The core problem is separating the biological signal from the physical noise using a sensor that moves on a body that's alive. It's not like filtering noise from a radio signal. We use techniques like adaptive filtering and machine learning models trained on millions of hours of labeled data (where we have simultaneous ECG). The model learns that a specific pattern of accelerometer jiggle combined with a specific PPG distortion usually means motion artifact, not a heart arrhythmia. For HRV, the biggest leap was moving from single-wavelength to multi-wavelength PPG. It gave the algorithm options, like having multiple microphones in a noisy room."
On Personalization:
"The 'magic' isn't in a universal formula. It's in the personal baseline model. We don't just calculate your HRV; we build a dynamic model of what's normal for you across daily, weekly, and seasonal cycles. The algorithm's main job is to detect meaningful deviations from your normal, not from a population average. This is why the first two weeks of data are so crucial—we're training your personal model."
On the Next Frontier:
"On-device AI is the next big shift. Instead of sending raw data to the cloud for processing, the ring's microcontroller will run tiny, efficient neural networks that can detect patterns (like sleep apnea events or arrhythmia signatures) in real time, with greater privacy and speed. Also, multi-sensor fusion beyond accelerometry—like using the temperature sensor to validate PPG signal quality—will make algorithms even more robust."
Perspective 3: The Elite Endurance Athlete (Jenna K., Professional Marathoner)
On Integration into Training:
"HRV is my objective truth-teller. My coach and I can have a plan, but if my morning score is in the red, we adapt. It has saved me from digging myself into a hole of overtraining multiple times. We don't just look at the score; we look at the trend against training load. If my load is high and HRV is stable or rising, that's perfect adaptation. If load is high and HRV is plummeting, it's time to back off. It removes ego from the equation."
On Travel and Recovery:
"It's invaluable for managing travel fatigue. I can see exactly how many nights it takes for my nervous system to recover from a transatlantic flight. It guides when I do my first hard session in a new location. It's also helped me pinpoint that caffeine after 2 p.m. destroys my sleep HRV, which was killing my recovery."
On the Mental Game:
"Seeing a high recovery score gives me a psychological boost going into a key workout or race. I know my body is ready. Conversely, a low score when I'm feeling good teaches me humility—it reminds me that physiology leads perception. It's a tool that fosters both confidence and patience."
These expert insights converge on a common theme: HRV from smart rings is a transformative tool that bridges the gap between clinical medicine, cutting-edge engineering, and daily human performance. Its value is maximized when understood in context, used for trend analysis, and integrated wisely into decision-making processes. For a deeper look at the philosophy driving the creation of such tools, learn about the mission and vision behind our work.
We stand at the precipice of a fundamental shift in healthcare: from reactive treatment of disease to predictive and preventative management of health. In this new paradigm, continuous, passive biometrics like Heart Rate Variability will play a starring role. The long-term vision is not just about tracking how you feel today, but about constructing a dynamic, digital model of your health that can forecast risks and guide interventions long before symptoms appear.
From Monitoring to Modeling: The Digital Twin Concept
The ultimate application of longitudinal HRV data is contributing to your "Digital Twin"—a comprehensive, computational model of your physiology. This model would integrate data from your smart ring (HRV, RHR, sleep, temperature), other wearables, genomic data, blood biomarkers, and lifestyle logs.
Population Health & Medical Research
Aggregated, anonymized HRV data from millions of users represents an unprecedented resource for medical science.
The Evolution of the Smart Ring: The Health Guardian
In this future, the smart ring evolves from a tracker to a health guardian.
Ethical and Societal Imperatives Revisited
This powerful future hinges on navigating the ethical minefield with utmost care. The principles of data sovereignty, privacy-by-design, and algorithmic transparency become even more critical. We must build systems that:
The journey of the smart ring, from a novel way to measure HRV to a cornerstone of predictive health, mirrors the broader trajectory of technology becoming deeply integrated with human biology. It promises a future where we are no longer passive passengers in our health, but informed, proactive pilots with a sophisticated instrument panel guiding our way. To follow the development of these concepts as they move from vision to reality, stay connected with our ongoing research and updates.
Your Trusted Sleep Advocate (Sleep Foundation — https://www.sleepfoundation.org/)
Discover a digital archive of scholarly articles (NIH — https://www.ncbi.nlm.nih.gov/
39 million citations for biomedical literature (PubMed — https://pubmed.ncbi.nlm.nih.gov/)
experts at Harvard Health Publishing covering a variety of health topics — https://www.health.harvard.edu/blog/)
Every life deserves world class care (Cleveland Clinic -
https://my.clevelandclinic.org/health)
Wearable technology and the future of predictive health monitoring. (MIT Technology Review — https://www.technologyreview.com/)
Dedicated to the well-being of all people and guided by science (World Health Organization — https://www.who.int/news-room/)
Psychological science and knowledge to benefit society and improve lives. (APA — https://www.apa.org/monitor/)
Cutting-edge insights on human longevity and peak performance
(Lifespan Research — https://www.lifespan.io/)
Global authority on exercise physiology, sports performance, and human recovery
(American College of Sports Medicine — https://www.acsm.org/)
Neuroscience-driven guidance for better focus, sleep, and mental clarity
(Stanford Human Performance Lab — https://humanperformance.stanford.edu/)
Evidence-based psychology and mind–body wellness resources
(Mayo Clinic — https://www.mayoclinic.org/healthy-lifestyle/)
Data-backed research on emotional wellbeing, stress biology, and resilience
(American Institute of Stress — https://www.stress.org/)

