The Beginner-Friendly Guide to Making Sense of Sleep Stage Numbers
A beginner's guide to making sense of sleep stage numbers.
The Beginner-Friendly Guide to Making Sense of Sleep Stage Numbers
You wake up, grab your phone, and open your health app. A sleep score stares back—85. Good. But then you scroll down and enter a maze of percentages, graphs, and terms that feel like a foreign language: Light Sleep 55%, Deep Sleep 18%, REM 22%, Awake 5%. Your heart rate dipped to 52 bpm at 3:14 AM. Your HRV averaged 42 ms. You cycled through 4 sleep cycles.
What does any of it actually mean? Is 18% deep sleep good? Should you be worried about that 5% awake time? And most importantly, what are you supposed to do with this data?
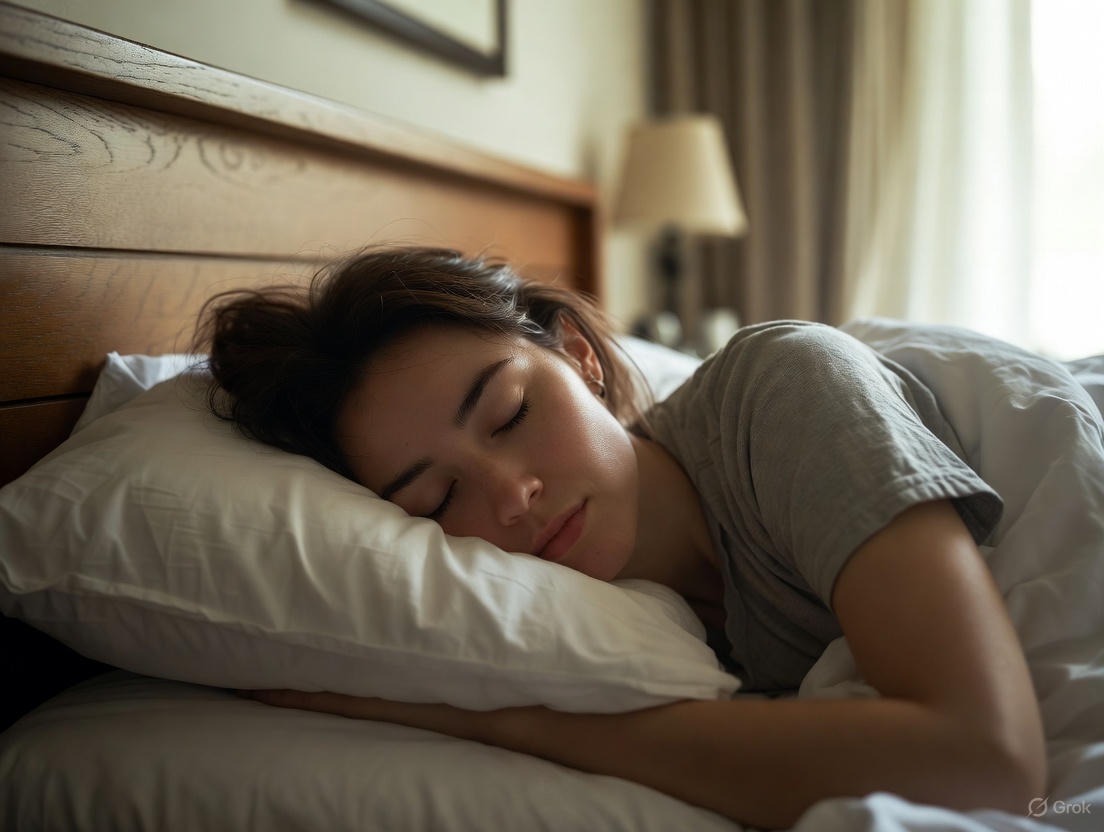
For years, sleep tracking was the domain of scientists in white coats, hooked up to intimidating machines in sterile labs called polysomnograms. Today, that powerful technology sits quietly on your finger in the form of a smart ring, collecting millions of data points while you dream. We’ve gone from knowing nothing about our nightly journeys to being overwhelmed with too much information, without a manual to interpret it.
This guide is that manual. We’re going to demystify every number, graph, and metric your sleep tracker throws at you. We’ll move beyond the simple sleep score and dive deep into the fascinating architecture of your night. You’ll learn not just what the numbers are, but what they reveal about your physical restoration, mental processing, and overall health. This isn't about chasing perfection; it's about understanding your unique patterns, identifying opportunities for better rest, and using data to genuinely improve your waking life. Forget confusion. Let’s build comprehension, one sleep stage at a time.
What Are Sleep Stages, Really? The Nightly Journey of Your Brain and Body
Before we can interpret the numbers, we need to understand the story they’re telling. Sleep is not a monolithic state of "being unconscious." It’s a dynamic, highly organized process—a carefully choreographed ballet between your brain and body with distinct acts and scenes. These acts are the sleep stages.
Imagine your brain at night isn't shutting down, but rather switching channels. Each channel serves a different, vital purpose. Scientists classify these channels into two broad types: Non-Rapid Eye Movement (NREM) sleep and Rapid Eye Movement (REM) sleep. Your night is a series of cycles, each lasting about 90-120 minutes, that sequentially move through stages of NREM sleep before culminating in a period of REM sleep.
NREM Sleep is divided into three stages, often simplified by consumer trackers as Light Sleep (N1 & N2) and Deep Sleep (N3).
Stage N1 (Light Sleep): This is the doorway to sleep, lasting only a few minutes. Your muscles relax, your brain waves begin to slow from their daytime wakefulness patterns, and you can be easily awakened. Think of it as the "dozing off" phase.
Stage N2 (Light Sleep): You are now officially asleep. Your heart rate slows, your body temperature drops, and your brain shows specific wave patterns called sleep spindles and K-complexes. These are thought to play a role in memory consolidation and protecting sleep from being disrupted by external noises. You spend nearly half of your total sleep time in this stage.
Stage N3 (Deep Sleep or Slow-Wave Sleep): This is the most physically restorative phase. It’s notoriously hard to wake from. Your brain emits slow, rolling delta waves. Blood flow is directed less toward your brain and more toward your muscles, facilitating tissue repair, growth hormone release, and immune system strengthening. This is the "healing" sleep.
REM Sleep is the final channel in the cycle, often associated with vivid dreams.
Your brain becomes incredibly active, with patterns resembling wakefulness. Your eyes dart rapidly beneath your lids (hence the name).
However, a fascinating paralysis sets in for your major voluntary muscle groups, preventing you from acting out your dreams.
This stage is crucial for emotional processing, memory integration, creativity, and learning. Your brain is essentially sorting, filing, and making sense of the previous day’s experiences.
This cyclical journey—Light → Light → Deep → REM—repeats itself 4-6 times each night. But the composition of each cycle isn't identical. Early in the night, cycles are dominated by deep N3 sleep. As the night progresses, deep sleep episodes shorten, and REM sleep periods lengthen. This is why you often wake from a dream in the morning—you’re likely exiting a long, final REM period.
Your smart ring doesn’t have electrodes glued to your scalp. So how does it know all this? It uses a combination of sophisticated sensors and complex algorithms to infer these brain states from physiological signals it can measure from your finger—like heart rate, heart rate variability, body temperature, and movement. For a deep dive into how this technological magic works, from sensor to app notification, explore our detailed breakdown on the technology behind sleep stage classification.
Understanding this basic architecture is the foundation. Now, let’s look at the tool that captures this nightly performance.
Meet Your Sleep Tracker: How a Device on Your Finger Knows Your Brain's State
It seems almost like science fiction: a sleek ring you wear to bed can tell you how long you dreamed. The leap from a hospital polysomnogram (PSG)—with its dozens of wires, scalp electrodes, chest belts, and nasal cannulas—to a comfortable, unassuming wearable is one of the most significant triumphs of modern health-tracking technology. But how does it achieve this feat without reading your brain waves directly?
The secret lies in physiological proxies and data fusion. While a PSG measures the direct electrical activity of the brain (EEG), your ring measures the downstream effects of that brain activity on your body. It then uses intelligent algorithms, often developed and validated against PSG data, to make highly accurate predictions about your sleep stages.
Here are the key data streams your ring uses to piece together the puzzle:
Heart Rate (HR) & Heart Rate Variability (HRV): This is the primary workhorse. Your heart doesn't beat like a metronome; the subtle, millisecond variations between beats (HRV) are intimately tied to your autonomic nervous system. During deep NREM sleep, your parasympathetic ("rest-and-digest") system is dominant, leading to a slower, very steady heart rate and higher HRV. During REM sleep, your brain is active, and your heart rate can become variable and even spike, resembling wakefulness, but without the movement. The ring tracks this through photoplethysmography (PPG), where LED lights in the ring measure blood volume changes in the capillaries of your finger. The accuracy of this method is paramount, which is why we've detailed how modern health-tracking technology measures HRV accurately against clinical standards.
Movement (Accelerometer): A tiny motion sensor detects gross body movement and, more importantly, the lack thereof. Waking periods are typically associated with movement. The transition into sleep sees movement drop off. Deep sleep is characterized by profound physical stillness. The clever interpretation of these movement patterns is what allows the ring to distinguish rest from sleep and identify potential disturbances. Discover more on how this technology interprets complex movement patterns in our dedicated article.
Body Temperature: Your core body temperature naturally dips overnight as part of your circadian rhythm, reaching its nadir in the early morning hours. A smart ring with a temperature sensor (often a thermistor) can track this distal temperature trend from your finger. More than just the trend, brief, subtle temperature fluctuations can correlate with sleep stage transitions and are a key component in the revolution sleep science is undergoing thanks to continuous monitoring.
Respiratory Rate: By analyzing the subtle, rhythmic patterns in your PPG signal caused by breathing, the ring can estimate your breaths per minute. Respiratory rate typically slows and becomes very regular during deep sleep.
The true genius is in the combination. An algorithm doesn't look at heart rate alone. It asks: "Is the heart rate slow and steady while the body is completely still and the temperature is dropping?" That pattern strongly suggests deep sleep. "Is the heart rate variable and higher while the body is paralyzed but the eyes (inferred) are active?" That points to REM.
This process of multi-sensor data fusion is what transforms raw sensor data into a coherent sleep stage chart. It’s a computational marvel that happens seamlessly on the device or in the cloud. To appreciate the scale, consider that your ring is making thousands of these inferences per night, processing billions of data points over time to build your unique sleep profile. Learn about the immense data processing power required for these real-time insights.
Now that you know how the numbers are generated, let’s start with the most prominent one: your total sleep time.
The Foundation: Demystifying Your "Total Sleep Time" & "Time in Bed"
At first glance, this seems straightforward: the clock time between when you go to bed and when you get up. But in the precise world of sleep tracking, this is where our first important distinction is made. Your app will likely show you two different numbers: Time in Bed and Total Sleep Time (TST). Understanding the gap between them is your first step toward sleep literacy.
Time in Bed is exactly what it sounds like. It’s the duration from the moment you get into bed (and your device detects minimal movement, assuming you're trying to sleep) to the moment you get out of bed in the morning. It’s your total opportunity for sleep.
Total Sleep Time (TST) is the actual time you spent asleep within that window. This is calculated by subtracting all periods of "Wake" or "Awake" from your Time in Bed.
The Difference = Your "Wake After Sleep Onset" (WASO). This is a critical metric! If you were in bed for 8 hours but your TST is 7 hours and 10 minutes, it means you spent 50 minutes awake during the night. This could be one long period of lying awake with anxiety, or it could be a dozen brief, natural micro-awakenings that you don’t even remember.
What’s a "Good" Total Sleep Time? The gold-standard public health recommendation for adults is 7-9 hours of actual sleep (TST) per night. Consistently falling below 7 hours is associated with increased health risks. However, this is a population average. Your personal need might be 6.5 hours or 9.5 hours. The key is to find the amount that allows you to feel alert and function optimally during the day.
The Efficiency Metric: Many apps will calculate a Sleep Efficiency percentage: (Total Sleep Time / Time in Bed) x 100. Aiming for an efficiency above 85% is generally considered good. It means you’re spending most of your time in bed actually asleep. A low efficiency score (e.g., 75%) is a flag that you might be spending too much time tossing and turning, which could indicate poor sleep hygiene, stress, or an underlying issue.
Beginner Insight: Don't obsess over hitting exactly 8 hours. Focus first on the consistency of your schedule and maximizing your Sleep Efficiency. Going to bed and waking up at roughly the same time every day (yes, even on weekends) is more foundational for sleep quality than a single night of long duration. If you see a pattern of high WASO, that’s a more specific problem to address than simply trying to go to bed earlier.
Total sleep time is the canvas. Now, let’s look at the paint that creates the picture: the percentage breakdown of your night.
The Sleep Stage Breakdown: What Your Light, Deep & REM Percentages Actually Mean
Open your sleep report. The centerpiece is almost always a colorful bar chart or pie graph showing what percentage of your Total Sleep Time you spent in Light, Deep, and REM sleep. These percentages are where most of the mystery—and anxiety—lies. Let’s decode what’s normal, what’s variable, and what might be a true signal for change.
First, a crucial paradigm shift: There is no single "perfect" number for each stage. Sleep architecture varies significantly by age, genetics, lifestyle, and even night-to-night. Instead, we look at healthy ranges.
Light Sleep (Typically N1 & N2 Combined)
What it is: The transitional and stable "core" of your sleep. This is where you spend the majority of the night.
Typical Healthy Range: 50-60% of your total sleep. For an 8-hour sleeper, that’s roughly 4 to 4.8 hours.
What the Number Tells You: Light sleep is essential for memory processing (especially N2 spindles) and serves as the connective tissue between deep and REM cycles. A percentage significantly higher than 65% might suggest you’re not cycling effectively into the deeper, more restorative stages, possibly due to fragmentation from disturbances (noise, pain, sleep apnea) or environmental factors. A very low percentage is less common but could indicate an irregular pattern.
Deep Sleep (N3 or Slow-Wave Sleep)
What it is: The physically restorative "healing" sleep. This is when your body repairs tissues, builds bone and muscle, and strengthens the immune system.
Typical Healthy Range: 13-23% for most adults. For 8 hours of sleep, that’s about 1 to 1.8 hours. It’s normal for deep sleep to decrease with age.
What the Number Tells You: This is the stage people often worry about most. Seeing your deep sleep dip on a single night after a hard workout, stress, or alcohol consumption is completely normal. The body prioritizes deep sleep early in the night, so if your total sleep is cut short, you might miss some REM but you’ll likely still get most of your deep sleep. Chronic low deep sleep (consistently below 10%) could be a sign of chronic sleep deprivation, high stress, or physical pain, and is worth investigating. It’s also the stage most prominently tracked by recovery-focused algorithms in modern wearables.
REM Sleep
What it is: The mentally restorative "dreaming" sleep, vital for learning, mood regulation, and creativity.
Typical Healthy Range: 20-25% for adults. For 8 hours, that’s about 1.6 to 2 hours.
What the Number Tells You: REM sleep periods get longer as the night progresses. Therefore, if you consistently cut your sleep short, you are disproportionately robbing yourself of REM sleep. This can impact cognitive function and emotional resilience. Alcohol is a potent REM sleep suppressor, which is why you might not dream (or remember dreams) after drinking, even if you sleep a long time. A consistently very low REM percentage could be linked to certain medications (like some antidepressants) or significant sleep schedule disruption.
The Takeaway: Look at trends, not single nights. Your sleep stage percentages are a dynamic system. If you have a high-stress day, your deep sleep might decrease slightly that night as your body manages the stress response. The next night, you might see a "rebound" effect. The power of a smart ring is seeing these patterns over weeks and months, allowing you to connect lifestyle choices to their tangible impact on your sleep architecture. For example, you can see how your body temperature trends correlate with your deep sleep duration, offering profound personal insight.
Now, let's examine the structure that organizes these stages: your sleep cycles.
The Architecture of the Night: Understanding Sleep Cycles & Continuity
If sleep stages are the individual scenes in a play, sleep cycles are the acts. A sleep cycle is a complete progression through the stages of NREM sleep (Light to Deep) and into a period of REM sleep. A full night's sleep is composed of multiple, sequential cycles.
Cycle Duration: Each cycle typically lasts 90 to 120 minutes. The first cycle of the night often contains the longest period of deep sleep. As the night goes on, deep sleep duration within each cycle shortens, while REM sleep duration lengthens. Your final cycle in the morning may be almost entirely Light and REM sleep.
Number of Cycles: In a full 7.5 to 9-hour night, you will typically complete 4 to 6 cycles. The goal is not to maximize the number of cycles, but to complete them without major interruption.
Why Cycle Understanding is Powerful:
It Explains Your Morning Grogginess: If your alarm jolts you out of deep sleep (more likely in an earlier cycle) or even the middle of a REM period, you will experience "sleep inertia"—that heavy, disoriented, groggy feeling. Waking naturally near the end of a cycle, as you transition from REM to very light sleep, leads to a more refreshed feeling. Many smart ring apps use this principle to offer a "smart alarm" that vibrates within a gentle window of time when you are in light sleep.
It Highlights Fragmentation: The most restorative sleep is continuous sleep. A metric often hidden but crucial is sleep fragmentation—how many times your sleep was disrupted. You can have a decent total sleep time, but if it’s fractured into pieces by frequent awakenings (visible as many short "awake" segments on your graph), you may not be completing full, healthy cycles. This is why simply counting hours is insufficient. Continuity is king.
The "Awake" Time Mystery: Seeing "Awake: 5%" on your report can be alarming. But not all awake time is equal. It is completely normal to have brief arousals (5-30 seconds) between sleep cycles that you do not recall. Your tracker logs these, but they are part of a healthy sleep architecture. Problematic awake time is prolonged (several minutes) or frequent, breaking the continuity of your cycles.
Beginner Action Step: Look at your sleep stage graph. Can you see the rhythmic wave-like pattern of cycles repeating through the night? Each "valley" is likely a deep sleep phase, and each peak of brain activity is a REM phase. Appreciating this architecture helps you see sleep as a process, not a static state. If your graph looks like a chaotic city skyline with frequent spikes of "awake," your sleep continuity is poor, and that’s a more important focus than any single stage percentage. Understanding how your device handles motion artifacts to distinguish true wakefulness from simple movement in sleep is key to trusting this data.
With the architecture mapped, we encounter one of the most insightful—and misunderstood—metrics: Heart Rate Variability during sleep.
While you sleep, your cardiovascular system tells a profound story. Two key metrics—Nighttime Resting Heart Rate (RHR) and Heart Rate Variability (HRV)—are windows into your autonomic nervous system balance and overall recovery status. For many, these numbers from sleep are more meaningful than daytime readings, as they are measured in a controlled, resting state, free from the variables of activity, food, and caffeine.
Nighttime Resting Heart Rate (RHR)
What it is: Your lowest, most consistent heart rate during sleep, typically reached during deep sleep phases. It’s often lower than your daytime resting rate.
What it Means: A lower nighttime RHR generally indicates better cardiovascular fitness and efficient parasympathetic ("rest-and-digest") nervous system dominance during rest. It’s normal for RHR to dip 10-20 beats below your daytime average.
How to Read It: Look at the trend, not the single number. A sudden, unexplained increase in your average nighttime RHR over several nights can be a very early sign that your body is fighting something—it could be the onset of an illness, excessive training load, dehydration, or high stress. Your body is working harder, even at rest. This predictive capability is one of the most powerful features of continuous wearables, as detailed in our article on how health-tracking technology can detect disease early.
Heart Rate Variability (HRV) During Sleep
What it is: HRV measures the subtle variations in time between each heartbeat. Contrary to intuition, a higher HRV generally indicates better health, resilience, and recovery. It shows your heart is responsive to the subtle demands of your nervous system. A low, rigid HRV suggests your body is under strain (physical, mental, or immunological).
Why Sleep HRV is Gold Standard: Measuring HRV during sleep provides the cleanest, most consistent reading, free from the noise of daily life. Your app will likely show an average nightly HRV and maybe a graph of HRV throughout the night.
How to Read It:
Trend is Everything: Your personal baseline is unique. One person’s "high" is another’s "low." The critical insight comes from watching the trend over weeks.
A rising trend or consistently high HRV suggests good adaptation to training, effective recovery, and low stress.
A sharp drop or consistently low HRV is a red flag. It’s your body’s objective signal that it’s struggling to recover. This is a prime indicator to take a rest day, prioritize sleep, or manage stress.
Nightly Pattern: HRV typically peaks during deep sleep (high parasympathetic activity) and drops during REM sleep (sympathetic "brain awake" activity). Seeing this pattern is a sign of healthy sleep architecture.
The Synergy: Often, you’ll see RHR and HRV move in opposite directions. As your body gets stressed or overloaded, your nighttime RHR creeps up while your HRV drops down. This one-two punch is a clear, data-driven message from your body to pull back and recover. This biological signaling is the core engine that powers modern readiness and wellness scores in advanced health ecosystems.
Next, we turn to a more recent and powerful metric in the sleep-tracking arsenal: temperature.
The Temperature Tale: What Your Nightly Body Temperature Trends Reveal
For decades, sleep trackers focused on movement and heart rate. The integration of continuous body temperature monitoring has been a game-changer, adding a fundamental layer of biological insight. Your body temperature isn't static; it follows a circadian rhythm, dipping at night to initiate and maintain sleep, and rising in the morning to promote wakefulness. A smart ring with a temperature sensor, placed on the thermally sensitive finger, is uniquely positioned to track this rhythm.
The Ideal Curve: In a well-aligned, healthy individual, the temperature graph from a night of sleep should show a gradual decline after bedtime, reaching its lowest point (nadir) typically in the second half of the night (around 4-5 AM), followed by a steady rise toward morning wake-up. This rise is partly what helps you wake up feeling alert.
What Deviations Can Tell You:
A Flattened Curve: If your temperature doesn't drop much or stays elevated, it can signal poor sleep initiation, insufficient deep sleep, or an underlying issue like inflammation. It may also indicate your circadian rhythm is out of sync with your bedtime (e.g., you're trying to sleep during your biological "day").
A Spike in the Middle of the Night: This can correlate with a waking period, a stress response, or even the hormonal changes of a woman’s menstrual cycle. For women, tracking temperature is invaluable for understanding the intricate patterns of their reproductive health across the month.
Consistently High Baseline: An overall elevated distal temperature trend over many nights can be an early sign of infection, overtraining, or chronic stress—your body is in a heightened state of metabolic activity.
Temperature and Sleep Stages: There’s a fascinating link. The onset of deep sleep (N3) is associated with a drop in core body temperature as blood is redirected away from the core to the extremities (like your hands) to dissipate heat. A ring on your finger can detect this release. Therefore, a good temperature drop often coincides with quality deep sleep. Conversely, a night with little temperature drop often correlates with poor deep sleep.
Beyond Single Nights: The real power of temperature tracking is in establishing your personal baseline and spotting deviations. A single night's reading is just a dot. Over weeks, you get a line—your personal rhythm. This allows the technology to adapt to your individual baselines, making alerts and insights truly personalized. Seeing your temperature trend rise a full day before you feel symptoms of a cold is a profound example of predictive health.
Temperature is a deep, slow wave. Another nocturnal metric is faster and tied to every breath: your respiratory rate.
The Breath of Sleep: Understanding Respiratory Rate & Blood Oxygen
While you sleep, your breathing becomes an automatic, regulated process. Tracking its rate and effectiveness provides clues about sleep quality and potential health considerations.
Respiratory Rate (RR)
What it is: The number of breaths you take per minute. Unlike heart rate, it’s a remarkably stable metric in healthy adults, typically ranging from 12 to 20 breaths per minute while awake. During sleep, it naturally slows down.
What it Means: During stable, deep NREM sleep, your breathing becomes very slow, deep, and regular. During REM sleep, it can become faster, more variable, and even irregular—mirroring the brain activity of that stage. Your tracker will provide an average nightly respiratory rate.
How to Read It: Look for consistency. A significant, sustained increase in your average nighttime respiratory rate over time could be a subtle sign of respiratory effort, perhaps due to allergies, asthma, or the early stages of a respiratory infection. Like RHR, it’s a trend-based biomarker.
Blood Oxygen Saturation (SpO2)
What it is: The percentage of your hemoglobin that is carrying oxygen. A healthy, waking level is typically 95-100%. During sleep, it’s normal for it to dip slightly due to changes in breathing patterns, but it should generally stay above 90%.
What it Means: Continuous SpO2 monitoring during sleep is primarily used to screen for potential sleep-disordered breathing, like sleep apnea. In apnea events, breathing repeatedly stops or becomes very shallow, causing blood oxygen levels to drop (called desaturations).
How to Read It: Your app may show an average SpO2 and/or a graph. Pay attention to:
Average Below 90%: This warrants discussion with a healthcare provider.
Multiple Significant Dips: A graph that looks like a series of sharp valleys, especially if they correspond with snoring or gasping (which a partner might report), can be indicative of fragmented breathing. While a consumer ring is not a diagnostic medical device, it can provide powerful evidence to take to a doctor for further evaluation. The technology enabling this through a ring is a marvel of miniaturization, which you can read about in our piece on the achievement of health-tech miniaturization.
Important Note: These metrics (especially SpO2) are for health awareness and trend observation, not diagnosis. They are powerful tools for starting a conversation with a professional, who can then order appropriate clinical tests.
We've now covered the core physical metrics. But how do you synthesize them into a single, understandable score? That's the role of the algorithm.
From Data to Dashboard: How Your Sleep Score is Calculated (And What It Leaves Out)
You’ve looked at the raw numbers—the percentages, the heart rate, the time. Now you glance at the top of your app: Sleep Score: 82. This single number is designed to give you an immediate, overall sense of your night. But what’s in the secret sauce? While every brand has its own proprietary algorithm, most sleep scores are weighted composites of several key factors:
Total Sleep Duration: Did you meet your personal sleep time goal? This is usually a foundational component. Getting significantly less than your target will cap your score.
Sleep Efficiency: How much of your time in bed was spent actually sleeping? High efficiency (low WASO) boosts the score.
Sleep Stage Balance: Did you get sufficient amounts of both Deep and REM sleep? The algorithm compares your percentages to healthy population ranges or, more sophisticatedly, to your own personal baseline.
Restoration Metrics: This is where data like nighttime RHR, HRV, and temperature drop come in. Did your body show strong signs of physiological recovery? A low RHR and high HRV will contribute positively.
Sleep Consistency/Timing: Some scores factor in whether you went to bed and woke up at a consistent time, aligned with your circadian rhythm.
The Pros of a Sleep Score:
Simplicity: It provides a quick, at-a-glance assessment.
Motivation: It can gamify healthy sleep habits, encouraging you to improve your number.
Trend Tracking: Watching your score over weeks is easier than comparing ten different graphs.
The Cons & What It Leaves Out:
The "Why" is Hidden: A score of 75 doesn't tell you why. Was it low duration, poor efficiency, or low deep sleep? You must dive into the details to take action.
Subjectivity of Feeling: You can have a numerically "good" score but still feel tired. The score can't capture how you feel subjectively, which can be influenced by sleep quality factors it might not fully measure (e.g., sleep cycle timing relative to alarm). This is why the best apps also allow you to log your subjective mood, which helps the system validate or compare against your subjective health feelings.
Personal Baselines: Early on, the score uses population averages. Over time, the best algorithms learn your normal. A night that gives you a score of 80 might be your version of excellent, even if it's not "perfect."
Beginner's Rule: Use the sleep score as your dashboard warning light. If it's green (high), you're likely on track. If it's yellow or red (low), let it prompt you to open the hood and investigate the detailed metrics—the percentages, the HRV, the awake time—to diagnose the issue. The score starts the conversation; the detailed data provides the answers.
Finally, with all this data in hand, how do you move from passive observation to active improvement? It starts with establishing what's normal for you.
Establishing Your Baseline: Why Your "Normal" is the Only Metric That Matters
This is the most important concept in this guide. After the initial fascination with absolute numbers ("Is 18% deep sleep good?"), the true transformation happens when you stop comparing yourself to population averages and start comparing yourself to yourself.
Your sleep is as unique as your fingerprint. Your genetics, age, lifestyle, stress levels, training regimen, and diet all create a personal sleep signature. The 22-year-old elite athlete, the 45-year-old shift worker, and the 60-year-old retiree will have wildly different "normal" sleep architectures. Your smart ring’s greatest gift is the ability to learn and reveal this personal baseline over time.
How to Establish Your Baseline:
Wear It Consistently: Aim for at least 2-4 weeks of near-nightly wear, under your regular life conditions (not just on vacation). This captures a variety of days—stressful, relaxing, workout days, rest days.
Observe Averages, Not Nights: After this period, ignore the single night’s data. Look in your app for weekly or monthly averages. What is your average deep sleep percentage? Your average nighttime HRV? Your average time to fall asleep? These are your baseline numbers.
Note Your Range: Your baseline isn't a single point; it's a range. For example, your deep sleep might typically fluctuate between 15% and 22%. Your HRV might range from 35ms to 55ms. Knowing this healthy range is crucial.
Why This is Revolutionary:
Personalized Insights: Once your baseline is known, the app can flag meaningful deviations. If your HRV suddenly drops to 25ms—well below your normal range—that’s a powerful, personalized alert, even though 25ms might be "normal" for someone else.
Connecting Cause and Effect: Did your deep sleep plummet and your RHR spike for two nights? Check your calendar. Did you have two late nights of work and drink alcohol? You’ve just quantified the exact impact of that behavior on your body. This turns guesswork into knowledge.
Tracking Progress: As you make lifestyle changes—prioritizing a consistent bedtime, managing evening screen time, starting a meditation practice—you can see if your baseline metrics actually improve over months. Does your average HRV trend upward? Does your sleep efficiency stabilize? This is objective proof that your changes are working.
This foundational self-knowledge is what enables the most advanced feature of these devices: personalized, actionable recommendations. The system isn't giving you generic advice; it's learning what you need based on your data.
Now you have the knowledge. In the next section, we'll bridge from understanding to action, beginning with the first and most powerful lever you can pull to improve every number on your sleep report.
The First Step to Better Numbers: Mastering Sleep Consistency & Your Circadian Rhythm
You now possess a detailed map of your sleep landscape. But a map is only useful if it guides you to a better destination. The single most effective, scientifically proven intervention to improve nearly every metric on your sleep report isn't a supplement, a gadget, or a magic pill. It’s breathtakingly simple, utterly free, and often surprisingly difficult: going to bed and waking up at the same time every day.
This practice, known as sleep consistency, is the cornerstone of sleep hygiene because it directly strengthens your circadian rhythm—your body’s internal 24-hour master clock. This rhythm governs not just sleep and wakefulness, but also hormone release (like cortisol and melatonin), body temperature, digestion, and cellular repair. When your sleep schedule is erratic, you are essentially giving your body’s systems conflicting time zones, creating a state of internal jet lag known as social jet lag.
How Inconsistency Sabotages Your Numbers:
It Fragments Sleep Architecture: An irregular schedule confuses your brain about when to initiate deep sleep and when to initiate REM sleep. You may fall asleep quickly one night after being sleep-deprived, but the quality and structure of that sleep will be disordered. You might see more light sleep, less deep or REM sleep, and more frequent awakenings (higher WASO).
It Blunts Sleep Drive: Your sleep-wake cycle is a balance between two systems: your circadian rhythm (the "alertness" clock) and your homeostatic sleep drive (the "sleep pressure" that builds the longer you're awake). A consistent wake time anchors your circadian rhythm. If you sleep in on Sunday, you reduce your sleep drive for Sunday night, making it harder to fall asleep at your usual time, perpetuating a cycle of late nights and groggy mornings. This directly impacts your Sleep Efficiency and Time to Fall Asleep metrics.
It Wreaks Havoc on Physiological Metrics: An off-kilter circadian rhythm disrupts the natural nightly dip in heart rate and body temperature. You might see your nighttime RHR stay elevated, your HRV lower, and your temperature curve appear flat or mis-timed. Your body doesn’t know when to fully enter "rest and repair" mode.
The Practical "How-To" for Consistency:
Anchor Your Wake Time: Start by fixing your wake-up time. Set an alarm for the same time every single day—weekdays, weekends, holidays. This is the most powerful lever for setting your clock. Even if you had a poor night's sleep, get up at the anchor time. Expose yourself to bright light (ideally sunlight) within 30 minutes of waking. This sends the strongest possible "IT IS MORNING" signal to your brain.
Calculate Backwards for Bedtime: Determine your needed Total Sleep Time (e.g., 7.5 hours). Count backwards from your fixed wake time to set a target bedtime. Aim to be in bed, ready to sleep, at that time.
The Weekend Rule: The maximum allowable deviation from your schedule should be no more than 60 minutes. Sleeping in until 10 AM on a Saturday when you normally wake at 7 AM is a 3-hour circadian shift—the equivalent of flying from New York to California. Your sleep data on Saturday night and Sunday will show the cost.
Let Your Ring Guide You: Many advanced apps now offer circadian rhythm tracking and predictions. They can show you your personal "ideal window" for sleep based on your historical data and warn you when you’re drifting off schedule. This transforms a vague intention into a data-driven target.
The Data Payoff: Within one to two weeks of strict consistency, observe your trends. You will likely see:
Improved Sleep Efficiency (less time tossing and turning).
A more stable and lower Nighttime RHR.
A clearer, more pronounced dip in your temperature graph.
An increase in your Sleep Score consistency.
Most importantly, you’ll feel more alert during the day. Your subjective feeling will begin to align with your objective data, which is the ultimate goal of this entire process.
Mastering consistency is the bedrock. Once that foundation is solid, you can begin to engineer the perfect environment for your sleep stages to flourish.
Crafting the Sleep Sanctuary: How Your Environment Directly Shapes Your Stage Data
Your sleep environment is the stage upon which the nightly ballet of sleep cycles performs. If the stage is uncomfortable, too bright, or too loud, the performance will be clumsy and fragmented. The data from your smart ring is exceptionally good at revealing environmental intrusions. By optimizing your bedroom, you are directly programming better numbers.
1. The Darkness Factor: Light’s Assault on Melatonin and Deep Sleep
Light is the primary regulator of your circadian rhythm. Even small amounts of blue and green light spectrum (from LEDs, streetlights, or electronics) can suppress melatonin production, the hormone that signals "sleep time" to your body.
The Data Impact: Exposure to light after your target bedtime can delay the onset of deep sleep, reduce overall deep sleep percentage, and increase sleep fragmentation. You might see a longer "Time to Fall Asleep" and more "Awake" periods in the first half of your graph.
Actionable Fixes:
Pitch Blackness: Invest in blackout curtains or a high-quality sleep mask. Your goal is to not see your hand in front of your face.
Eliminate Electronics: Banish TVs, charging LEDs, and digital clocks with bright displays. Use electrical tape to cover any persistent tiny lights.
Red Light for Night: If you need a nightlight, use a dim red bulb, as red light has the least impact on melatonin.
Sunrise Simulation: Consider a dawn-simulating alarm clock that uses gradually increasing light to wake you, working with your circadian rhythm rather than against it.
2. The Soundscape: Noise, Fragmentation, and the Mystery of "Light Sleep"
Noise is a prime culprit for sleep fragmentation. You may not fully wake up and remember it, but even background traffic, a partner's snoring, or a refrigerator cycling on can cause micro-arousals that pull you out of deeper stages into lighter sleep.
The Data Impact: The primary signature of a noisy environment is an inflated Light Sleep percentage and a suppressed Deep Sleep percentage. Your graph will show more frequent, small disruptions. Your HRV may also be lower due to the constant low-grade stress response.
Actionable Fixes:
White Noise/ Pink Noise: A constant, masking sound like a white noise machine, fan, or app can drown out irregular, disruptive noises. Research suggests pink noise may even help stabilize and deepen sleep.
Earplugs: High-fidelity musician's earplugs or molded silicone plugs can be game-changers for light sleepers.
Soundproofing: Simple measures like heavy rugs, curtains, and sealing gaps under doors can dampen external noise.
3. The Thermostat: Why Temperature is a Direct Deep Sleep Lever
As discussed, your body needs to drop its core temperature to initiate and maintain deep sleep. A bedroom that’s too warm is one of the most common yet overlooked enemies of sleep quality.
The Data Impact: A hot room will flatten your temperature trend graph, correlate with less Deep Sleep, and increase Wake After Sleep Onset (WASO) as you toss and turn to thermoregulate. You can literally watch your temperature fail to drop on a hot night and see the corresponding poor sleep stage balance.
Actionable Fixes:
The Goldilocks Zone: For most people, the ideal bedroom temperature is between 60-67°F (15.5-19.5°C). Use your ring’s temperature data to experiment! If you see a good temperature drop and great deep sleep one night, note the room temperature.
Cooling Strategies: Use breathable, moisture-wicking bedding (like cotton or Tencel). Consider a cooling mattress pad or pillow. A hot shower 60-90 minutes before bed can actually help by drawing heat out of your core to your extremities as you cool down afterward.
4. The Comfort Equation: Movement, Pressure, and Disruption
Physical discomfort from a poor mattress, bad pillow, or restrictive bedding causes micro-movements that prevent sustained, undisturbed sleep cycles.
The Data Impact: Discomfort leads to increased movement logged by the accelerometer, which the algorithm may interpret as light sleep or brief awakenings. It directly harms Sleep Continuity.
Actionable Fixes: This is personal, but your data can guide you. If you wake with aches or see high movement, it’s time to assess your mattress support and pillow alignment. The investment here pays dividends across every health metric.
The Experiment: For one week, commit to optimizing just one of these four pillars. Make your room pitch black. Observe your data the next morning and over the week. Did your deep sleep increase? Did you fall asleep faster? This direct feedback loop—action → data → result—is how you become the architect of your own recovery. The ring provides the proof that your efforts are working, turning abstract advice into a personalized science project.
With your environment optimized, we turn to the fuel that runs the system: your daily habits and their profound, measurable impact on your night.
The Day-Before Effect: How Diet, Exercise, and Stress Today Write Tomorrow's Sleep Report
Your sleep is not an isolated event. It is the final act of a play that began when you woke up. The choices you make throughout the day—what you eat, how you move, and how you manage stress—are the scriptwriters for your night. Your smart ring data is the unbiased critic, reviewing the performance each morning.
1. The Double-Edged Sword of Exercise
Physical activity is one of the best promoters of sleep quality, but its timing and intensity are crucial.
The Data Impact:
Moderate, Regular Exercise: Consistently correlates with shorter time to fall asleep, increased Deep Sleep percentage, and a more robust nighttime dip in RHR. Exercise builds healthy sleep pressure and helps regulate circadian rhythms.
Late, High-Intensity Exercise: Working out too close to bedtime (within 2-3 hours for most people) can raise core body temperature, elevate heart rate, and stimulate the sympathetic nervous system ("fight-or-flight"), making it harder to wind down. This may show up as elevated pre-sleep and early-night RHR, a delayed temperature drop, and reduced Sleep Efficiency.
The Smart Ring Insight: Use your HRV and RHR trends as your guide. If you do a hard evening workout and see your HRV plummet and your RHR spike the next morning, your body is telling you it struggled to recover. Consider moving intense sessions earlier. The ring helps you distinguish between beneficial training stress and counterproductive overload, a key function of recovery-focused algorithms.
2. The Chemical Culprits: Caffeine, Alcohol, and Heavy Meals
Caffeine: This adenosine (a sleep-promoting chemical) blocker has a half-life of 5-6 hours. A 3 PM coffee means 25% of its caffeine is still in your system at 9 PM.
Data Impact: Can significantly increase Time to Fall Asleep and reduce Deep Sleep, even if you feel you "slept fine." It can also cause more subtle sleep fragmentation.
Alcohol: It’s a sedative, not a sleep aid. It knocks you out but severely disrupts sleep architecture.
Data Impact: The signature is severely suppressed REM sleep in the first half of the night (often with no dream recall) and rebound, fragmented light sleep in the second half as the alcohol metabolizes. You’ll see high Wake After Sleep Onset after 2-3 AM, elevated nighttime RHR, and poor HRV. Total sleep time might be long, but the data will show it was poor quality.
Heavy, Late Meals: Digestion requires energy and raises core temperature.
Data Impact: Can lead to discomfort, less deep sleep, and a disrupted temperature curve. You may also see more movement.
3. The Stress Tsunami: How Anxiety and Rumination Hijack Sleep
Unmanaged mental stress is perhaps the most potent saboteur of sleep quality. It keeps your sympathetic nervous system engaged, flooding your body with cortisol when it should be bathing in melatonin.
Frequent nighttime awakenings with racing thoughts (spikes of "Awake" on the graph).
Reduced Deep Sleep and elevated overall Nighttime RHR.
Poor HRV throughout the night.
The Smart Ring as a Stress Barometer: Many devices now offer direct stress detection through HRV and other metrics. Use this as a signal. If your device shows high afternoon or evening stress, that’s your cue to intervene before bedtime with a wind-down ritual.
The "Day-Before" Experiment: For one week, log your evening activities (e.g., "intense workout at 8 PM," "two glasses of wine with dinner," "30-minute meditation"). Then, correlate these logs with your morning data. You will see the cause-and-effect in stark detail. This empowers you to make informed trade-offs. Maybe that late cocktail is worth it for a social occasion, but now you’ll understand the exact recovery cost, helping you decide if it’s worth it on a Tuesday night before a big work day.
Now, let's address one of the most common points of confusion and frustration: when the numbers seem to contradict how you feel.
When the Data Doesn't Match Your Feelings: Resolving the Subjective-Objective Divide
You wake up feeling refreshed, energized, and clear-headed. You check your smart ring data, expecting a triumphant Sleep Score of 90+. Instead, you see a mediocre 78, with low deep sleep and elevated RHR. Frustration. Conversely, you feel groggy and sluggish, but your report shows a solid 8 hours with good stage balance. Confusion.
This disconnect between subjective sleep quality (how you feel) and objective sleep metrics (the numbers) is common, especially when you first start tracking. It doesn’t mean the data is wrong or your feelings are invalid. It means you need a translator.
Reasons for the Disconnect & How to Interpret It:
Sleep Cycle Timing (Sleep Inertia): This is the most common culprit. If your alarm yanks you out of Deep Sleep or the middle of a REM period, you will experience intense sleep inertia—grogginess that can last over an hour. Your sleep was objectively good up until that violent interruption, but your feeling is terrible. The data can show you this! Look at your final sleep stage before waking. Waking from Light Sleep leads to the best subjective feeling.
The "Last Night" Fallacy: How you feel this morning is not solely a product of last night’s sleep. It’s a cumulative result of your sleep debt and recovery over the past several nights, your current stress, hydration, nutrition, and more. You might feel great today because you finally caught up on a week of mild deprivation, even though last night’s sleep was just average.
Data vs. Perception of Depth: The tracker measures physiological states, not the subjective "depth" of your sleep. You can have a night with less deep sleep but feel it was more "solid" because it was continuous, without remembered awakenings. The Sleep Continuity metric (low fragmentation) is often more aligned with feeling rested than the raw deep sleep percentage.
Psychological Factors: Your mood, expectations, and mindset upon waking color your perception. If you anticipate being tired, you’re more likely to feel tired. The data provides an objective counterpoint.
Algorithm Learning Curve: In the first few weeks, the device is still learning your personal baselines. Its "score" may be based on general population algorithms that don’t yet reflect your unique physiology. Over time, as it adapts to your individual baselines, its assessments should become more aligned with your feelings.
What to Do When Data and Feelings Clash:
First, Trust the Physiological Truth for Trends: The data on RHR, HRV, and temperature are direct physiological measurements. If they show a pattern of strain (high RHR, low HRV), your body is under stress, even if your mind feels okay. This is a crucial early warning system.
Use the "Why" Button: Don't just look at the score. Investigate. If you feel great but the score is low, was your deep sleep low but your REM high? Was there a lot of awake time you don’t remember? Often, digging reveals the reason.
Log Your Subjective Morning Feeling: Most good apps allow you to log how you feel (e.g., "Rested," "Fatigued," "Average"). Do this consistently. Over time, you’ll see patterns. You might discover that you feel best not when your deep sleep is maximized, but when your REM sleep is above a certain threshold, or when your sleep efficiency is over 90%. This builds your personal model of good sleep.
Look at the Weekly Average: A single night is a snapshot. Your weekly average sleep score and HRV are a much better indicator of your overall recovery status than any one morning’s report.
This process of reconciling data with feeling is where true self-knowledge is forged. The ring’s data isn’t meant to overrule your intuition, but to inform it and sometimes challenge it with hard evidence. This synergy is what allows the technology to validate your subjective health feelings or, importantly, warn you when your subjective feeling is misleading you about an underlying biological strain.
With a handle on interpreting discrepancies, we can now explore the forward-looking power of this data: using it not just to describe last night, but to predict and plan for tomorrow.
Predictive Power: Using Tonight's Data to Plan Tomorrow's Day (The Readiness Concept)
This is the frontier of personal health technology: moving from descriptive analytics ("This is what happened") to prescriptive and predictive insights ("This is what you should do"). The most advanced wellness platforms synthesize your sleep data with other metrics to produce a Readiness Score or Recovery Index. This isn't just a sleep score; it's a directive for how to approach your coming day.
What is a Readiness Score?
A Readiness Score is a composite index, typically on a scale of 1-100, that answers the question: "How prepared is my body to handle physical, mental, and emotional stress today?" It is the algorithm's recommendation for whether you should push hard, take it easy, or focus on recovery.
What Goes Into It (The Sleep Data's Role):
While different brands use different formulas, sleep is almost always the most heavily weighted component because it’s the purest measure of recovery. Key inputs include:
Sleep Duration & Quality: Did you get enough high-quality, continuous sleep? A short, fragmented night will lower readiness.
Sleep Stage Balance: Specifically, sufficient Deep Sleep is critical for physical repair, so low deep sleep will negatively impact a score geared toward physical readiness.
Heart Rate Variability (HRV): This is the flagship metric for autonomic nervous system balance and recovery status. A high HRV (relative to your baseline) suggests strong resilience and boosts your score. A low HRV is a major red flag that lowers it.
Resting Heart Rate (RHR): An elevated RHR (relative to your baseline) indicates your body is working harder, often due to residual stress, incomplete recovery, or illness onset.
Body Temperature: A consistently elevated temperature trend can indicate inflammation or strain.
Sleep Consistency: Did you go to bed and wake at your usual time, or did you disrupt your rhythm?
How to Use Your Readiness Score & Sleep Data Proactively:
This is where you transition from a passive observer to an active participant in your health.
High Readiness Score (e.g., 80+): Your body is signaling "Green light."
Action: Plan your hardest workouts, important meetings, or creative work. Your sleep data shows you recovered well; capitalize on that energy and cognitive sharpness.
Moderate Readiness Score (e.g., 60-79): Your body is signaling "Proceed with caution" or "Yellow light."
Action: Stick to your plan, but listen to your body. Maybe do a moderate instead of intense workout. The data suggests you’re not at your peak resilience. Use your sleep details to see why—was it short duration? Low HRV? Let that guide your day (e.g., if HRV is low, prioritize stress management).
Low Readiness Score (e.g., Below 60): Your body is signaling "Red light" or "Recovery Priority."
Action: This is a directive to scale back. Swap an intense workout for gentle movement, stretching, or a walk. Prioritize sleep, nutrition, and stress reduction. The data is giving you permission—even an instruction—to rest without guilt. This can help prevent overtraining, burnout, and illness.
The Life-Changing Application: Imagine it’s Tuesday morning. You have a hard interval run scheduled, but your readiness score is 52. Your sleep data shows your HRV dropped 30% and your RHR spiked due to a poor night's sleep after a stressful workday. Instead of forcing the run and risking injury or prolonging recovery, you take a rest day. You come back Wednesday with a readiness score of 85 and absolutely crush your workout. The data helped you train smarter, not just harder.
This predictive capacity is the culmination of all the metrics we’ve discussed. It’s the algorithm doing the heavy lifting of synthesis so you can focus on action. To understand the intricate math and science behind these powerful scores, you can explore our detailed article on how health-tracking technology powers readiness scores.
Now, let's address the elephant in the room for any data-driven endeavor: when tracking itself becomes a source of stress.
Avoiding Sleep Tracking Anxiety: How to Use Data Wisely Without Obsession
This is a critical chapter. The very tool designed to improve your sleep can, paradoxically, become a source of anxiety that harms it—a phenomenon sometimes called orthosomnia (an unhealthy preoccupation with achieving perfect sleep data). You lie in bed, worrying about your deep sleep percentage, watching the clock, and stressing over your falling HRV. This performance anxiety triggers the exact stress response that ruins sleep.
If you find yourself feeling anxious, competitive, or defeated by your numbers, it’s time for a mindset reset.
The Principles of Healthy Sleep Tracking:
Embrace Trends, Not Nights: A single night of poor data is meaningless noise. It could be a random fluctuation, a big meal, a weird dream. Never judge your health on one data point. Only look for meaningful changes over weeks and months. Zoom out on your app’s trend graphs.
You Are Not a Number: Your worth is not your sleep score. The data is a servant, not a master. Its purpose is to provide insights and motivation, not to be a report card you must ace.
The Feeling is the Goal: The ultimate metric is how you feel and function during the day. Use the data to explain your feelings, not replace them. If you feel great, celebrate that, regardless of the score. If you feel terrible, use the data to investigate why.
Look for "Good Enough," Not Perfection: There is no such thing as a perfect night of sleep. Aiming for the "ideal" percentages every night is a recipe for frustration. Healthy sleep has natural variability.
Practical Steps to Prevent Anxiety:
Set a Data Review Window: Don’t check your sleep data the second you wake up. Give yourself at least 60-90 minutes to greet the day, have some water, and assess how you feel subjectively. Then, look at the data with a curious, analytical mind, not an anxious one.
Take Regular Breaks: If you find yourself getting obsessive, take the ring off for a night or a weekend. Reconnect with simply sleeping without being monitored. This can be incredibly liberating and reset your relationship with the tool.
Focus on One Metric at a Time: Trying to optimize deep sleep, REM, HRV, RHR, and temperature all at once is overwhelming. For a month, focus only on Sleep Consistency. Once that’s habitual, focus on creating a dark environment. Master one lever before pulling the next.
Remember the Limits: Consumer wearables are incredible inference engines, but they are not medical-grade polysomnograms. There is a margin of error in sleep stage classification. The exact percentage is less important than the direction of the trend.
The Healthiest Mindset: View your smart ring as a guide and an experiment. You are the scientist of your own life. The ring provides the data from the experiment of living. "If I do X (consistent bedtime, no alcohol, afternoon workout), what happens to Y (my deep sleep, my HRV)?" This frame turns anxiety into curiosity.
By now, you are no longer a beginner. You have moved from confusion to comprehension, from data to insight, and from insight to action. You are equipped to navigate your sleep numbers with wisdom. In our final section for this portion, we will look ahead at how to integrate all this knowledge into a sustainable, lifelong practice of sleeping smarter.