The Complete Beginner-Friendly Guide to Using Ring Data for Health Decisions
A beginner's guide to using the numbers from your ring to make informed daily health decisions.
The Complete Beginner-Friendly Guide to Using Ring Data for Health Decisions
You stare at your smartphone screen, blinking at the numbers. Your smart ring has dutifully tracked another night: 7 hours 23 minutes of sleep, a resting heart rate of 58 BPM, a sleep score of 78. The data is there. It’s precise, it’s personal, and it’s promising. But then comes the inevitable question that hangs in the air, separating raw information from real insight: “Okay… but what do I actually do with this?”
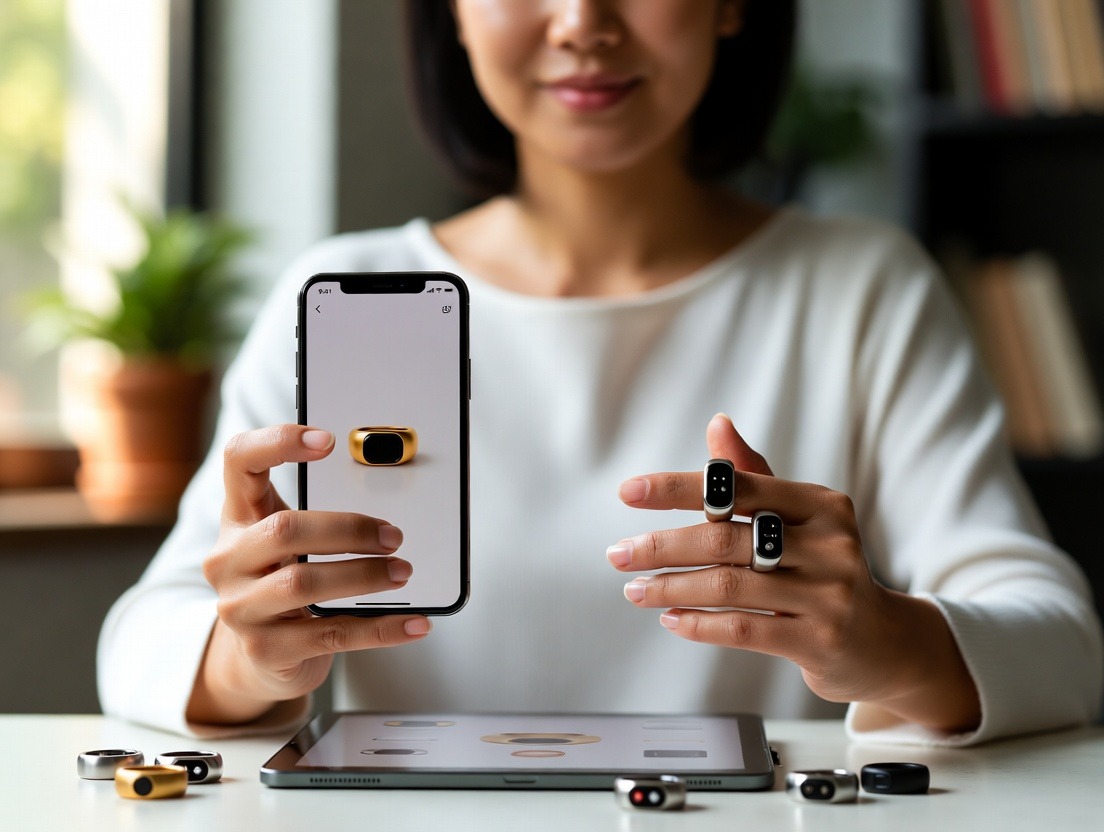
If this moment of data-rich confusion feels familiar, you are not alone. We live in the golden age of biometrics, where devices like the Oura Ring, Ultrahuman Ring, and others have miniaturized a health lab into a piece of jewelry. They capture the subtle rhythms of our bodies—heartbeats, temperature shifts, oxygen levels, and movement—with astonishing detail. Yet, for many, this wealth of information becomes a digital trophy case of metrics, admired but not fully understood or acted upon.
This guide is your bridge. It’s designed to transform you from a passive collector of health data into an active, confident interpreter of your body’s language. We’re moving beyond simply knowing your sleep score to understanding why it fluctuates, and beyond tracking your resting heart rate to leveraging it for better recovery, sharper mental clarity, and more effective workouts. This isn't about biohacking or extreme optimization; it's about practical, beginner-friendly empowerment. It's about learning to use the stream of data from your finger to make daily decisions that genuinely enhance your well-being.
Think of your smart ring not as a judge, but as a guide. It’s giving you a continuous, objective report on how your body is responding to your life—your stress, your nutrition, your exercise, your sleep. By learning its language, you can start a two-way conversation. You can ask, “What happens to my readiness score when I have that second glass of wine?” or “Does my 30-minute meditation actually lower my nighttime heart rate?” and get a clear, data-driven answer.
In the sections that follow, we will systematically demystify every major metric, explore their profound interconnections, and build a framework for turning numbers into actionable health intelligence. You’ll learn how to spot meaningful trends, ignore insignificant noise, and create personalized feedback loops that make your health journey intuitive and effective. Let’s begin the transformation from data overload to decisive action.
What Your Smart Ring Actually Measures (And Why It Matters)
Before we can interpret the data, we need a solid grasp of what our devices are capturing. A modern smart ring is a marvel of sensor fusion, packing sophisticated technology into a sleek, wearable form. Unlike a smartwatch that primarily looks outward (notifications, GPS), a ring’s position on the finger—rich in capillaries and with consistent bone structure—makes it uniquely suited to look inward, at your autonomic nervous system. Here’s a breakdown of the core measurements and the science behind them.
The Foundational Metrics: Heart Rate & HRV
At the core of most ring data are photoplethysmography (PPG) sensors. These tiny LEDs shine light into the skin of your finger and measure how much light is absorbed by your blood vessels. As your heart beats, blood volume in the capillaries pulses, creating a waveform that the ring reads hundreds of times per minute.
Resting Heart Rate (RHR): This is your heart’s beats per minute (BPM) when you are truly at rest, typically during deep sleep. A lower RHR generally indicates better cardiovascular fitness and more efficient heart function. Your ring tracks this continuously to establish your unique baseline. A sustained elevation of 5-10 BPM above your baseline can be one of the earliest and most reliable signs of impending illness, overtraining, or chronic stress.
Heart Rate Variability (HRV): This is the star metric for recovery and nervous system balance. Contrary to what the name implies, HRV is a good thing. It measures the subtle, millisecond variations in the time intervals between your heartbeats. A higher HRV indicates a resilient, adaptable autonomic nervous system—your body can easily switch between the energetic “fight-or-flight” (sympathetic) mode and the restorative “rest-and-digest” (parasympathetic) mode. A lower or dropping HRV suggests your body is under strain and prioritizing stress response over recovery. It’s a profound window into your body’s readiness to perform and adapt.
The Thermal Layer: Body Temperature
Most advanced rings include a precision thermistor. It doesn’t measure your core temperature like a medical thermometer, but tracks your distal (extremity) body temperature—the temperature at your finger. This is a powerful dynamic metric.
Baseline Temperature: Your ring learns your personal 24-hour temperature rhythm, which typically dips at night and rises in the morning.
Temperature Deviation: A significant deviation from your personal baseline, especially a sustained elevation at night, is a highly sensitive biomarker. It can signal the onset of infection (like a cold or flu), inflammation, hormonal shifts (like ovulation in women), or a physiological stress response from intense training or poor recovery. It’s your body’s internal “check engine” light.
The Movement Puzzle: Sleep & Activity
An accelerometer detects motion. This simple-sounding data is ingeniously used to paint a complex picture.
Sleep Stages: By analyzing periods of motion and immobility alongside heart rate and HRV patterns, algorithms estimate your time in light, deep, and REM (dream) sleep. Each stage serves a critical purpose: physical repair in deep sleep, memory consolidation in REM, and a bridge between them in light sleep.
Activity & Inactivity: Beyond formal workouts, rings track general movement and sedentary periods. Some calculate an activity score, nudging you to balance movement throughout the day, which is crucial for metabolic health and circulation.
The New Frontier: Blood Oxygen & Respiratory Rate
Cutting-edge rings now add pulse oximetry (SpO2) to measure the oxygen saturation of your blood, and some can derive your breathing rate.
Nighttime Blood Oxygen: Consistently low SpO2 levels during sleep can be an indicator of sleep-disordered breathing, like sleep apnea, which fragments sleep and stresses the cardiovascular system.
Respiratory Rate: The number of breaths you take per minute, particularly during sleep, is a stable vital sign. A marked increase can be a subtle sign of stress, respiratory issues, or metabolic disturbance.
Why This Holistic View is Revolutionary
The magic isn't in any single metric, but in their synergy. A high resting heart rate, a low HRV, and an elevated temperature all tell a similar story of strain, but together they provide a confident, multi-layered diagnosis of your body’s state. This is the foundation of the “Readiness” or “Recovery” scores offered by platforms like Oura—they synthesize these inputs into a single, actionable recommendation: push hard today, or prioritize rest.
Understanding this “what” and “why” is the first step. Next, we’ll build your personal data baseline—the crucial reference point that makes all future data meaningful.
Establishing Your Personal Baseline: The Key to Meaningful Data
Imagine a weather reporter announcing, “It’s 72 degrees outside today!” Without context, that number is neutral. Is 72°F warm or cool? It depends entirely on the season and your location. If your baseline summer temperature is 95°F, 72°F is chilly. If your baseline winter temperature is 30°F, 72°F is a heatwave.
Your health data works the same way. A resting heart rate of 65 BPM might be excellent for one person and a warning sign for another. The single most important concept for using ring data effectively is establishing your personal baseline. This is your body’s unique “normal” under your typical life conditions—the north star by which all deviations are measured.
How Your Ring Builds Your Baseline
Your smart ring isn’t comparing you to a population average from day one. Its algorithms are designed to learn you. Typically, this process takes 2-4 weeks of consistent wear, especially during sleep (when conditions are most stable).
During this “learning period,” the ring is quietly answering key questions:
What is your typical deep sleep duration?
What is your normal overnight heart rate minimum?
What is your average HRV during slow-wave sleep?
What does your 24-hour temperature rhythm look like?
It’s building a multi-dimensional profile of your physiology at rest. Do not panic or over-analyze daily scores during this phase. Your job is simply to wear the ring consistently and live your regular life.
The Pillars of a Stable Baseline
To get an accurate baseline, consistency in a few key areas is helpful:
Consistent Wear: For accurate baselines, especially for sleep and recovery metrics, you must wear the ring every night. Daytime wear enhances activity and heart rate tracking.
Typical Lifestyle: Try to avoid major lifestyle upheavals during this period (e.g., starting an extreme new diet, running your first marathon, pulling consecutive all-nighters). The goal is to capture “you” at your regular equilibrium.
Mind the Factors: Be aware that your baseline is not a fixed number but a range influenced by immutable factors:
Age: HRV naturally declines with age. Your baseline will reflect this.
Biological Sex: Hormonal cycles in women create beautiful, predictable patterns in temperature, resting heart rate, and HRV, which the ring will learn.
Genetics & Fitness: Your innate physiology and fitness level set the absolute range for your metrics. The goal is to optimize within your range, not someone else’s.
Recognizing Your Established Baseline
Once the learning period is over, you’ll notice:
Your scores (like Readiness/Sleep) will feel more stable and reflective of how you feel.
The app will show you clear ranges and trends for each metric instead of just daily numbers.
You’ll see your own patterns, like a slight dip in HRV after your weekly intense workout, or a temperature rise mid-cycle.
What Your Baseline is NOT
It’s critical to remember: your personal baseline is not a universal health target. It is a diagnostic reference point. If your baseline HRV is low because of chronic stress or poor fitness, the goal isn’t to accept it, but to use that baseline to measure the impact of positive changes. As you implement the strategies in this guide, you’ll work to shift your baseline upward over time—toward a lower resting heart rate, a higher HRV, and more stable, restorative sleep.
This foundation allows you to move from asking “Is this number good?” to asking the transformative question: “How is this number changing relative to my normal, and what in my life is causing that change?” That is the essence of data-driven health.
Decoding Your Nightly Readout: Sleep, HRV, and Recovery Scores
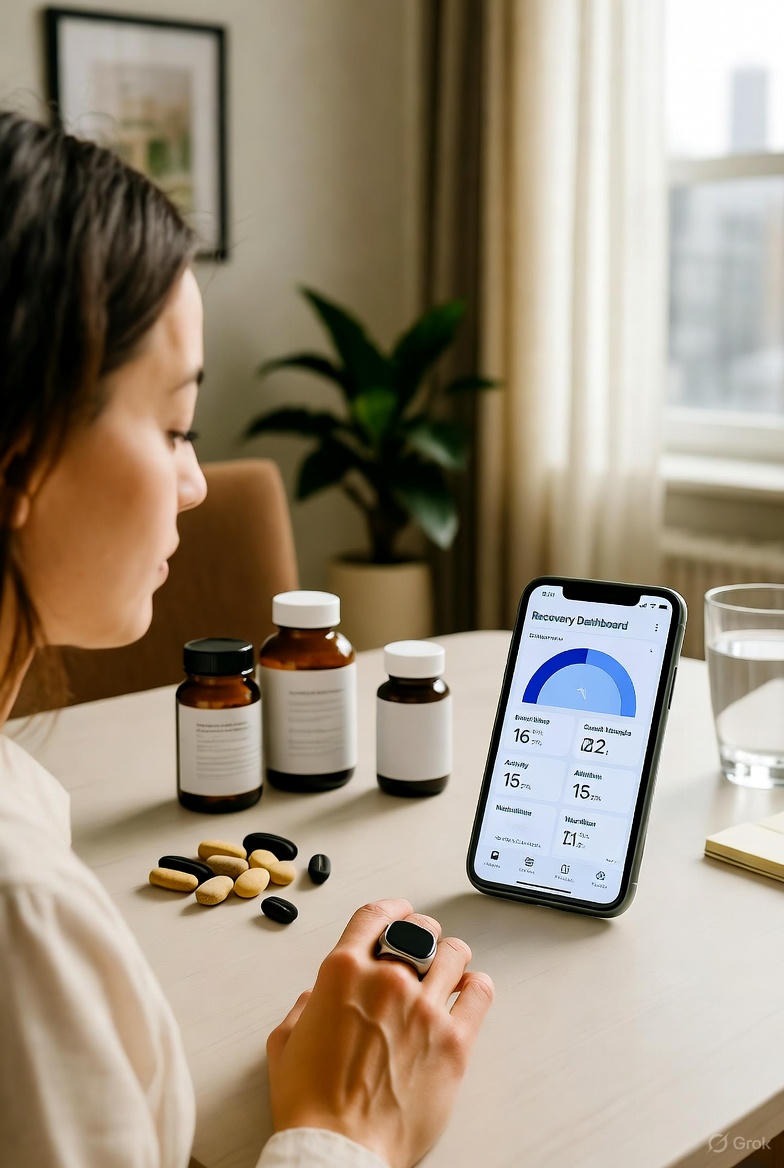
The morning check-in with your ring app is the most common ritual for users. You open it, hoping for a green score that validates your life choices. But to move beyond a simple thumbs-up/thumbs-down, you need to understand the components of this nightly report. Let’s decode the three pillars of your morning dashboard: Sleep Data, HRV, and the composite Recovery/Readiness Score.
Deep Dive into Sleep Architecture
Your ring breaks your night into stages, but what do they mean for your day?
Deep Sleep (Slow-Wave Sleep): This is your physical restoration phase. Growth hormone is released, tissues are repaired, and the immune system is bolstered. Consistently low deep sleep can leave you feeling physically drained and more susceptible to aches, pains, and illness. If your deep sleep is low, consider factors like late-evening intense exercise, alcohol consumption (which severely fragments deep sleep in the second half of the night), or an uncomfortably warm sleep environment. For those struggling with sleep quality, exploring resources on creating an optimal environment can be transformative, such as the nighttime wellness routine that changed my sleep forever.
REM Sleep (Rapid Eye Movement): This is your mental and emotional processing stage. It’s crucial for memory consolidation, learning, and mood regulation. Low REM can manifest as brain fog, difficulty remembering new information, and emotional irritability. REM sleep is often suppressed by substances like alcohol and cannabis, and can be reduced by sleeping outside your body’s natural circadian window.
Light Sleep: This is the transitionary stage that makes up the bulk of your night. It’s less intensively restorative but essential for overall sleep architecture. Fragmentation—waking up frequently or having restless light sleep—diminishes its quality. This is often linked to environmental disturbances (noise, light, a partner’s movements) or sleep disorders like apnea.
Look Beyond the Total: A 7-hour night with 90 minutes of deep sleep is profoundly different from a 7-hour night with only 30 minutes of deep sleep. Focus on the balance and continuity of your sleep stages, not just the total time in bed.
Interpreting Heart Rate Variability (HRV) in Context
HRV is your most sensitive daily metric, but also the most misunderstood. Here’s how to read it:
The Trend is Your Friend: Never fixate on a single day’s HRV number. Always look at the 7 to 30-day trend line. An upward trend is a golden signal of improving fitness, recovery, and stress resilience. A downward trend is a clear alert that your body is accumulating strain.
Absolute vs. Relative: Your 45 ms HRV might be someone else’s 80 ms. What matters is your range. Is today’s HRV in the upper, middle, or lower part of your personal range? A score in your “personal best” zone suggests high readiness. A score nearing your “personal lowest” suggests you need more recovery.
The Nightly Dip: HRV naturally fluctuates. It typically peaks during deep sleep when parasympathetic (rest-and-digest) activity dominates. A low nighttime average is more concerning than a low spot reading during a stressful afternoon.
Understanding Your Recovery or Readiness Score
This composite score (called Readiness by Oura, Recovery by others) is the ring’s attempt to answer the ultimate question: “How hard can I push today?” It’s a weighted algorithm that primarily considers:
Sleep Quality & Balance: Did you get enough restorative sleep?
Previous Night’s HRV & RHR: How well did your nervous system recover?
Temperature Deviation: Is there a sign of illness or inflammation?
Recent Activity Load: Are you still recovering from past exertions?
How to Use These Scores Intelligently:
High Score (e.g., 85+): Your body is primed. This is the day for that intense workout, important creative work, or demanding social engagement. Your system can handle the stress and adapt positively to it.
Moderate Score (e.g., 70-84): Proceed with a normal day. You’re in balance. Stick to your planned routine, but perhaps don’t add an extra, unplanned high-stress element.
Low Score (e.g., <70): This is a directive, not a punishment. Your body is asking for support. Prioritize rest, gentle movement like walking or yoga, stress-management techniques, hydration, and nourishing food. Pushing through a low score often leads to subpar performance, heightened injury risk, and prolongs the recovery period.
This nightly readout provides the “state of the union.” In the next section, we’ll connect this state directly to the choices you make during the day.
Connecting the Dots: Daily Habits and Their Data Signatures
Your morning ring data is a report card on yesterday’s choices. The powerful feedback loop begins when you learn to recognize the specific “data signatures” of your daily habits. This turns abstract health advice into personalized, verifiable truth. Let’s explore how common behaviors leave clear fingerprints on your biometrics.
Nutrition’s Delayed Echo
What you eat and drink doesn’t just affect your weight; it directly impacts your autonomic nervous system and sleep architecture.
Alcohol: This is one of the most dramatic influencers. Even one or two drinks can cause:
Elevated Resting Heart Rate & Reduced HRV: Alcohol is a toxin; your body works hard to process it, raising metabolic stress.
Suppressed REM Sleep: You may fall asleep faster, but alcohol fragments the second half of your sleep, robbing you of crucial dream sleep. This often leads to a higher sleep duration but a lower sleep quality score.
Elevated Temperature: The metabolic processing of alcohol can raise your distal body temperature.
Late, Heavy Meals: Digestion is work. A large meal within 2-3 hours of bedtime can keep your RHR elevated and reduce HRV as your body prioritizes digestion over deep restoration.
Hydration: Mild dehydration thickens the blood, making your heart work harder, which can subtly elevate your RHR. Good hydration supports optimal blood volume and circulation, aiding recovery.
Exercise: The Double-Edged Sword
Exercise is a controlled stressor. The right dose builds fitness; too much breaks you down. Your ring is the perfect tool to find your dose.
Positive Adaptation Signature: After a well-timed, appropriate-intensity workout, you might see:
A temporary dip in HRV and elevation in RHR the same night (acute stress response).
Followed by a rebound to baseline or higher over the next 1-2 nights (supercompensation and adaptation).
Over weeks, a gradual upward trend in your baseline HRV and downward trend in RHR.
Overtraining/Under-Recovering Signature:
A sustained drop in HRV below your baseline for multiple days.
A sustained elevation in RHR.
A persistent high temperature deviation.
Consistently poor sleep scores despite fatigue.
This pattern screams for a deload week, more rest, and better recovery practices.
Stress & Mindfulness: The Direct Line to Your Nervous System
Mental and emotional stress trigger the same physiological fight-or-flight response as physical threats.
Chronic Stress Signature: Mimics overtraining: lowered HRV, elevated RHR, fragmented sleep (especially difficulty staying asleep), and sometimes a higher temperature.
Recovery Practice Signature: Activities that stimulate the parasympathetic system have a measurable effect:
Meditation & Breathwork: A 10-20 minute session, especially before bed, can lead to a noticeable, immediate increase in nighttime HRV and a lower sleeping RHR. It’s like a direct dial to your “rest-and-digest” mode. For those with hectic schedules, even a short, focused routine can be salvaged, as discussed in how to salvage a nighttime routine when you're running late.
Nature Walks & True Relaxation: Periods of unplugged, low-stimulus relaxation can show similar positive shifts in your evening and nighttime data.
Caffeine & Timing: A late afternoon coffee might not stop you from falling asleep, but it can quietly reduce your percentage of deep sleep, leading to a less restorative night. Experiment by moving your caffeine cut-off earlier and watch your deep sleep graph.
The Power of the N=1 Experiment
This is where you become a scientist of your own life. Use your ring to run simple, clean experiments:
Hypothesis: “If I stop eating 3 hours before bed, my deep sleep will increase.”
Experiment: Do it consistently for 5-7 days.
Data: Observe the trends in your sleep stage breakdown and overnight RHR.
Conclusion: Did it work for you?
By learning these signatures, you move from guessing to knowing. You gain the power to choose: “Is this late-night social drink worth the predictable dip in my recovery tomorrow?” Sometimes the answer is yes, and that’s a conscious, informed choice. Often, the data provides the motivation to choose the more supportive habit.
Beyond Sleep: Using Daytime Data for Energy and Focus
While the nighttime data is the cornerstone of recovery, your ring’s daytime data is a live dashboard for managing your energy, focus, and stress throughout your waking hours. This turns the device from a sleep tracker into a 24/7 wellness companion. Let’s explore how to leverage daytime metrics for better daily decisions.
Activity Scores and Moving from “Exercise” to “Movement”
Many rings provide an activity score or active calorie burn goal. The philosophy here is shifting from a single daily “workout” to a holistic view of movement.
The Sedentary Penalty: Prolonged sitting creates metabolic and postural stagnation. Rings often reward you for breaking up long sedentary bouts with short walks or stretches. This isn’t just about calories; it’s about maintaining circulation, stabilizing blood sugar, and reducing musculoskeletal stiffness.
Activity Balance: The goal is to meet your personalized movement target, which often includes components of:
Daily Steps: A foundational metric for general health.
Moderate Activity: Brisk walking, casual cycling.
Intense Activity: Dedicated workouts that significantly raise your heart rate.
Using It: If your morning recovery score is low, the ring might auto-adjust your activity goal downward. Honor that. Use the “stay active” reminders as gentle nudges to take a 5-minute walk between meetings, which can clear your mind as much as it helps your body.
Daytime Heart Rate as a Stress Barometer
Your live or logged daytime heart rate is a real-time stress indicator.
Sitting Heart Rate: Check your heart rate during a calm, seated work period. Is it 15-20 BPM higher than your sleeping RHR? That’s normal. Is it 30+ BPM higher? That could indicate latent anxiety, caffeine effects, or lingering fatigue.
Reactivity and Recovery: Notice how high your heart rate spikes during a stressful work call or a difficult task, and—more importantly—how quickly it drops once the stressor passes. Fast recovery (a quick drop back to baseline) is a sign of good stress resilience. A slow recovery suggests your nervous system is “stuck on high.”
The Mind-Body Link: Use this as a biofeedback tool. Feeling frazzled? Pause, take three slow, deep diaphragmatic breaths, and watch the real-time heart rate number on your app. Often, you can see it drop several BPM within 30 seconds, providing instant positive feedback and a tangible calming effect.
The Power of the Daytime Nap (and How to Nail It)
If your ring supports it, a short, timed daytime nap can be a powerful performance enhancer without ruining nighttime sleep.
The Ideal Nap: 10-20 minutes of non-REM sleep. This can boost alertness and cognitive performance without incurring sleep inertia (that groggy feeling).
The Data Signature: A successful short nap may show a period of lowered heart rate and increased HRV. The ring can often detect this as a “moment of rest” and factor it positively into your daily recovery picture.
The Warning: Naps longer than 30 minutes risk dipping into deep sleep, making it harder to wake up and potentially disrupting that night’s sleep drive. Your data will show if your naps are helping or hindering your overall sleep rhythm.
Using Data for Work-Life Balance
Set informal experiments:
Meeting Impact: Compare your heart rate graphs on days packed with back-to-back calls versus days with more focused, solo work. Which pattern leaves you more physiologically stressed by 5 PM?
The Lunch Break Effect: Do you feel a 3 PM energy crash? Check your data. Did your heart rate and activity flatline after lunch? A post-lunch 10-minute walk can mitigate this crash, and your ring’s activity encouragement can help build that habit.
By paying attention to these daytime signals, you learn to pace yourself. You can take a restorative break before you are completely drained, use movement to reset your focus, and make choices that keep your energy stable from morning to evening. This proactive management prevents the deep exhaustion that ruins sleep, creating a virtuous cycle. Speaking of cycles, for those whose work disrupts natural rhythms, specialized approaches are needed, like those in the nighttime routine for shift workers: sleep when you can.
Navigating the Monthly Cycle: A Guide for Women
For women who menstruate, ring data unlocks a profound new layer of self-understanding. The hormonal fluctuations of the menstrual cycle are not a bug in the system; they are a central feature of female physiology. Your smart ring, by tracking core temperature, heart rate, and HRV, can help you chart this inner landscape, turning a source of potential confusion into a powerful planning tool. This is about syncing your life with your cycle, not fighting against it.
The Biometric Symphony of the Cycle
Hormones like estrogen and progesterone don’t just regulate reproduction; they directly influence your autonomic nervous system, metabolism, and sleep.
Follicular Phase (Post-Period to Ovulation): As estrogen rises, many women experience:
Lower Resting Heart Rate: Estrogen can have a vasodilatory effect.
Higher HRV: Indicating better stress resilience and recovery capacity.
More Stable, Lower Basal Body Temperature.
Better Sleep Quality: Often with more deep sleep.
This phase is often associated with higher energy, better stamina, and a greater tolerance for intense exercise and cognitive work.
Luteal Phase (Post-Ovulation to Menstruation): After ovulation, progesterone rises.
Elevated Resting Heart Rate: Progesterone is thermogenic (heat-producing) and increases metabolic rate. An RHR increase of 3-8 BPM is common and normal.
Lower HRV: The body is under a higher metabolic load.
Higher Basal Body Temperature: A sustained temperature rise of about 0.3-0.5°C (0.5-1.0°F) is the primary biomarker of ovulation and defines the luteal phase.
Potentially Disrupted Sleep: Progesterone can cause lighter sleep and more awakenings. Core body temperature needs to drop to initiate sleep, which is harder when it’s already elevated.
This phase often calls for more grace: a higher need for recovery, a potential preference for strength or stability work over intense cardio, and more focus on stress management.
How Your Ring Detects and Displays This
Advanced platforms like Oura have dedicated “Cycle Insights.” They use your temperature curve as the primary signal.
Ovulation Confirmation: A clear, sustained shift in your temperature baseline pinpoints ovulation after it occurs.
Phase Prediction: Over several cycles, the app learns your typical pattern and can predict upcoming fertile windows and period start dates with increasing accuracy.
Context for Other Metrics: The app will often annotate your daily scores, reminding you that a higher RHR or lower HRV is normal for your current luteal phase. This prevents unnecessary anxiety about a “bad” score.
Using Cycle Data for Empowered Decisions
This isn’t just about tracking; it’s about adapting.
Training & Nutrition:
Follicular: Ideal for setting new personal records, high-intensity interval training (HIIT), and learning new skills. Your body is primed to build muscle and perform.
Luteal: Focus on maintenance, endurance-based work, yoga, and mobility. Increase intake of magnesium and iron-rich foods, which may be more beneficial during this phase.
Work & Projects:
Follicular: Schedule important presentations, creative brainstorming sessions, and demanding social periods.
Luteal: Excellent for detailed, focused analytical work, editing, and administrative tasks. Honor a potentially greater need for quiet and introspection.
Recovery & Self-Care: Be extra diligent about sleep hygiene in the luteal phase. Since sleep may be more fragile, prioritizing a wind-down routine is key. Techniques to help your body understand it’s time to wind down are invaluable, as explained in how nighttime routines signal your body it's time to sleep.
Beyond the Typical Cycle: Perimenopause and Menopause
Ring data is equally valuable during the menopausal transition. Tracking temperature and heart rate can help identify the often-erratic patterns of perimenopause (like unusually high temperature spikes) and provide objective confirmation of symptoms like night sweats (seen as sharp temperature spikes and awakenings). It offers a way to measure the impact of lifestyle interventions or hormone therapy on sleep quality and overall recovery.
For women, this functionality transforms the ring from a fitness device into a essential health tool, providing validation, prediction, and a data-backed roadmap for living in harmony with one of their body’s most fundamental rhythms.
Spotting Red Flags and Green Lights: When to Act and When to Relax
With a constant stream of data, it’s easy to become hyper-vigilant, worrying over every small dip or spike. A key skill in data-driven health is discernment—learning to distinguish meaningful signals from normal biological noise. This section will help you identify true “red flags” that warrant attention and “green lights” that confirm you’re on the right track, while cultivating a healthy, non-anxious relationship with your metrics.
Red Flags: Consistent, Multi-Metric Deviations
A single bad night or a slightly lower HRV one day is noise. A pattern across multiple metrics is a signal.
The Illness Signature (The Most Important Red Flag):
Sustained Elevated Temperature: A temperature deviation of +1.0°F or more above your baseline for two or more nights, especially if trending upward.
Elevated Resting Heart Rate: An RHR 5-10 BPM above your normal range for the same period.
Low HRV: Drops to the bottom of your personal range.
Disrupted Sleep: Often increased restlessness or awakenings.
Action: This combination is your body’s early warning system, often appearing 1-3 days before you feel overt symptoms. Heed it. Prioritize extra sleep, hydration, nutrient-dense foods, and cancel non-essential stressors. You may be able to mitigate the severity or duration of the illness.
Increased Sleep Latency (time to fall asleep) or frequent awakenings.
Action: This requires a lifestyle audit. Do you need a true deload week from training? Are work or emotional stressors unsustainable? It’s a signal to increase recovery activities (gentle movement, meditation, time in nature) and decrease output.
The Sleep Disruption Concern:
Consistently Low Blood Oxygen (SpO2) readings with many dips below 90%. This warrants a discussion with a doctor about potential sleep apnea.
Extreme sleep fragmentation every night, not linked to lifestyle factors (e.g., a new baby, travel). This could indicate an underlying sleep disorder.
Green Lights: Signs You Are Thriving
Celebrate and reinforce these positive patterns:
An Upward HRV Trend: Over weeks and months, this is the single best biomarker of improving health and resilience.
A Downward RHR Trend: Similarly, a gradual lowering of your resting heart rate baseline indicates improving cardiovascular efficiency.
High Sleep Consistency: Going to bed and waking up at similar times, resulting in stable, high sleep scores.
Positive Habit Feedback: You try a new wellness habit (e.g., 10-minute meditation before bed, no phones after 9 PM) and see a corresponding positive shift in your sleep graph or HRV. This is concrete reinforcement!
Quick Recovery: You have a physically or mentally demanding day, see the expected acute dip in metrics that night, but bounce back to baseline within 1-2 nights. This shows excellent adaptive capacity.
When to Ignore the Data (The Art of Relaxation)
Your ring is a tool, not a tyrant. There are times to put it down.
After a Known Disruptor: You had a wedding, traveled across time zones, or had a necessary all-nighter. The data will be poor. You don’t need the ring to tell you you’re tired. Acknowledge it, don’t obsess over the red scores, and focus on gentle recovery.
During Vacation/True Rest: Consider taking a break from checking scores during a real holiday. The goal is to feel rested, not to achieve a perfect sleep score. Sometimes the pressure to “perform” in recovery can be counterproductive.
If It Causes Anxiety: If checking your app fills you with dread or fixation, take a 3-7 day break from looking at the data (but keep wearing the ring to maintain your baseline). Return with a more observational, curious mindset.
The goal is to use data for awareness, not obsession. The red flags are there to help you course-correct early. The green lights are there to affirm your efforts. The rest is just the beautiful, normal variability of being a living, responsive human being. Learning to track your progress objectively is part of this mindful approach, which you can explore further in how to track whether your nighttime routine is working.
Creating Your First Data-Driven Health Experiment
Knowledge is power, but applied knowledge is transformation. Now that you understand the metrics and their signatures, it’s time to actively engage with your data through structured self-experimentation. An “N=1” experiment (where you are the sole subject) is the most powerful way to discover what truly works for your unique biology. It turns vague advice into personal truth. Let’s walk through how to design and run your first simple, effective experiment.
Step 1: Choose One Clear, Actionable Habit
Start small and specific. Don’t try to change your diet, exercise, and sleep routine all at once. Pick one lever you can pull consistently.
Good Examples (Simple & Measurable):
“I will stop all caffeine after 12:00 PM.”
“I will take a 15-minute walk outside within 30 minutes of waking.”
“I will perform a 10-minute guided meditation every night 1 hour before bed.”
“I will finish dinner at least 3 hours before my target bedtime.”
“I will not bring my phone into my bedroom at night.”
Avoid: Vague goals like “sleep better” or “reduce stress.”
Step 2: Define Your Hypothesis and Metrics
Frame your experiment as an “If… then…” statement and decide which data points you will watch.
Hypothesis: “If I meditate for 10 minutes before bed for two weeks, then my deep sleep percentage will increase by an average of 5% and my nighttime HRV will show an upward trend.”
Primary Metrics to Watch: Deep Sleep %, Nighttime Average HRV.
Secondary/Context Metrics: Sleep Score, Time to Fall Asleep, Feeling upon waking (subjective note).
Step 3: Establish a Control Period and Run the Experiment
Control/Baseline Week (Days 1-7): Live your normal life without the new habit. Simply observe and record your relevant metrics. This establishes your “before” picture.
Intervention Week(s) (Days 8-21): Implement the new habit with as much consistency as possible. Keep other major lifestyle factors relatively stable (don’t simultaneously start a new intense workout program).
Log Contextual Notes: Use your ring’s journal feature or a simple notebook. Note anything that could affect data: “Late work deadline,” “Ate dinner late,” “Drank one glass of wine,” “Sick child woke me up.” This helps explain outliers.
Step 4: Analyze the Results—Look for Trends, Not Single Days
After 2-3 weeks, look at the trend lines.
Open your app’s trend view for your key metrics (e.g., HRV, Deep Sleep).
Did the trend line shift after you started the intervention? For example, did your HRV graph show a visible step-up in its baseline level?
Compare the average of your metric during the intervention period to the average during the control period.
Did your subjective feeling match the data? Even if the data shift is small, did you feel like you were sleeping more soundly or waking more refreshed?
Step 5: Draw a Conclusion and Decide
Positive Result: The data and your feeling align positively. Conclusion: “This habit has a beneficial effect on my recovery. I will adopt it permanently.” You’ve just used data to build a personalized, evidence-based wellness habit.
Inconclusive/No Result: The data shows no clear change. Conclusion: “This specific habit, at this dose, does not seem to be a major lever for me right now.” This is still a valuable finding! It saves you time and energy. You can drop it or tweak the experiment (e.g., try 20 minutes of meditation instead of 10).
Negative Result: The data got worse. Conclusion: “This habit may not be suitable for me.” (Example: Some people find vigorous evening yoga too stimulating; their data shows higher RHR and lower HRV).
Example Experiment in Action: The Caffeine Cut-Off
Habit: No caffeine after 12:00 PM.
Hypothesis: This will improve my sleep efficiency and increase my deep sleep.
Control Week: Drink coffee as usual (e.g., last cup at 3-4 PM). Average Deep Sleep: 1h 10m. Average Sleep Efficiency: 92%.
Intervention Week: Strict 12:00 PM cut-off. Average Deep Sleep: 1h 25m. Average Sleep Efficiency: 94%.
Analysis: A 15-minute average increase in deep sleep and a 2% efficiency gain. Subjective note: “Fell asleep easier, less ‘brain chatter’ at bedtime.”
Conclusion: The afternoon caffeine was negatively impacting my sleep architecture. I will adopt the 12:00 PM cut-off as a new rule.
By running these simple experiments, you move from passively consuming health information to actively discovering your personal formula for vitality. Each experiment builds self-knowledge and creates a positive, empowering feedback loop between your actions and your body’s responses.
Building Your Personal Health Feedback Loop
You’ve learned the metrics, understood their connections to habits, and even run an experiment. Now, we integrate these pieces into a sustainable, dynamic system: your Personal Health Feedback Loop. This is the ongoing process of observing data, interpreting it, taking intelligent action, and observing again—a continuous cycle of learning and optimization that makes health management proactive, personalized, and empowering.
The Four Stages of the Feedback Loop
Observe & Track (The Data Stream): This is the passive collection phase. Your ring is constantly gathering biometric data—sleep, HRV, RHR, activity. Your job here is simply to ensure consistent wear and periodically review the dashboards and trends.
Interpret & Analyze (The Insight Phase): This is where you apply the knowledge from this guide.
Contextualize: Is my low HRV today due to my hard workout yesterday (normal), my high-stress work week (concerning), or the glass of wine I had (informative)?
Look for Patterns: Use the weekly and monthly trend views. Is my temperature baseline creeping up? Is my deep sleep gradually improving since I started my new wind-down routine?
Ask “Why?”: When you see a significant deviation, especially a red flag pattern, hypothesize the potential cause.
Act & Adjust (The Intervention Phase): Based on your interpretation, you make a conscious choice.
Daily Micro-Adjustments: Your Readiness score is low? You swap your planned HIIT class for a yoga session or a long walk. You feel great and your score is high? You go for that personal record lift.
Habit Implementation: Your analysis shows poor sleep after late screen time. You implement a “no-phone-in-bedroom” rule and track its impact over two weeks.
Lifestyle Tweaks: You notice a trend of higher RHR every Monday morning. You investigate and realize your Sunday night social dinners are too rich and too late. You propose meeting friends for brunch instead.
Close the Loop & Reassess: After acting, you return to Stage 1. You observe the new data. Did your metrics respond as you hoped? This reassessment completes the loop and informs your next interpretation and action. It turns a linear experiment into a circular process of refinement.
How to Operationalize the Loop in Your Life
The Morning Check-In (5 Minutes):
Observe: Check your Sleep and Readiness scores.
Interpret: “Readiness is 65. That’s low for me. I felt stressed yesterday and had a poor night’s sleep.”
Act: “I will prioritize an easy day. I’ll take a walking meeting, do a gentle stretch at lunch, and aim to be in bed 30 minutes earlier tonight with a book instead of my laptop.”
The Weekly Review (15 Minutes, e.g., Sunday Evening):
Observe: Open your weekly trend view. Look at your Sleep Score, HRV, and RHR graphs for the past 7 days.
Interpret: “My HRV was in a good range all week except for Thursday night, which crashed. What happened Wednesday? Oh, right—the big project deadline and late-night pizza.”
Act: “Next time I have a big deadline, I’ll prep a healthy dinner in advance and schedule a 10-minute breathing exercise to manage stress, then watch my Thursday night data to see if it helps.”
The Monthly Audit (30 Minutes, End of Month):
Observe: Look at your 30-day trends and monthly averages.
Interpret: “My average deep sleep increased from 1h15m to 1h25m this month. My average HRV trend is slightly up. The new meditation habit seems to be working!”
Act: “Great. I’ll keep the meditation habit. Next month, I’ll experiment with adding a consistent wake-up time to see if it improves my sleep consistency even more.”
The Mindset: Progress, Not Perfection
The goal of the feedback loop is not to achieve perfect scores every day—that’s impossible and unhealthy. The goal is awareness and intelligent response. A “bad” data day is not a failure; it’s a crucial data point that helps you understand your limits and triggers. A “good” data day is a confirmation of what supports you.
This system liberates you from rigid, one-size-fits-all plans. Instead of following a generic prescription to “get 8 hours of sleep,” you are following a personalized, adaptive plan that says, “Based on my body’s current state and my personal baseline, here is the sleep and activity pattern that will keep me functioning at my best.”
By building this feedback loop, you are no longer just wearing a smart ring. You are engaging in an ongoing, collaborative dialogue with your own body, using data as your shared language. This is the essence of modern, empowered self-care.
Integrating Ring Data with Other Health Tools and Apps
Your smart ring is a powerhouse of physiological data, but it doesn't exist in a vacuum. To create a truly holistic picture of your health, you can—and should—integrate its insights with other tools in your wellness arsenal. This creates a synergistic ecosystem where each piece of information enriches the others, moving you from fragmented data points to a unified, actionable health narrative. Think of it as connecting the dots between how your body functions (ring data) and how you fuel it, move it, and feel about it.
The Synergy of Biometrics and Nutrition Tracking
What you eat is the fuel for the biological processes your ring measures. Connecting these two worlds is transformative.
Macros and Micros vs. Recovery: Link your ring data with an app like Cronometer or MyFitnessPal. After a few weeks, you can ask powerful questions:
“On days I meet my protein goal, do I see better next-day recovery scores or more deep sleep?”
“Does a higher intake of magnesium-rich foods (leafy greens, nuts) correlate with a lower sleeping heart rate or improved HRV?”
“When my carbohydrate intake is very low, do I experience more sleep disturbances or a higher resting heart rate?”
Meal Timing Insights: As explored earlier, late meals impact sleep. By logging your last meal time in a nutrition app and reviewing your subsequent sleep graph (looking for elevated heart rate and reduced HRV), you get undeniable, personalized evidence for optimizing your eating schedule.
Food Sensitivities & Inflammation: While not diagnostic, patterns can be suggestive. If you notice a consistent signature of elevated nighttime temperature, higher RHR, and lower HRV after consuming certain foods (e.g., dairy, gluten, high-sugar items), it may point to a mild inflammatory response worthy of further exploration with a healthcare professional.
Fitness Apps and Wearables: Creating the Full Stress/Recovery Picture
Your ring measures the impact of stress (both physical and mental). Fitness trackers and apps measure the input of physical stress.
Workout Logs and Readiness: Syncing your ring with Strava, Apple Health, Google Fit, or training apps like Strong creates a seamless log. Now, you can see exactly how a specific 10K run or heavy leg day impacts your HRV and RHR over the following 48 hours. This allows for exquisite workout personalization: “My data shows it takes me two full days to recover from heavy squats, so I’ll program my schedule accordingly.”
Heart Rate Zone Training: While rings provide heart rate data, a chest strap or armband monitor is often more accurate for capturing rapid spikes during intense intervals. You can use the chest strap for the precise workout data and rely on your ring for the superior overnight recovery metrics. Together, they tell the complete story of the workout’s dose and your body’s response.
Active vs. Passive Calories: Your ring’s activity score is based on movement and heart rate. Comparing it with a fitness tracker’s calorie burn estimate can be enlightening. A high activity score with a low calorie burn might indicate lots of low-intensity movement (NEAT), which is excellent for metabolic health, while a high calorie burn from a single intense workout might come with a significant recovery cost visible in your ring data.
Mental and Emotional Wellness Apps: Quantifying the Mind-Body Connection
This is where you bridge the gap between subjective feeling and objective physiology.
Mood and Stress Logging: Apps like Daylio, Bearable, or even a simple notes app are perfect for logging subjective states: energy levels, mood (1-10), stress events, anxiety, joy. After 30 days of logging mood alongside your biometric trends, powerful correlations emerge.
“My HRV is consistently 15% higher on days I log my mood as ‘calm’ or ‘happy.’”
“The two days I logged ‘high anxiety’ were followed by nights with dramatically less REM sleep.”
This data validates your feelings and provides a physiological target: activities that improve your metrics (like meditation) are likely to improve your mood, and vice-versa.
Meditation Apps (Headspace, Calm): Directly test the impact of your practice. Log a 10-minute meditation session in your journal and see if that night’s HRV shows a positive deviation. Many find this tangible feedback incredibly motivating to maintain their practice.
The Central Hub: Apple Health and Google Fit
These platforms are designed to be the central repository for all your health data. By granting your smart ring app permission to write data to them, and granting other apps permission to read it, you create powerful automated connections.
Automated Correlation: Health apps with AI insights (like Welltory or Exist) can pull in your ring’s sleep, HRV, and heart rate data, your nutrition app’s calorie and macro data, and your fitness app’s workout data to run automated analyses and surface correlations you might miss.
The Unified Dashboard: Instead of jumping between 5 apps, you can often see a unified dashboard in Apple Health or Google Fit that shows your activity, sleep, and heart rate data side-by-side for any given day.
Sharing with Professionals: With your data consolidated, you can easily generate reports or share trends with a doctor, nutritionist, or trainer, providing them with a rich, objective dataset to inform their advice.
Practical Integration Steps:
Start Small: Don’t try to connect everything at once. First, connect your ring to Apple Health/Google Fit.
Add One Layer: Choose one area to deepen. Are you most curious about food? Connect a nutrition app. Focused on training? Connect your fitness app.
Observe for One Month: Let the data accumulate without forcing conclusions. Look for the story at the end of the month.
Ask One Question: Use the combined data to answer a single, burning personal health question.
By integrating your ring data with other tools, you move from observing isolated physiological phenomena to understanding their causes and consequences in your daily life. This integrated map is your most powerful tool for navigating toward better health. For instance, if your integrated data points to poor sleep hygiene, exploring nighttime routine and technology: what to use and avoid could provide the specific behavioral changes needed to improve your metrics.
From Data to Dialogue: Talking to Your Doctor with Evidence
One of the most powerful, yet underutilized, applications of smart ring data is enhancing communication with healthcare professionals. Walking into a doctor’s office and saying, “I’m tired all the time,” provides limited information. Walking in with three months of trend data showing a progressively elevating resting heart rate, declining HRV, and fragmented deep sleep transforms that vague symptom into a specific, objective clinical picture. This section is about becoming an empowered, data-literate partner in your own healthcare.
Preparing for the Appointment: Curating Your Data Narrative
Doctors are incredibly time-constrained. Your goal is to present clear, concise, and relevant evidence.
Identify the Concern: What is the primary issue? Chronic fatigue? Poor sleep? Unexplained anxiety? Post-exercise recovery issues?
Gather Relevant Trends: Don’t show daily graphs. Use your app’s trend feature to export or screenshot the 3-month view of the 2-3 most relevant metrics.
Fatigue/Suspected Illness: Trends for Resting Heart Rate, HRV, and Temperature Deviation. A doc will instantly recognize the pattern of a body under prolonged stress or fighting low-grade inflammation.
Sleep Issues: Trends for Sleep Score, Deep Sleep %, REM %, and Nighttime Blood Oxygen (if available). Also, use the journal to note subjective feelings: “Woke up 5+ times feeling anxious,” “Never feel rested.”
Recovery/Overtaining: Trends for HRV, RHR, and Sleep Score aligned with your workout log.
Create a One-Page Summary: A single page with:
Patient Summary: Age, primary complaint.
Key Biometric Trends: 2-3 small, clear graphs with a 1-sentence caption: “Figure 1: Resting Heart Rate has increased by an average of 8 BPM over the past 90 days.”
Lifestyle Context: Bullet points of relevant habits you’ve tracked: “Consistently 7-8 hours in bed, alcohol 2x/week, high-stress job.”
Specific Questions: “Could this pattern be consistent with thyroid dysfunction?” “Do these oxygen dips warrant a sleep study?” “How can we investigate this elevated inflammatory signature?”
How This Data Aids Differential Diagnosis
Your data provides context that standard in-office vitals (a single-point measurement) cannot.
Thyroid Disorders: Both hyper- and hypothyroidism can disturb sleep architecture, elevate resting heart rate, and affect temperature regulation. Showing a long-term trend of these metrics provides clues.
Sleep Disorders (Apnea, Insomnia): Consistently low SpO2 graphs with frequent awakenings are a strong indicator for sleep apnea. Data showing long sleep latency and fragmented sleep supports an insomnia diagnosis far more effectively than just saying “I can’t sleep.”
Adrenal Dysfunction / Chronic Stress: The signature of high RHR, low HRV, and poor sleep recovery is classic for HPA-axis dysregulation (adrenal fatigue). This objective data can steer a conversation toward stress hormone testing (cortisol saliva tests).
Monitoring Treatment Efficacy: Starting a new medication for anxiety or hypertension? Your ring data can provide daily feedback on its physiological impact. Is your sleeping heart rate now lower? Is your HRV improving? This can help you and your doctor fine-tune dosage or timing.
Navigating the Conversation: Dos and Don’ts
DO: Present yourself as a collaborative partner. “I’ve been tracking some biometrics to better understand my symptoms, and I’ve brought some trends I’d like your perspective on.”
DO: Focus on patterns, not single days. “I’ve noticed a trend, not just a bad week.”
DO: Acknowledge the limits. “I know this is consumer data, not diagnostic, but I hope the trends provide some useful context.”
DON’T: Self-diagnose. “My ring says I have sleep apnea.” Instead, say: “My ring shows frequent oxygen dips and awakenings. Does this warrant a clinical sleep study?”
DON’T: Be defensive if the doctor is unfamiliar with the technology. Be prepared to explain briefly what HRV and RHR trends indicate in simple terms: “It’s a measure of how well my nervous system is recovering.”
Building a Long-Term Health Partnership
With your data, you can move from episodic “sick care” to continuous health monitoring. You can go to your annual physical with a year’s worth of data, showing how your metrics shift with seasons, stress, and lifestyle changes. This proactive approach can help catch subclinical issues before they become full-blown problems and turns your doctor into a true partner in your long-term wellness journey, supported by a rich stream of personalized evidence.
Mastering the Art of Trend Analysis Over Daily Obsession
We’ve touched on this throughout, but it deserves its own deep dive because it is the single most important mental shift for sustainable, anxiety-free use of health data. The daily number is a snapshot, often noisy and influenced by a hundred small factors. The trend is the truth, revealing the slow, powerful currents of your health trajectory. Mastering trend analysis liberates you from the rollercoaster of daily scores and anchors you in meaningful progress.
Why Daily Data is Inherently Noisy
Your body is not a machine that outputs identical readings under identical conditions. It’s a complex, adaptive system influenced by:
Circadian Rhythms: Your HRV and RHR follow a natural 24-hour curve.
Ultradian Rhythms: 90-120 minute cycles of alertness and fatigue throughout the day.
Minor Stressors: A difficult commute, a tense conversation, a missed meal.
Measurement Artifact: The ring shifting slightly on your finger during sleep.
A single day’s score is the sum of these signals and noises. Reacting to it is like trying to navigate by looking at a single wave instead of the direction of the tide.
How to Read the Four Key Trend Lines
In your app, learn to live in the “Weekly” and “Monthly” view. Focus on the direction and slope of these lines:
HRV Balance (The Resilience Trend): This is your prime metric. Is the monthly average line sloping gently upward? That is a definitive sign of improving health and resilience, even if you have low days. A flat line is maintenance. A downward slope is your clearest early warning sign to investigate lifestyle strain.
Resting Heart Rate (The Load Trend): The opposite of HRV. A gentle downward slope in your monthly RHR average indicates improving cardiovascular efficiency. A rising slope indicates accumulating physiological load (stress, illness, overtraining).
Sleep Score Consistency (The Rhythm Trend): Don’t just look at the average score. Look at the variability. A tight cluster of scores between 75-85 is better than a wide scatter between 60-90, even if the average is the same. High consistency means your sleep habits and schedule are stable—a major health win.
Temperature Baseline (The Inflammation/Health Trend): Look for shifts in the baseline level, not the nightly spikes. A sustained step-up in your baseline temperature over weeks can be significant. For women, this trend line will show the beautiful, clear biphasic pattern of the menstrual cycle.
Setting S.M.A.R.T. Goals Based on Trends
Instead of “get better sleep,” set trend-based goals:
Specific & Measurable: “Increase my 30-day average HRV from 42 ms to 47 ms.”
Achievable: “Improve my sleep consistency so that 80% of my nightly scores are within a 10-point range (e.g., 75-85) over the next quarter.”
Relevant: “Lower my 90-day average Resting Heart Rate by 3 BPM through consistent cardio training.”
Time-Bound: “Achieve the above within the next 3 months.”
These goals are objective, trackable, and focused on long-term health rather than daily performance.
The Psychological Shift: From Judge to Coach
This is the core of the mindset change.
The Daily Judge says: “My score is 72. That’s bad. I failed today.” This leads to anxiety, obsession, and burnout.
The Trend Coach says: “My score is 72, which is below my trend average. Let’s see… I had a hard workout yesterday and a late work call. That explains the acute dip. The monthly trend is still upward, so I’m on the right track. Today, I’ll prioritize good recovery to get back on trend.” This leads to curiosity, resilience, and sustainable progress.
When to Break the “Ignore Daily Data” Rule
There are two exceptions:
The Acute Illness Red Flag: A single day of massive temperature deviation (+1.5°F+) with high RHR is an actionable daily data point.
The Positive Reinforcement: Noticing that a specific good habit (e.g., an Epsom salt bath) led to your highest HRV of the month is a wonderful piece of personal evidence to celebrate and reinforce.
By focusing on trends, you align your perspective with how your body actually changes—slowly and cumulatively. You celebrate the upward drift, course-correct the downward drift, and remain peacefully detached from the daily noise. This is the path to a lifelong, positive relationship with biofeedback. For those whose sensitivity to environment creates daily noise, specialized strategies can help smooth the trend, as seen in the nighttime routine for light sleepers and insomniacs.
Advanced Insights: HRV Biofeedback and Stress Resilience Training
Heart Rate Variability is more than just a score to read; it’s a physiological lever you can actively pull to improve your state in real-time. This moves you from passive tracking to active training. HRV Biofeedback is a well-researched technique where you use your breath to directly influence your autonomic nervous system, with the ring’s real-time HRV or heart rate reading as your guide. It’s like strength training for your vagus nerve and stress resilience.
The Science of Coherence: Breathing Your Way to Balance
The core principle is resonant frequency breathing. At a specific, slow breathing rate (typically 5-6 breaths per minute, or 5-second inhale/5-second exhale), your heart rate, blood pressure, and respiratory rhythms synchronize. This state, called physiological coherence, maximizes HRV and powerfully activates the parasympathetic (rest-and-digest) nervous system.
The Effect: Reduces cortisol (stress hormone), increases DHEA (anti-aging hormone), improves emotional regulation, and enhances cognitive function.
Setting Up Your Personal Biofeedback Session
You can use your ring’s real-time heart rate display or a dedicated HRV biofeedback app (like Elite HRV or Welltory) that connects to your ring’s data stream.
Find a Quiet 5-10 Minutes: Sit comfortably, back straight.
Initiate Real-Time Mode: Open your ring’s app to the live heart rate screen, or start a session in a biofeedback app.
Begin Resonant Breathing: Inhale deeply through your nose for a count of 5, feeling your diaphragm expand. Exhale slowly through your mouth or nose for a count of 5. A 5.5-second cycle (inhale 5.5, exhale 5.5) is the scientific average, but find what feels natural between 4.5 and 6.5 seconds.
Watch the Feedback: On a heart rate graph, you will see a smooth, wave-like pattern emerge—your heart rate rising gently on the inhale and falling on the exhale. This is the “coherent” wave. In an HRV app, you’ll see your HRV number climb and stay high.
Practice Daily: Just 5-10 minutes of this practice, especially during a stressful afternoon or as part of your wind-down routine, can yield significant benefits. The immediate feedback is motivating: you can see your physiology calm down.
Using Biofeedback for Specific Outcomes
Pre-Performance Calm: Use a 5-minute session before a big meeting, presentation, or creative work to settle nerves and sharpen focus.
Anger/Anxiety Interruption: When you feel emotionally triggered, step away and do 2-3 minutes of coherent breathing while watching the wave pattern form. It physically interrupts the stress cascade.
Sleep Onset: If you struggle to fall asleep, practice in bed (with the screen face-down or in night mode). The combination of the breathing and the focused attention pulls you out of “fight-or-flight” and into “rest-and-digest,” making sleep a natural next step. This technique is a cornerstone for anyone looking to build a routine that reduces next day anxiety.
Tracking the Long-Term Impact of Training
This is where your ring’s trend data shines.
Acute Effect: Check your HRV graph for the night after you do a biofeedback session. Do you see a higher-than-average point? Many do.
Chronic Adaptation: After 30 days of consistent practice (5+ minutes daily), look at your monthly HRV trend line. Has the baseline shifted upward? Has your resting heart rate trend shifted downward? This is concrete proof you are building a more resilient system.
Subjective Correlation: Log your sessions and note your mood. Over time, you’ll likely find that days with practice feel subjectively calmer and more in control.
Beyond Breathing: Other Vagus Nerve Stimulators
Your ring can help you validate other coherence-building practices:
Humming or Singing: Vibrates the vagus nerve. Try humming for 5 minutes and see if your subsequent real-time HRV rises.
Cold Exposure: A brief cold shower can be a stressor, but for many, it triggers a powerful parasympathetic rebound. Check your HRV in the hours after—does it dip then spike?
Social Connection & Laughter: Genuine positive social interaction is a potent vagus nerve stimulant. You might see a higher HRV on days filled with warm connection.
By engaging in HRV biofeedback, you stop being a passenger in your body’s stress response and become the pilot. You use the data not just for information, but for direct intervention, building the skill of self-regulation that pays dividends in every area of your life.
Troubleshooting Common Data Discrepancies and Pitfalls
As you deepen your engagement with ring data, you’ll inevitably encounter confusing moments: a night you felt great but scored poorly, a day you were exhausted but your readiness score is high, or a sudden metric shift that seems to defy explanation. Before dismissing the data or spiraling into confusion, it’s time to put on your detective hat. Here’s a guide to troubleshooting common discrepancies and avoiding classic pitfalls.
“I Feel Great, But My Scores Are Low” (The False Negative)
This is a common frustration. Several factors can cause it:
Physiological Strain Before Subjective Feeling: Your body often registers strain (from a tough workout, an immune challenge, or emotional stress) in your biometrics 12-48 hours before you consciously feel tired or off. A low score today might be predicting how you’ll feel tomorrow. Action: Treat the score as a preventative warning. Lighten your load today and see if you avoid a crash tomorrow.
Ring Fit and Data Artifact: A ring that is too loose can cause poor PPG signal, leading to inaccurate heart rate readings that skew HRV and sleep staging. Action: Ensure a snug (but comfortable) fit. The ring should not spin easily. The sensors should be in constant contact with the skin on the underside of your finger.
Algorithm Lag: Sometimes the algorithm is catching up. For example, if you’re in the midst of building fitness, your body is under positive stress. The initial response is a dip in HRV. The “rebound” and improved baseline might take a few weeks to manifest in your scores. Action: Look at the 2-week trend, not today. Is the overall direction positive?
“I Feel Terrible, But My Scores Are High” (The False Positive)
This can be even more perplexing.
Adrenal Overdrive/“Wired and Tired”: In states of chronic stress or burnout, your sympathetic nervous system can be stuck “on,” masking fatigue with stimulatory hormones (cortisol, adrenaline). Your heart rate may be elevated, but the variability between beats (HRV) can be paradoxically low or chaotic. Not all algorithms parse this state perfectly; some might still give a middling score. Action: Look at the raw metrics, not just the composite score. Is your RHR high? Is your HRV low or unstable? The subjective feeling of being “wired but drained” trumps a mediocre readiness score.
Mental/Emotional Fatigue vs. Physical Readiness: Your ring measures physiological recovery. You can be physically fully recovered (good HRV, low RHR) but mentally exhausted from cognitive work or emotional labor. The ring can’t measure your prefrontal cortex’s fatigue. Action: Learn to differentiate the types of fatigue. Use subjective mood logging alongside your data.
Masking with Substances: Caffeine or other stimulants can artificially lower your perceived fatigue without improving your underlying physiological recovery state. Your data may show the true strain (elevated RHR, lower HRV) even if you feel “okay” in the morning.
Sudden, Unexplained Shifts in Baseline
If your metrics change dramatically for more than 3 days without an obvious lifestyle cause, consider:
Environmental Factors: Significant change in bedroom temperature (start of summer/winter), new noise pollution, a different mattress, or a partner’s changed schedule.
Medication Changes: Starting, stopping, or changing the dose of any medication—even over-the-counter ones like antihistamines—can impact sleep architecture, heart rate, and HRV.
Subclinical Health Shifts: A mild, asymptomatic infection, a developing nutrient deficiency (e.g., iron, vitamin D), or hormonal fluctuations outside of a normal cycle.
Ring Sensor Issue: Is the lens clean? Is there a software update pending for the ring or app? Action: Restart the ring and phone app, ensure the latest firmware, and clean the sensor lens with a dry, soft cloth.
Avoiding the Pitfall of “Health Anxiety from Data”
This is a real risk for detail-oriented individuals. The remedy is ritual and perspective.
Set Boundaries: Designate one time in the morning to check your scores, and perhaps a weekly review. Do not check constantly throughout the day.
Focus on Feel First: Each morning, ask yourself “How do I feel?” and jot down three words before you look at the app. This keeps subjective experience as the primary measure.
Embrace the “Good Enough” Range: Health is not about maximizing every metric every day. It’s about staying within a functional, resilient range 80% of the time. Allow for life’s 20%—the celebrations, the travel, the stressors—without guilt or over-analysis.
By learning to troubleshoot, you develop a more nuanced, trusting relationship with the technology. It becomes a sophisticated tool with known limitations, not an omniscient oracle. This realistic understanding is the final step toward mature, empowered data mastery. And remember, if environmental factors are the culprit, optimizing your space is key, as discussed in how to create a nighttime routine in a small space.