The Health Tracking Technology That Powers Readiness Scores
Details how algorithms combine various metrics to produce a single "readiness" or "recovery" score.
Details how algorithms combine various metrics to produce a single "readiness" or "recovery" score.
You wake up, reach for your phone, and glance at a single number that seems to hold a mirror to your entire being: your Readiness Score. An 85 suggests you’re primed to conquer the day—time for that intense workout or crucial presentation. A 62 whispers a cautionary tale, hinting at lingering stress or poor recovery, nudging you toward rest. This simple digit has become a trusted advisor for millions, transforming how we approach our daily health, performance, and well-being. But where does this profound insight come from? What sorcery happens on your finger to translate a night’s sleep into actionable intelligence?
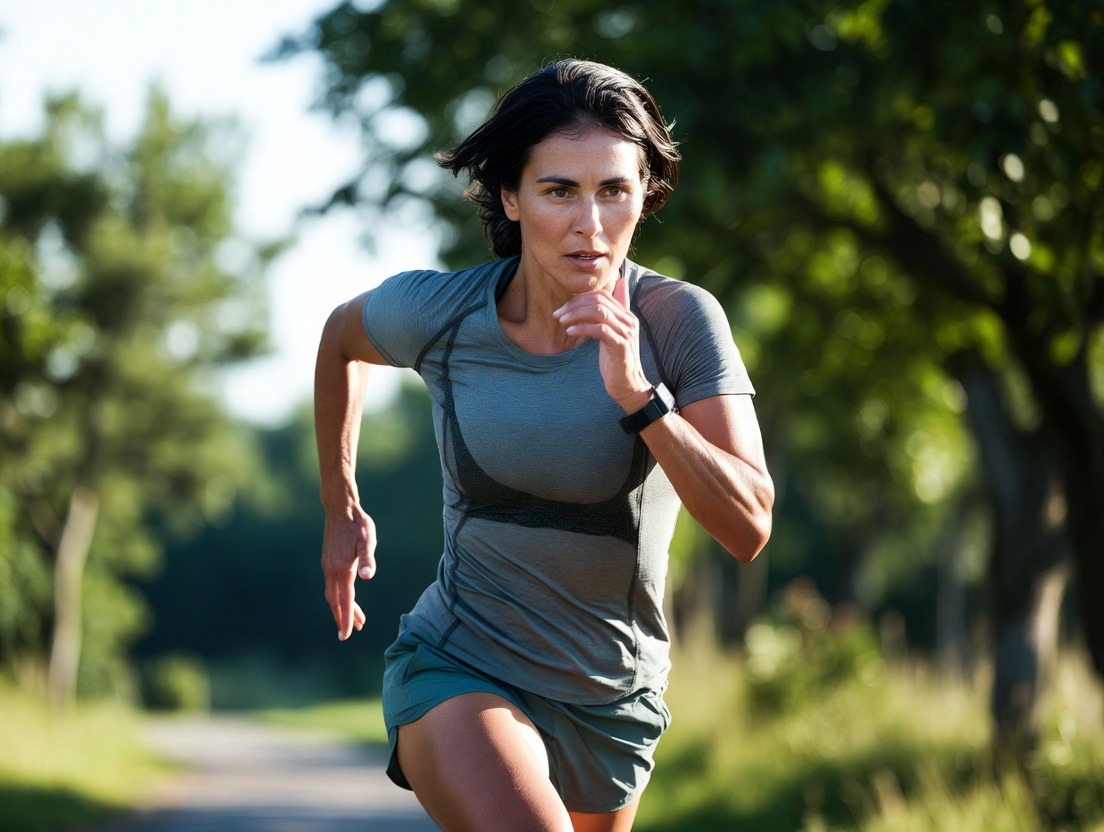
Gone are the days of tracking mere steps. The modern wellness revolution is not about counting; it’s about understanding. At the forefront are sleek, unobtrusive smart rings, like those from Oura, Whoop, and others, which have moved wellness tracking from our wrists to a more intimate, continuous location. These devices promise not just data, but wisdom—a synthesized view of your body’s complex, internal state. The crown jewel of this insight is the Readiness Score (sometimes called Recovery, Strain, or a similar metric), a holistic gauge of your capacity to perform, adapt, and thrive.
This number isn’t a guess. It’s the culmination of a breathtaking symphony of biomedical sensors, advanced signal processing, and proprietary algorithms, all miniaturized into a band of titanium or ceramic. It represents a fundamental shift from reactive healthcare to proactive, personalized health optimization. This article is your deep dive into the hidden world inside that ring. We will unravel the precise technology that powers your score, exploring how raw photonic signals and electrical impulses are transformed into a guide for living better. We’ll demystify the sensors, decode the biomarkers, and explore how this convergence of biophysics and data science is creating a new language of the self. Prepare to understand not just what your score is, but the remarkable journey of how it comes to be.

Before we dissect the technology, we must first understand the concept it serves. A Readiness Score is a composite metric designed to answer one fundamental question: What is my body’s current capacity for stress and exertion? Unlike a fitness tracker that simply records what you do, a readiness score aims to quantify how well you are—specifically, how recovered you are from previous physical, mental, and emotional loads.
Think of your body as a battery. Every workout, work deadline, social engagement, and late night drains that battery. Sleep, nutrition, and relaxation are the charging process. Your Readiness Score is, in essence, a real-time battery percentage indicator for your physiological and nervous systems. A high score means you’re fully charged and capable of handling significant stress (which can be positive, like a hard training session). A low score indicates a depleted state, where additional stress could lead to diminished returns, increased injury risk, burnout, or illness.
But why has this metric become so pivotal? We live in an age of chronic overwhelm, where the lines between work and rest are perpetually blurred. The "always-on" culture pushes us to ignore our body’s subtle signals of fatigue, leading to a state of permanent, low-grade exhaustion. We push through workouts when we’re drained, schedule back-to-back meetings without a breath, and sacrifice sleep for productivity, all while wondering why our energy, mood, and performance suffer. The Readiness Score intervenes as an objective, data-driven coach. It externalizes our internal state, providing a check against our own often-flawed perceptions (like feeling "pumped" on adrenaline while actually being deeply fatigued).
Its importance lies in its application:
Ultimately, the rise of the Readiness Score marks a shift toward restful living—a philosophy where strategic recovery is not a sign of weakness but the cornerstone of sustained high performance and health. It empowers you to work with your body’s rhythms, not against them.
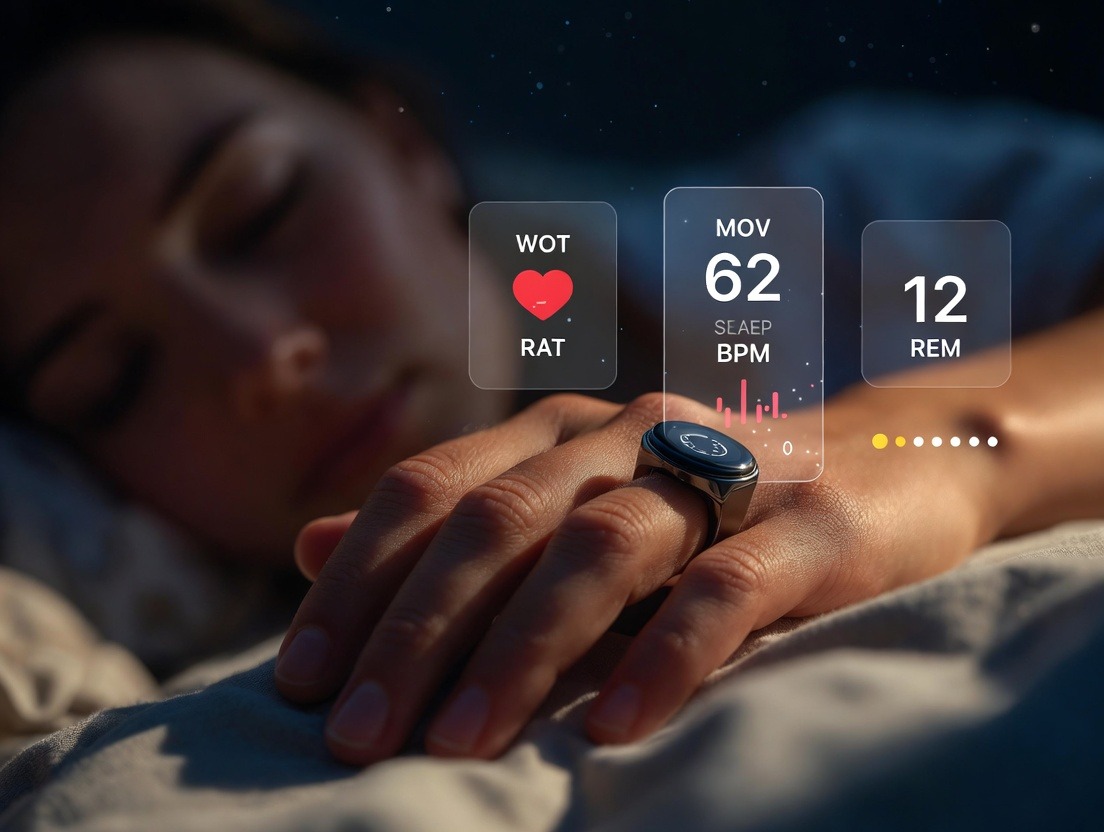
The magic begins with the ring’s ability to capture raw, continuous physiological data from the complex vascular bed of your finger. This location is surprisingly ideal: it’s rich in capillaries, provides a strong pulse signal, and, unlike a wrist, has minimal motion from everyday activities, reducing noise. The ring is a fortress of miniaturized technology, housing several key sensors that work in concert.
Photoplethysmography (PPG) Sensors: The Heart of the Matter
The primary workhorse is the PPG sensor. At its simplest, it’s a light-based technology. It emits light (typically green, and sometimes red and infrared LEDs) from an LED into the skin of your finger. A photodetector then measures the amount of light that is reflected back. Why does this matter? Blood absorbs light. With each heartbeat, blood volume in the capillaries increases slightly, absorbing more light. Between beats, volume decreases, so more light is reflected back. By sampling this reflected light hundreds of times per second, the PPG sensor creates a waveform—a PPG signal—that mirrors your pulse. This continuous stream is the foundational river of data from which heart rate, heart rate variability, respiratory rate, and even blood oxygen saturation are derived.
3D Accelerometer and Gyroscope: Capturing Motion and Position
While the PPG reads your internal state, the inertial measurement unit (IMU)—comprising a 3-axis accelerometer and gyroscope—reads your external world. The accelerometer measures linear movement (up/down, side-to-side, forward/back), while the gyroscope measures rotational movement and orientation. Together, they paint a precise picture of your activity: Are you walking, running, cycling, or completely still? The granularity is astonishing—they can detect the subtle movements of your hand during sleep to classify sleep stages and even identify specific activities like typing or weightlifting. Crucially, they also serve as a quality-control mechanism for the PPG data, helping the algorithm distinguish between a rising heart rate from exercise and motion-induced noise from fidgeting.
Skin Temperature Sensor: The Silent Metabolic Beacon
Nestled against your skin is a precision thermistor. It continuously measures the temperature at the surface of your finger. While not a direct measure of core body temperature, peripheral skin temperature is a powerful proxy for physiological processes. It follows a circadian rhythm, typically dipping at night to initiate sleep and rising in the morning to promote wakefulness. Significant deviations from your personal baseline can be early indicators of oncoming illness, inflammation, stress, or changes in metabolism. It’s a subtle, slow-moving signal that provides critical context to the faster-paced heart and motion data.
The Synergy
These sensors do not operate in isolation. The true power emerges from their fusion. The PPG might show an elevated nighttime heart rate. Is it due to a fever (indicated by a elevated skin temp), a stressful dream (indicated by motion spikes from tossing and turning), or simply a hot room? The algorithm cross-references all these data streams to find the most probable cause. This multi-modal sensing is what separates advanced readiness platforms from simple heart rate monitors. It creates a rich, multi-dimensional portrait of your physiology 24/7, forming the essential raw material for the score you see each morning. This constant monitoring also provides the foundational data needed for a concept like restful living through the seasons, adapting your approach, as it can track how your baseline physiology shifts with environmental changes.
For most readiness algorithms, sleep is not just a contributor; it is the single most critical input. The night is when your body undertakes its most profound repair work—cellular cleanup, memory consolidation, hormone regulation, and immune system strengthening. Your ring transforms this biological process into quantifiable data, dissecting your sleep into its architectural components.
Sleep Staging: Beyond Just "Asleep"
Using the combined PPG and motion data, sophisticated machine learning models classify each minute of the night into one of four stages: Wake, Light Sleep, Deep Sleep (N3), and REM (Rapid Eye Movement) Sleep. Each stage has a distinct physiological signature:
The algorithm doesn’t just tally minutes; it analyzes the structure and quality of this architecture. Did you get sufficient deep sleep early in the night? Did you cycle through REM periods adequately? Was your sleep fragmented by frequent awakenings (even if you don’t remember them)? A disrupted architecture, even with adequate total time, can significantly dampen your readiness score.
The Gold Standards: Sleep Latency, Efficiency, and Timing
By synthesizing these sleep metrics, the ring quantifies the effectiveness of your recharge. A high readiness score is essentially a stamp of approval on your sleep quality, indicating your body had the time and conditions it needed to complete its essential nocturnal work. This deep understanding of sleep’s role is fundamental to any philosophy of restful living for high achievers who seek performance through rest.
If you were to listen only to the beats of your heart, you would hear what seems like a steady, metronomic rhythm: lub-dub, lub-dub. But in the precise millisecond intervals between those beats lies one of the most powerful biomarkers in modern physiology: Heart Rate Variability (HRV). Your readiness score leans heavily on this metric.
What HRV Really Measures
Contrary to intuition, a healthy heart does not tick like a clock. The time between successive heartbeats varies slightly, modulated by your autonomic nervous system (ANS). Your ANS has two main branches: the sympathetic ("fight-or-flight") and the parasympathetic ("rest-and-digest"). These are in a constant, dynamic tug-of-war.
How the Ring Calculates It
The ring’s PPG sensor captures the precise timing of each heartbeat, creating a series of inter-beat intervals. Advanced algorithms (like RMSSD or SDNN) then analyze the variation within these intervals over a period, typically a 5-minute segment during deep sleep to ensure a clean, stable reading. This nighttime HRV, stripped of the day’s acute stressors, is considered your baseline HRV—a pure read of your recovery state.
HRV’s Role in Your Score
Your readiness algorithm compares your current night’s HRV to your own personal, rolling baseline. A significant drop is a red flag: your body is signaling that it’s dealing with extra load—be it from illness, intense training, psychological stress, or poor lifestyle choices. This objective measure often picks up strain before you feel it subjectively. Therefore, HRV serves as a primary, non-negotiable pillar of your readiness score. It’s the clearest window into the balance—or imbalance—of your nervous system, making it a cornerstone metric for anyone exploring how breathwork supports restful living on a daily basis, as breathing is a direct lever to influence ANS balance and HRV.
While HRV measures the variability between beats, Resting Heart Rate (RHR) and Respiratory Rate (RR) provide crucial, straightforward readings of your body’s baseline metabolic and respiratory workload.
Resting Heart Rate: The Engine's Idle Speed
Your RHR is the number of times your heart beats per minute when you are completely at rest—typically derived from sleep or periods of profound calm. A well-recovered, fit cardiovascular system operates efficiently, requiring fewer beats to circulate blood. Thus, a lower RHR (within a healthy range) generally indicates better fitness and recovery. More importantly, deviations from your personal baseline are highly informative. A RHR that is 5-10 beats per minute higher than usual upon waking is a classic sign that your body is under strain. It could be fighting an infection, dealing with dehydration, processing excessive alcohol, or struggling to recover from extreme physical exertion. The readiness algorithm tracks this baseline diligently, treating a elevated RHR as a cost your body is paying, which subtracts from your capacity for new stress.
Respiratory Rate: The Forgotten Vital Sign
Often overlooked, the number of breaths you take per minute is a profoundly sensitive vital sign. The ring extracts this seamlessly from the PPG signal itself—with each heartbeat, there are subtle, wave-like modulations caused by the pressure changes of breathing. This is called the respiratory sinus arrhythmia. Your respiratory rate during sleep is remarkably stable. An elevated nighttime respiratory rate can be an even earlier indicator of physical or mental stress than heart rate. It can signal anything from respiratory infection and anxiety to metabolic disturbance or sleep apnea. By establishing your personal baseline (typically 12-16 breaths per minute during sleep), the algorithm can detect subtle increases that contribute to a lower readiness score, flagging that your system is working harder than it should be at rest.
Together, RHR and RR form a simple yet powerful duo. They answer basic questions: Is my engine idling higher than normal? Is my breathing labored at rest? When the answers are "yes," it’s a direct signal that recovery is incomplete, and your readiness score will reflect that deficit. Managing these fundamentals is a key part of establishing the weekly restful living plan that creates structure for sustainability.
The skin temperature sensor provides a slow-burning, longitudinal narrative that complements the minute-by-minute story told by your heart and breath. It’s not about a single reading but about trends and deviations from your established personal baseline.
Circadian Rhythm and Temperature
A healthy body temperature follows a predictable 24-hour cycle, orchestrated by your circadian clock. It typically begins to drop in the evening, facilitating the onset of sleep, reaches its nadir in the early morning hours, and then rises to help you wake up and become alert. Your ring learns this unique rhythm for you. A consistent, well-defined temperature curve is a sign of a robust, well-entrained circadian rhythm, which is foundational for quality sleep and overall health.
Deviations as Diagnostic Clues
When your temperature pattern deviates, it’s a flag for the algorithm:
In the calculus of readiness, a significant temperature deviation is treated as a significant physiological event. It tells the system that your body’s resources are being diverted to manage an internal challenge—whether an immune response or systemic inflammation—leaving fewer resources available for external performance. Thus, even if your sleep and HRV look decent, a feverish trend will pull your score down, advising you to prioritize rest and recovery. This kind of nuanced feedback is essential for learning how to establish restful living boundaries, saying no to protect your energy when your body is fighting a hidden battle.
Readiness is not just about how you recover at night; it’s intrinsically linked to what you do during the day. The activity you accumulate is the "stress" that necessitates the "recovery" the score measures. Smart rings have evolved to quantify this daytime exertion with impressive accuracy, creating a closed feedback loop.
From Motion to Metabolic Strain
The accelerometer and gyroscope track all your movement. But the algorithm’s job is to translate raw movement into physiologically meaningful metrics. It uses the intensity, duration, and type of movement to estimate calorie expenditure. More importantly, it analyzes the cardiovascular impact by continuously monitoring your heart rate throughout the day. The combination of sustained elevated heart rate and specific motion signatures allows it to automatically detect and classify activities—be it a 30-minute run, a hour-long walk, or a weightlifting session.
The Concept of "Strain" or "Activity Score"
Most platforms generate a daily metric that encapsulates your total physiological load: WHOOP calls it "Strain," Oura calls it "Activity Score." This number represents the cumulative cost of your day’s exertion on your body. A strenuous workout creates a high strain; a sedentary day creates a low one. The algorithm also considers your heart rate reserve—how close you pushed your heart to its maximum—which is a more personalized measure of intensity than simply counting steps.
The Critical Link to Readiness
This is where the feedback loop closes. Yesterday’s Activity/Strain score is a primary input for today’s Readiness/Recovery score. The algorithm essentially asks: "Given how much this person exerted themselves yesterday, and given the quality of recovery they achieved last night, how much capacity do they have for new strain today?" If you had a massive strain day followed by poor sleep (low HRV, high RHR), your readiness will plummet, advising a light day. If you had a moderate strain day and excellent recovery, your readiness will be high, green-lighting another solid effort.
This creates a powerful system for balance. It prevents the common trap of chronic, unvaried training without adequate recovery, which leads to plateaus and injury. It encourages strategic periodization, even for non-athletes, promoting the idea that rest days are not lazy days but an essential component of a productive, healthy life.
We now arrive at the crucible where data transforms into insight: the proprietary algorithm. This is the secret sauce, the "brain" of the system. It’s not a simple formula like (Sleep Score + HRV) / 2. It is a complex, adaptive machine learning model, often trained on massive datasets of biometric information correlated with outcomes like performance, illness, and subjective well-being.
Personal Baselines: You vs. You
The first and most critical task of the algorithm is to establish your normal. What is a typical HRV for you? What is your usual deep sleep percentage? What does your temperature curve look like on a good night? Over a period of weeks, the system learns these personal baselines. This is vital because comparing you to population averages is meaningless. A HRV of 45 might be low for one person and high for another. The score is based on deviations from your own baseline, making it deeply personal.
Weighting and Synthesis
The algorithm assigns dynamic weights to the various inputs (sleep, HRV, RHR, temperature, activity) based on their relative importance and reliability at any given time. For instance:
The Output: More Than a Number
The final readiness score is the output of this synthesis. But the best platforms provide the "why" behind the number. They might say: "Score lowered due to elevated resting heart rate and low deep sleep," or "Score is high because of excellent sleep balance and strong HRV." This explanatory layer is what turns a cryptic digit into an actionable insight, fostering true body literacy and moving users toward a more intentional, restful living diet with foods that calm your nervous system when the data suggests it’s needed.
The technology inside your ring is not static. The next generation of sensors promises to deepen the understanding of your readiness by tapping into entirely new layers of biochemistry.
Electrodermal Activity (EDA) or Galvanic Skin Response (GSR)
This sensor measures tiny, imperceptible changes in the skin’s electrical conductivity, which increase when you sweat—even minimally. Sweat gland activity is directly controlled by the sympathetic nervous system. Therefore, EDA is a pure, direct measure of acute stress or emotional arousal. Imagine your ring detecting subtle stress spikes during a work meeting, a difficult conversation, or even during specific phases of sleep (linking dreams to emotional processing). Integrating this sympathetic "stress signal" with the parasympathetic "recovery signal" of HRV would create a complete, real-time map of your ANS balance.
Blood Oxygen Saturation (SpO₂)
Already present in some rings using red and infrared PPG sensors, continuous SpO₂ monitoring is moving beyond sleep apnea detection. Nocturnal dips in blood oxygen (even mild ones) can indicate breathing irregularities that disrupt sleep architecture and strain the cardiovascular system, impacting recovery. Tracking this trend over time adds another dimension to sleep quality assessment.
The Horizon: Non-Invasive Glucose and Lactate Monitoring
The holy grail of wearable sensing is non-invasive, continuous biomarker tracking. Research is advancing rapidly on using optical (PPG) and spectroscopic sensors to estimate glucose levels or lactate from interstitial fluid. For readiness, this would be revolutionary. Glucose variability is a key marker of metabolic health and energy stability. Lactate is a direct metabolite of exertion and stress. Integrating real-time metabolic data would allow the algorithm to understand not just if you are stressed, but the metabolic cost of that stress, refining recommendations for nutrition and activity timing with unprecedented precision.
These advancements will blur the line between wellness tracking and clinical-grade health monitoring, empowering users with a depth of self-knowledge previously confined to laboratories.
With such powerful technology, it’s easy to fall into the trap of data worship. It is crucial to understand the limitations and maintain a healthy relationship with your score.
It's a Proxy, Not a Diagnosis
The readiness score is derived from physiological proxies of your state. It infers internal processes from external signals. It cannot diagnose specific diseases, nutrient deficiencies, or hormonal imbalances. An elevated temperature suggests inflammation but cannot tell if it’s from an infection, an autoimmune condition, or a muscle tear.
The "Unknown Unknowns" and Mental Health
The sensors are physical. They cannot directly quantify psychological or emotional states that don’t manifest strongly in physiology. You could be grieving, anxious, or creatively blocked while maintaining a perfect physiological score. Conversely, the joy of a passionate project or deep connection might not fully register as "recovery" in the algorithm’s ledger. Your score is a guide, not a gospel. It must be integrated with your subjective feelings. As explored in our piece on how restful living improves relationships and mood, true well-being encompasses dimensions beyond physical biomarkers.
Data Accuracy and Environmental Noise
No sensor is perfect. PPG signals can be corrupted by poor fit, very cold fingers, or excessive motion. Temperature readings are influenced by ambient conditions. Algorithms make statistical best guesses for sleep stages—they are not a polysomnogram. It’s important to look at trends over days and weeks, not to over-interpret a single night’s potentially noisy data.
The Risk of Orthosomnia
A paradoxical side effect of sleep tracking is "orthosomnia"—an unhealthy preoccupation with achieving perfect sleep data, which in itself creates anxiety and ruins sleep. Becoming obsessed with chasing a high readiness score can become a source of stress, defeating its very purpose. The score should liberate you, not enslave you. It’s a tool to support a broader philosophy of wellness, which sometimes means ignoring it and listening to your intuition—a concept aligned with the principles of how minimalism enables restful living by reducing clutter, both physical and digital.
The ultimate value of any technology lies not in the information it provides, but in the behavioral change it inspires. A readiness score is useless if it doesn’t alter how you live. The final step in the technological journey is the human step: integration.
The Feedback Loop in Action
The most powerful feature of these systems is the immediate, personal feedback loop they create. You have a late, heavy meal and notice your RHR is elevated and your readiness drops. You try a mindfulness app before bed and see your deep sleep increase. You take a rest day when your score is low and come back feeling stronger. This loop builds self-efficacy—the belief that your actions directly impact your state. It moves health from an abstract concept to a tangible, daily experiment.
Context is King: Journaling and Tagging
Advanced platforms allow you to add context through journaling or tags. Did you drink alcohol? Have a high-stress day? Start a new medication? By logging these events, you help the algorithm (and yourself) see causal relationships. You might discover that two glasses of wine tank your HRV more than a hard workout, or that your afternoon coffee consistently fragments your sleep. This turns the ring into a personal science lab.
Actionable Insights, Not Just Alerts
The best guidance is prescriptive, not just descriptive. Instead of "low HRV," the system might suggest: "Consider a light walk instead of intense training today," or "Your data suggests elevated stress; try a 10-minute breathing exercise." This bridges the gap between knowing and doing. It aligns with creating a restful living travel guide for maintaining calm on the go, providing tailored, contextual recommendations for any environment.
The Long Game: Building Sustainable Habits
The true transformation happens over months and years. The readiness score becomes a compass for building a lifestyle that inherently supports recovery and resilience. It teaches you the unique rhythms of your body, helping you design your weeks for sustainability, prioritize sleep without guilt, and understand the true cost of your choices. This long-term behavior change, guided by continuous biometric feedback, is the promise of the technology fully realized—not just a score on your phone, but a profound, enduring upgrade to how you live, work, and thrive.

The promise of a readiness score is no longer confined to a single device. A competitive landscape has emerged, with major players like Oura Ring, Whoop, Garmin, and Apple each offering their own interpretation of recovery and readiness. While the underlying principles of biometric sensing are similar, the philosophy, algorithm focus, user experience, and presentation of data differ significantly. Understanding these nuances is key to choosing the tool that best aligns with your lifestyle and goals.
The Ring vs. The Strap vs. The Watch: Form Factor Philosophies
The choice of form factor is the first and most obvious differentiator, and it dictates the primary use case.
Algorithmic Personalities: How Scores Are Calculated
While all use similar inputs, the weighting and presentation vary:
Choosing Your Tool: Lifestyle as the Deciding Factor
The "best" device is the one you’ll wear consistently and whose data presentation resonates with you.
Ultimately, these platforms are not just selling hardware; they are selling a philosophy of self-management. Your choice reflects whether you see your well-being through the lens of recovery, performance, or integrated daily living.
Your readiness score doesn't exist in a vacuum. It pulses to the rhythm of a deep, ancient biological metronome: your circadian rhythm. This approximately 24-hour internal clock, governed by a master pacemaker in the brain called the suprachiasmatic nucleus (SCN), orchestrates nearly every physiological process—from hormone release and metabolism to cell repair and cognitive function. The most advanced readiness algorithms don't just track sleep; they implicitly assess how well your lifestyle is synchronized with this rhythm, as misalignment is a primary thief of recovery.
Light: The Prime Zeitgeber
The most powerful cue for your circadian clock is light, specifically blue-wavelength light detected by intrinsically photosensitive retinal ganglion cells (ipRGCs) in your eyes. Morning sunlight signals the SCN to suppress melatonin (the sleep hormone), elevate cortisol (for wakefulness), and raise core body temperature. Evening darkness prompts the reverse. Your readiness is profoundly impacted by your light exposure patterns. Consistent, bright light in the morning strengthens your circadian signal, leading to more stable energy, better sleep onset, and improved mood. Conversely, excessive blue light from screens at night delays melatonin release, fragmenting sleep and dampening next-day readiness—a topic deeply connected to the principles of how digital detox enhances restful living.
Temperature, Feeding, and Activity: Supporting Cues
While light is dominant, other behaviors provide secondary timing cues:
Circadian Disruption: The Readiness Score Killer
When your external behaviors conflict with your internal clock, you experience circadian misalignment. This is the state of "social jet lag" experienced by shift workers or those with highly irregular schedules. The consequences are severe: dysregulated cortisol, impaired glucose metabolism, suppressed immune function, and poor sleep. Your readiness algorithm sees this as a fundamental state of physiological disorder. You may see:
Using Your Data for Synchronization
Your smart ring is a powerful tool for circadian alignment. By tracking your body temperature minimum (typically a few hours before waking) and your sleep/wake consistency, it can help you identify your natural chronotype. You can then use this data to strategically time light exposure, meals, and demanding work. For instance, if your data shows you consistently fall asleep late and have a late temperature minimum, you might be a natural "night owl" and can schedule your most demanding cognitive tasks for the afternoon rather than forcing a 6 a.m. workout. Honoring this rhythm, rather than fighting it, is a profound act of self-care that turns your readiness score from a report card into a compass for living in time.
You cannot out-track a poor diet. The food and fluid you consume are the literal building blocks for recovery and the substrates for all cellular energy. Your readiness score is acutely sensitive to nutritional choices, as they directly modulate the very biomarkers the sensors are measuring: inflammation, nervous system balance, and metabolic stress.
Nutritional Impact on Core Metrics
Hydration: The Silent Partner in Readiness
Water is the medium for every biochemical reaction. Even mild dehydration (a 1-2% loss of body water) has measurable effects:
The Readiness Score as a Dietary Feedback Tool
This is where the technology becomes a powerful coach. By logging meals or simply observing correlations, you can use your readiness data to identify food sensitivities or suboptimal habits. Did your score plummet after a night of pizza and beer? Did it soar after a day of clean, whole foods and ample water? This biofeedback turns nutrition from a theoretical pursuit into a personal experiment. It moves beyond calories and macros to how food makes your system feel as measured by your nervous system and inflammatory response. This empirical approach aligns perfectly with crafting the restful living diet focused on foods that calm your nervous system, using data to personalize nutritional choices for optimal recovery.
Your mind writes checks that your body must cash. Psychological stress, anxiety, and mental fatigue are not abstract concepts to a readiness algorithm; they are physiological events with concrete signatures. The bridge between mind and body is the autonomic nervous system and the hypothalamic-pituitary-adrenal (HPA) axis, and your smart ring is effectively listening in on that conversation.
The Physiology of a Stress Response
When you perceive a stressor—a looming deadline, a difficult conversation, even persistent worry—your amygdala sounds the alarm. This triggers a cascade: the sympathetic nervous system activates (the "fight-or-flight" response), and the HPA axis releases cortisol and adrenaline. The physical results are exactly what your sensors detect:
Acute vs. Chronic Stress: The Biometric Signature
The Ring as a Stress Detector and Interruption Tool
This is where next-generation sensors like EDA/GSR will shine, directly measuring sympathetic arousal. But even current technology is revealing. You might see a noticeable spike in your live heart rate during a stressful meeting or while watching an intense film. Observing this objective data can be the first step in interrupting the stress loop. It provides a moment of mindfulness: "My body is reacting. I need to breathe."
Furthermore, the ring can validate the effectiveness of your stress-management techniques. After a 10-minute meditation or a walk in nature, does your heart rate drop and your HRV increase? This positive feedback reinforces the behavior, turning stress management from a vague good idea into a data-validated strategy. It proves that activities which feel restorative actually are, on a physiological level, building a case for their non-negotiable place in your schedule. This holistic view supports the broader connection between restful living and longevity, where managing daily stress is a key pillar of long-term health.
The daily readiness score is the headline, but the true gold lies in the longitudinal trends and patterns within your data. Becoming fluent in this language allows you to move from reactive adjustments to proactive life design. The goal is to stop being surprised by a low score and start predicting it—and preventing it.
Establishing Your Personal Baselines and Zones
The first rule of personal biometrics: forget population averages. What matters are your normal ranges.
Key Patterns to Analyze
Identifying Positive and Negative Feedback Loops
The Role of the Monthly View
The monthly aggregate view is where you assess balance. Did you have more "green" recovery days than "red" ones? Was your average sleep duration adequate? This macro view helps answer the question: Is my lifestyle sustainable? It moves the focus from daily performance to long-term health maintenance, ensuring you are not constantly withdrawing from your physiological bank account without making deposits. This kind of pattern analysis is the analytical backbone of a sustainable approach, much like the weekly restful living plan that provides structure for sustainability.
As we invite these devices deeper into our lives, collecting the most intimate data possible—our body's uninterrupted story—we must pause to consider the implications. The era of the "Quantified Self" brings tremendous power for personal optimization, but it also raises profound questions about privacy, dependency, and the very definition of health.
The Data Privacy Paradox
Your biometric data is uniquely you—a fingerprint of your physiology. This data stream, stored in the cloud, is incredibly valuable. While companies have strict privacy policies, the potential for misuse exists, from targeted advertising based on your stress levels to more concerning scenarios like insurance or employment discrimination if this data were ever linked to your identity. Users must be vigilant about understanding what data is collected, how it is anonymized and aggregated, and who truly owns it. The ethical burden is on companies to be transparent and to treat this data not as a commodity, but as a sacred trust.
Psychological Dependency and Data Anxiety
The risk of "orthosomnia" with sleep data can expand into a general biometric anxiety. An over-reliance on the score can lead to distrusting one's own bodily sensations ("I feel fine, but my score is low, so I must be wrong"). It can create a compulsive need to "hack" every metric, turning life into a relentless optimization project that ironically increases stress. Health becomes a number to game rather than a subjective state of well-being. The technology must be framed as a tool for empowerment and awareness, not as an external authority that overrides internal wisdom.
The Future: Predictive Health and Personalized Medicine
This is the most exciting and ethically complex frontier. As algorithms improve with larger datasets and longer individual histories, their role will shift from descriptive to predictive. Imagine your readiness platform sending an alert: "Your biometric patterns over the last 48 hours show a 70% correlation with the onset of prior respiratory infections. Consider resting and boosting immune support." Or: "Your HRV trend suggests you are optimally recovered for a peak performance attempt in the next 3 days."
This moves wearables from wellness gadgets into the realm of preventive healthcare. It could enable truly personalized medicine, where lifestyle, environment, and biometrics are integrated to provide hyper-individualized recommendations for everything from medication timing to behavioral therapy. The line between consumer electronics and medical devices will blur, necessitating new regulatory frameworks and validation standards.
The Ultimate Goal: A Qualified Life
The promise of this technology is not to turn us into obsessed data scientists of our own bodies, but to use data to qualify our lived experience. It should help us identify what truly brings us vitality, resilience, and joy—and what drains it. It should provide the feedback needed to build a life that naturally supports high readiness, not one that requires constant monitoring and correction. The data should serve the life, not the other way around. In doing so, it supports a holistic vision of health where technology facilitates deeper connection to self, enabling the energy and presence required for meaningful relationships and improved mood through restful living. The ring on your finger is not the end goal; it is the compass pointing you toward a richer, more attuned, and truly qualified life.
The true test of any technology is its application in the messy, unpredictable reality of daily life. Readiness scores are not theoretical constructs; they are practical tools for navigating specific challenges. By examining how different archetypes use this data, we move from general principles to actionable strategy.
Case Study 1: The Endurance Athlete – Periodization and Overtraining Avoidance
*Meet Alex, a 38-year-old amateur marathoner training for a personal best.* For Alex, the readiness score is the central dashboard for her training plan. Her coach’s prescribed workouts are no longer static on a calendar; they are dynamic inputs that get a daily “go/no-go” signal from her body.
Case Study 2: The Tech Executive – Managing Cognitive Load and Preventing Burnout
*Meet Ben, a 45-year-old CTO at a scaling startup.* Ben’s stress isn’t physical; it’s relentless cognitive and emotional load—back-to-back meetings, critical decisions, and team management. His readiness score is a buffer against burnout.
Case Study 3: The New Parent – Navigating Sleep Deprivation and Sustaining Energy
*Meet Chloe, a 32-year-old mother of a 6-month-old.* For Chloe, a perfect 8-hour sleep block is a distant memory. Her use of readiness technology is about optimizing within constraint, not achieving ideal scores.
These cases illustrate that the readiness score is not a one-size-fits-all metric. Its intelligence lies in its personalization. It provides a common language—a physiology-first language—for discussing strain and recovery across vastly different life contexts, from the track to the boardroom to the nursery.

Your smart ring is a powerful node in your personal health network, but it is not the only one. Its true potential is unlocked when its data is correlated and integrated with other streams of health information. This creates a multidimensional picture far greater than the sum of its parts.
Blood Biomarkers & Lab Work: The Internal Chemistry Set
Readiness metrics show how your system is functioning; blood tests often reveal why. Combining them is transformative.
Nutrition & Macronutrient Tracking Apps
Apps like Cronometer or MyFitnessPal provide a log of inputs (food). Your readiness score provides a log of outcomes (physiological response). Correlating the two moves nutrition from guesswork to science.
Menstrual Cycle & Hormonal Tracking
For women, this integration is particularly powerful. The menstrual cycle is a powerful hormonal rhythm that dramatically influences core readiness metrics.
Fitness Equipment & Other Wearables
Gym equipment with heart rate monitoring, cycling power meters, and running power meters provide external performance outputs. Your readiness score provides the internal context for that performance.
By building this ecosystem, you become the CEO of your own health, with dashboards (readiness scores, blood work) and operational reports (nutrition logs, workout data) all informing a cohesive strategy for sustainable performance and well-being. It’s a comprehensive approach that embodies the principles of restful living through the seasons, adapting your approach, but applied to your internal biochemical and hormonal seasons.
Human beings are social creatures, and our behaviors are profoundly influenced by those around us. The latest evolution in readiness technology is the move from purely personal data to shared, community-oriented platforms that add accountability, support, and collective intelligence.
The Rise of Social Fitness and Recovery Platforms
Platforms like Strava transformed solo running into a social experience. Whoop has its “Whoop Groups,” and Oura has community challenges. These features allow you to share (anonymously or with selected peers) your strain, recovery, and sleep data.
Professional Coaching Integration
For athletes and high-performers, the real power is granting a coach access to your readiness dashboard. This creates a dynamic coach-athlete relationship based on objective data, not just subjective “how do you feel?” reports.
Research and Population Health
Anonymized, aggregated readiness data from millions of users is a treasure trove for scientific discovery. Companies can conduct large-scale observational studies on topics like:
The Caveat: Comparison and Social Anxiety
The social layer comes with risks. Just as social media can induce anxiety through comparison, seeing a friend’s perpetually “green” recovery score while yours is “red” can be demoralizing. It’s crucial to remember the first rule: this is you vs. you. The community should be a source of inspiration and support, not another arena for competition that increases stress. The goal is collective elevation, not individual ranking. Used wisely, the social layer transforms the readiness journey from a solitary pursuit into a shared path toward resilience, leveraging our innate social nature to reinforce positive habits.
Armed with knowledge of the technology, its interpretation, and its integration, we now arrive at the synthesis: creating a sustainable, personalized protocol. This is not a rigid set of rules, but a flexible framework of habits and responses informed by your data.
Phase 1: The Observation Month (Weeks 1-4)
Phase 2: The Experimentation Phase (Weeks 5-12)
Phase 3: The Refinement & Automation Phase (Ongoing)
This protocol turns your readiness score from a passive metric into an active management system. You are no longer a passenger in your health; you are the pilot, with a sophisticated instrument panel guiding your decisions through both calm skies and turbulent weather.
The journey of the readiness score—from photonic signals in a capillary to a simple number guiding daily choices—represents something far larger than a feature of wearable tech. It signifies a pivotal shift in the human relationship with health: the democratization of deep physiological intelligence.
For centuries, advanced insight into the body’s inner state was the exclusive domain of medicine, accessed only in moments of crisis through infrequent, expensive tests. Today, that insight is continuous, personal, and accessible. The smart ring and its readiness algorithm are part of a broader movement putting the tools of self-knowledge directly into the hands of individuals. We are moving from a model of sick care—intervening when things break—to a model of true health care: the ongoing, daily optimization of the complex system that is a human life.
This technology empowers a new form of body literacy. We are learning to read the language of our nervous system through HRV, understand the story of our metabolism through temperature trends, and appreciate the architecture of our restoration through sleep staging. This literacy fosters agency. It replaces vague feelings of “being rundown” with specific, actionable insights: “My nervous system is unbalanced, I need parasympathetic support.”
The path forward is bright and inevitable. Sensors will become more sophisticated, measuring metabolites like glucose and lactate. Algorithms will become more predictive, offering not just a report on yesterday but a forecast for tomorrow. Integration will become seamless, with your readiness data quietly informing your smart home lighting, your calendar scheduler, and even your connected kitchen. The line between wellness and clinical medicine will continue to blur, with this data providing crucial context for doctors and enabling truly personalized preventive strategies.
But amidst this exciting future, the core principle must remain: Technology in service of humanity. The goal is not a perfect score. The goal is a qualified life—a life of sustained energy, resilience, presence, and purpose. The readiness score, at its best, is a compass guiding us back to the fundamental practices that have always sustained humans: restful sleep, nourishing food, meaningful movement, managed stress, and deep connection. It modernizes the ancient wisdom of listening to our bodies.
It invites us to build a life where high readiness is not something we extract from ourselves through force, but a natural state that emerges from living in alignment. It is the technological partner to a philosophy of restful living for high achievers seeking performance through rest, and indeed, for anyone seeking to thrive in our demanding world. The ring on your finger is more than a device; it is a reminder that the most sophisticated technology for health optimization has always been, and will always be, the human body itself. Our job is now to listen to it—with unprecedented clarity—and have the wisdom to respond.
Your Trusted Sleep Advocate: Sleep Foundation — https://www.sleepfoundation.org
Discover a digital archive of scholarly articles: NIH — https://www.ncbi.nlm.nih.gov/
39 million citations for biomedical literature :PubMed — https://pubmed.ncbi.nlm.nih.gov/
Experts at Harvard Health Publishing covering a variety of health topics — https://www.health.harvard.edu/blog/
Every life deserves world class care :Cleveland Clinic - https://my.clevelandclinic.org/health
Wearable technology and the future of predictive health monitoring :MIT Technology Review — https://www.technologyreview.com/
Dedicated to the well-being of all people and guided by science :World Health Organization — https://www.who.int/news-room/
Psychological science and knowledge to benefit society and improve lives. :APA — https://www.apa.org/monitor/
Cutting-edge insights on human longevity and peak performance:
Lifespan Research — https://www.lifespan.io/
Global authority on exercise physiology, sports performance, and human recovery:
American College of Sports Medicine — https://www.acsm.org/
Neuroscience-driven guidance for better focus, sleep, and mental clarity:
Stanford Human Performance Lab — https://humanperformance.stanford.edu/
Evidence-based psychology and mind–body wellness resources:
Mayo Clinic — https://www.mayoclinic.org/healthy-lifestyle/
Data-backed research on emotional wellbeing, stress biology, and resilience:
American Institute of Stress — https://www.stress.org/

