Health Metrics Explained: The Connection Between All Metrics
Explaining how different health metrics are interconnected.
Explaining how different health metrics are interconnected.
You wake up feeling… off. Not sick, not injured, just not quite yourself. You check your phone. Your smart ring says you slept 8 hours but gives you a low recovery score. Your heart rate variability is down, your resting heart rate is slightly elevated, and your sleep graph looks choppy. Individually, these are just numbers. Together, they tell a story—a story your body has been whispering all night, and is now shouting at you in the cold light of day.
Welcome to the modern frontier of understanding health: the interconnected world of biometrics. We are no longer limited to a single annual check-up snapshot. We have access to a continuous, streaming narrative of our physiology. But this avalanche of data—heart rate, HRV, SpO2, temperature, sleep stages, activity levels, stress scores—often feels like a cacophony of disjointed signals. What does it all mean? More critically, how do these metrics talk to each other?
This article is your decoder ring. We are moving beyond isolated data points to explore the grand, interconnected system that is your health. We’ll unravel how a poor night’s sleep doesn’t just make you tired—it can raise your resting heart rate, tank your HRV, impact your body temperature, and set you up for a day of poor metabolic function. We’ll explore how stress isn’t just a feeling; it’s a physiological cascade that disrupts your nervous system, fragments your sleep, and leaves a fingerprint on nearly every other metric you track.
Think of your body not as a collection of separate gauges, but as a symphony orchestra. The heart is the percussion, the nervous system is the conductor, your metabolism is the string section, and your sleep is the rehearsal space where the entire ensemble prepares. A discordant note in one section ripples through the entire performance. By understanding the connections, you learn to listen to the music, not just hear individual instruments.
This journey into the connected self begins here. We’ll build a foundational understanding of the core metric families, then delve deep into the specific, powerful dialogues between them. This knowledge transforms your wearable from a simple tracker into a true health interpreter, empowering you to make sense of your body’s complex language and take action that resonates across your entire system.

For decades, we’ve assessed health in silos. A blood pressure reading at the doctor’s office. A cholesterol score from a lab slip. A step count on a pedometer. This fragmented approach is akin to trying to understand the plot of a film by examining a single, random frame. You might see an expression, a color, a prop, but you have no context for the narrative arc, the character’s motivation, or the cause of the emotion.
The human body is a dynamic, closed-loop system of breathtaking complexity. Every process is interconnected, regulated by feedback loops and governed by central systems like the autonomic nervous system (ANS) and the endocrine system. A change in one variable is never an isolated event; it is a signal sent through the entire network.
Consider a simple, real-world example: You have a stressful work deadline (psychological input). This triggers your sympathetic nervous system (“fight or flight”) to release cortisol and adrenaline (hormonal output). These hormones cause your heart rate to rise (cardiovascular effect), your breath to become shallow (respiratory effect), and your blood vessels to constrict, potentially raising your blood pressure (vascular effect). That night, this heightened sympathetic tone makes it hard to fall asleep and reduces deep sleep (sleep architecture effect). The lack of deep sleep impairs glucose metabolism and growth hormone release (metabolic/endocrine effect), leaving you craving sugar the next day (behavioral effect) and perpetuating a cycle of elevated stress and poor recovery.
If you only looked at your elevated resting heart rate the next morning, you might blame it on caffeine. If you only saw the poor sleep score, you might blame a noisy environment. You’d be treating symptoms, not the root cause that cascaded through your entire system.
The promise of modern wearable technology, especially advanced devices like smart rings that capture data 24/7, is to reveal these connections. They allow us to see the patterns and correlations that were previously invisible. By moving from a reductionist view (breaking things down to their parts) to a systems view (understanding how the parts interact), we gain a profoundly more accurate and actionable picture of our health.
This foundational concept of interconnectedness is the lens through which we will examine all subsequent metrics. It’s the reason why chasing a single number—10,000 steps, 8 hours of sleep, a specific HRV score—can be futile or even counterproductive. True wellness optimization is about harmonizing the system, not maxing out a single dial.
If your body is a symphony, the Autonomic Nervous System (ANS) is the conductor. It’s the unconscious control center regulating everything from your heartbeat and digestion to your breath and temperature. The ANS has two primary branches engaged in a constant, delicate dance:
Health isn’t about having one system dominate; it’s about having high tonal balance—the ability for each system to activate strongly and appropriately in response to life’s demands, and then return to a harmonious baseline. This is where Heart Rate Variability (HRV) enters as our most powerful window into this dance.
HRV is not your heart rate. While heart rate measures the average number of beats per minute, HRV measures the tiny, millisecond variations in the time intervals between each heartbeat. If your heart beat like a metronome (highly regular, low HRV), it would indicate a stressed, rigid system stuck in sympathetic dominance. A healthy, resilient heart, under the nuanced control of both ANS branches, has subtle, moment-to-moment variations (higher HRV).
A higher HRV generally indicates greater parasympathetic (restorative) tone and better autonomic flexibility—your body can adapt to stress efficiently and recover powerfully. A lower HRV suggests sympathetic dominance, potential system-wide stress, fatigue, or illness.
Why HRV is the Keystone Metric: HRV doesn’t exist in a vacuum. It is the integrated output of nearly everything happening in your body and mind. It is exquisitely sensitive to:
Therefore, HRV is less a standalone metric and more a master summary of your system’s current state of balance and readiness. It’s the first sign that something is amiss, often before you feel symptoms. By watching HRV and understanding what influences it, you’re essentially listening to the conductor’s baton, which directs the entire orchestra of your health.
Sleep is not a blank, passive state. It is an active, highly structured physiological process essential for system-wide repair and regulation. "Sleep architecture" refers to the cyclical pattern of sleep stages we move through each night: Light Sleep (N1 & N2), Deep Sleep (N3, or Slow-Wave Sleep), and REM (Rapid Eye Movement) Sleep. Each stage has a distinct purpose, and disrupting this architecture has cascading effects.
A healthy sleep cycle involves progressing smoothly through these stages in 90-120 minute cycles, with deep sleep dominating the first half of the night and REM sleep dominating the latter half. Sleep quality, therefore, is not about time in bed, but about the continuity and balance of this architecture. Waking up frequently, sleep apnea events, or lifestyle factors that fragment sleep prevent you from completing these vital restorative cycles.
The Systemic Ripple Effect of Poor Sleep:
When sleep architecture is disrupted, the consequences echo through every other health metric:
Tracking sleep with a device that measures movement, heart rate, and heart rate variability (like a smart ring) allows you to move beyond simple duration. You can see sleep latency (time to fall asleep), awakenings, and estimate time in different stages. This data is the first chapter in understanding your next day’s HRV, energy, and metabolic responses.
Your heart is the tireless percussion section of your bodily symphony, and its baseline rhythm tells a vital story. Resting Heart Rate (RHR)—the number of times your heart beats per minute while you are completely at rest, typically during sleep or upon first waking—is a deceptively simple metric with profound implications.
A lower RHR (generally, for adults, between 50-70 bpm, with fit individuals often lower) typically indicates greater cardiovascular fitness and stronger parasympathetic tone. Your heart is more efficient, pumping more blood with fewer beats. A trend of elevated RHR, especially your nighttime or waking RHR, is a bright red flag from your ANS. It signifies that your body is under some form of stress, working harder even at rest. Common culprits include:
RHR and HRV have an intimate, inverse relationship. As your body enters deep recovery (high parasympathetic tone), your RHR drops and your HRV generally rises. When stressed (high sympathetic tone), your RHR climbs and your HRV falls. Watching these two metrics together provides a far more nuanced picture than either alone.
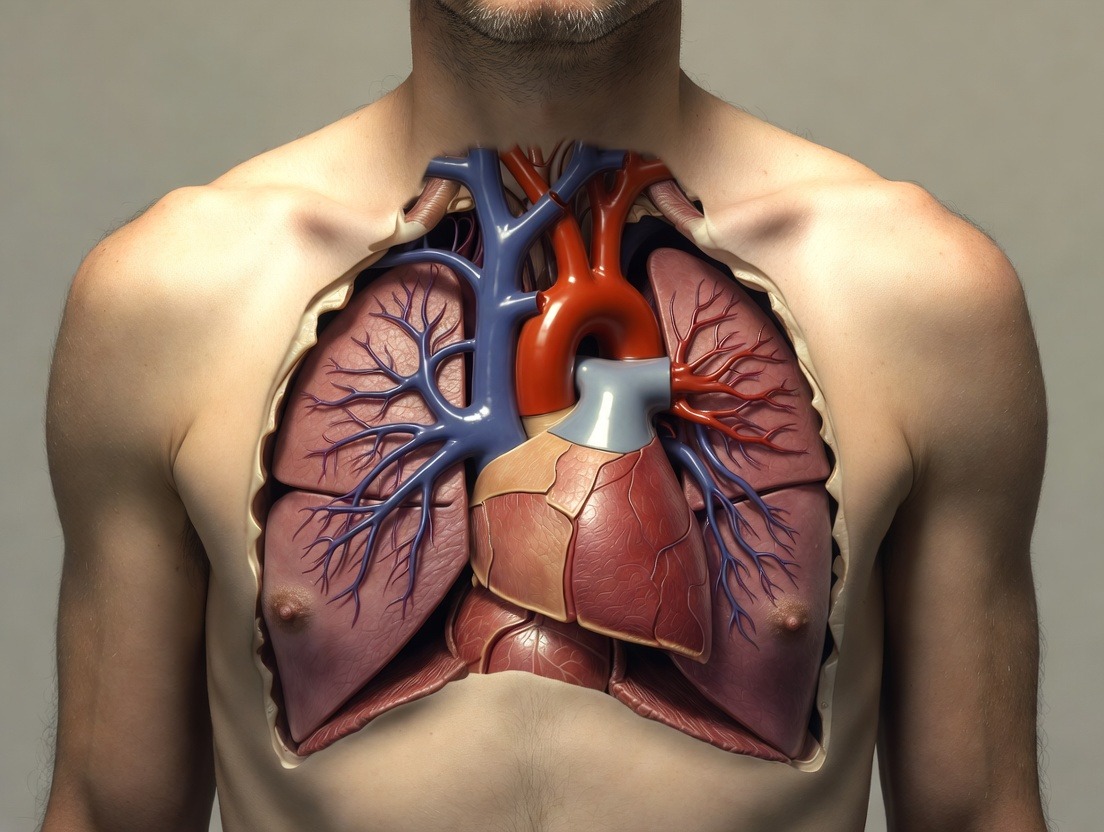
Blood Oxygen Saturation (SpO2) measures the percentage of oxygen-carrying hemoglobin in your blood. At sea level, a normal, healthy reading is 95-100%. While traditionally a clinical metric, continuous SpO2 monitoring from wearables, especially during sleep, is revealing crucial connections.
During sleep, it’s normal for SpO2 to dip slightly. However, frequent or significant nocturnal desaturation (drops below 90-92%) can indicate sleep-disordered breathing, like sleep apnea. These events are not just about snoring; they are moments of acute physiological stress. Each time your breathing pauses, oxygen drops, carbon dioxide rises, and your brain triggers a micro-arousal (often too brief to remember) to restart breathing. This:
Therefore, a low nighttime SpO2 reading is rarely an isolated lung issue. It’s a direct disruptor of sleep, a hammer blow to your ANS, a contributor to elevated RHR, and a downstream risk factor for cardiovascular and metabolic problems. It’s a critical piece of the puzzle for anyone waking unrefreshed despite adequate time in bed, explaining the connection between how you measure sleep quality without a lab and what your body is actually experiencing.
Metabolism is the sum of all chemical processes that sustain life. Two lesser-discussed but profoundly informative metrics that offer a real-time window into this engine are Core Body Temperature and Respiratory Rate.
Core Body Temperature follows a precise circadian rhythm, orchestrated by your brain’s suprachiasmatic nucleus (SCN). It’s typically lowest in the early morning (around 4-6 AM) and highest in the late afternoon or early evening. This rhythm is a master regulator, influencing sleep-wake cycles, hormone release (like cortisol and melatonin), and overall alertness.
Respiratory Rate (RR) is the number of breaths you take per minute. At rest, a typical adult breathes 12-20 times per minute. Like heart rate, it’s not just the number, but the context and variability that matter.
Together, temperature and respiratory rate provide a live feed from your body’s metabolic and respiratory control centers. They connect the dots between your circadian clock, your sleep quality, your stress level, and your overall metabolic efficiency.

In our interconnected model, "stress" is not an abstract feeling. It is a quantifiable physiological event with measurable downstream effects. It’s the sheet music that dictates whether your bodily symphony plays a harmonious melody or a discordant jangle. We can categorize stress into three primary types, all of which converge on the same central systems:
All these stressors are processed, in part, by the Hypothalamic-Pituitary-Adrenal (HPA) axis. This neuroendocrine system responds by releasing cortisol, the primary stress hormone. In acute, short-term doses, cortisol is vital and adaptive. It mobilizes energy, sharpens focus, and modulates inflammation. The problem arises with chronic, dysregulated stress, where the HPA axis becomes imbalanced, leading to erratic or perpetually elevated cortisol rhythms.
The Biometric Footprint of Chronic Stress:
This dysregulation leaves a clear signature across your connected metrics:
Modern wearables attempt to quantify this via stress scores. These are typically composite algorithms that analyze HRV, RHR, sleep data, and sometimes temperature and activity to estimate your nervous system’s load. A high stress score isn't a judgment; it’s a data-driven alert that your system is working hard to maintain balance. It might mean you need more sleep, should opt for a walk instead of a hard workout, or practice breathwork instead of scrolling through news.
Understanding stress as a measurable, systemic phenomenon allows you to move from "I feel stressed" to "My HRV is down 20%, my RHR is up 8 bpm, and my sleep was fragmented—my body is showing me it's under load." This empowers targeted action, like prioritizing strategies that actually work for sleep quality under pressure, to address the root cause, not just the symptom.
In the pursuit of health, activity is a double-edged sword. It is a potent, essential stressor that, when applied correctly, builds resilience (a process called hormesis). When applied incorrectly—through excessive volume, intensity, or poor timing—it becomes a destructive overload that depletes your system. This is where the connection between activity metrics and recovery metrics becomes non-negotiable.
Activity tracking goes far beyond step counts. It encompasses:
The magic—or the breakdown—happens in how this strain interacts with your body’s ability to recover, which is reflected in metrics like HRV, RHR, and Sleep Quality.
The Feedback Loop:
The Concept of Readiness: Advanced wearables now offer Readiness or Recovery Scores. These algorithms synthesize your previous night’s sleep data (quality, duration, SpO2), your ANS metrics (HRV, RHR), and sometimes your recent activity strain to answer a simple, crucial question: How prepared is your body to take on stress today?
A low readiness score isn’t a command to lie on the couch. It’s an insight that your system is allocating resources to repair. On such a day, the most beneficial "activity" might be gentle movement like walking, yoga, or mobility work—or complete rest. Ignoring this signal and pushing through with a high-intensity workout can dig a deeper recovery hole, creating a negative cycle that can take days or weeks to escape. Learning to balance activity with recovery is the art of sustainable fitness and health, ensuring your training supports your life, not derails it.
Every metric we’ve discussed—HRV, RHR, body temperature, cortisol, melatonin, even hunger—follows a natural, roughly 24-hour oscillation called a circadian rhythm. These rhythms are not passive responses to light and dark; they are genetically programmed biological cycles driven by a central "master clock" in the brain (the SCN) and supported by "peripheral clocks" in every organ.
Think of your circadian rhythm as the daily schedule for your bodily symphony. It dictates when the string section (metabolism) rehearses, when the brass (cardiovascular system) should be loudest, and when the entire orchestra needs to be quiet for repair (sleep).
How Circadian Rhythm Orchestrates Your Metrics:
Disruption and Disease: When your lifestyle is misaligned with this innate schedule—through irregular sleep/wake times, eating late at night, excessive blue light exposure after dark, or chronic jet lag—you create circadian misalignment. This is akin to forcing the orchestra to play its energetic finale at 3 AM and its soft lullaby at noon. The result is systemic confusion:
By aligning your habits with your circadian biology—consistent sleep/wake times, morning light exposure, eating within a defined window, dimming lights at night—you strengthen the rhythmic harmony of all your health metrics. Your wearable data becomes smoother, more predictable, and shows stronger, healthier oscillations. You are not fighting your biology; you are conducting it.
Understanding the deep connections between health metrics is one thing. Capturing them accurately, continuously, and comfortably is another. This is where the form factor and technology of a device like the Oxyzen Smart Ring become pivotal. Unlike wrist-worn devices that can be affected by arm movement (leading to "wrist noise"), a ring on your finger provides a stable, proximal location to the palmar arteries, allowing for highly precise photoplethysmography (PPG) sensor readings of heart rate, HRV, and SpO2.
More than just hardware, the true value lies in the advanced analytics that synthesize this 24/7 data stream. Oxyzen’s platform doesn’t just show you isolated graphs of sleep, HRV, and activity. It is designed from the ground up to reveal the connections. It correlates your low HRV with your fragmented sleep from two nights prior. It flags how an evening alcohol drink not only lowered your sleep score but also raised your nighttime heart rate and depressed your next-day readiness. It shows you the direct impact of a late meal on your sleep-onset body temperature.
By wearing a device that captures the full picture—from the nuanced variations in your heartbeat (HRV) to the oxygen saturation in your blood (SpO2) during sleep, your temperature trends, and your activity—you empower its algorithms to act as your personal health interpreter. It translates the complex, interconnected language of your physiology into actionable insights.
For instance, the platform might surface a finding like: "Your deep sleep was 40% lower than your baseline last night. This coincided with a higher nighttime respiratory rate and three SpO2 dips below 92%. This pattern is often associated with disrupted breathing. This likely contributed to your elevated morning RHR and lower readiness score today." This isn't just data; it's a diagnostic clue that connects multiple systems, guiding you towards targeted solutions—like exploring how to measure sleep quality more accurately or consulting a sleep specialist.
The ring becomes the tool that makes the theoretical framework of interconnected health a practical, daily reality. It closes the loop between action and reaction, helping you learn your body’s unique responses and create a personalized, data-informed blueprint for lasting wellness.
Now that we understand the theory, let’s apply it. Imagine opening your health dashboard after a typical week. Here’s how to read it like a pro, looking for connections, not just numbers.
Scenario A: The "Stressed and Running on Empty" Pattern
Scenario B: The "Circadian Disruption" Pattern
Scenario C: The "Metabolic Load" Pattern
By practicing this connected analysis, you move from being a passive collector of data to an active participant in your health. You start to ask better questions: "Did my HRV drop because of my workout, my poor sleep, or that stressful conversation?" The interconnected dashboard holds the answers.
As we embrace this powerful, interconnected view of health metrics, a critical note of wisdom is essential: Data informs, it does not dictate. Wearables provide an objective lens on your physiology, but they are not a complete picture of your health, and they are certainly not a replacement for clinical judgment or your own subjective experience.
Important Limitations to Acknowledge:
The Risk of Orthosomnia: A modern phenomenon called orthosomnia describes an unhealthy preoccupation with achieving perfect sleep data. Becoming anxious because your deep sleep was 10 minutes less than yesterday, or obsessively checking your HRV, directly creates the psychological stress that worsens those very metrics! The goal is to use data to support better choices, not to become a source of neurosis.
Use your data as a guide and a feedback tool, not a gospel. If your readiness score is low but you feel energetic and positive, listen to your body. If you slept poorly according to the ring but wake up feeling refreshed, trust the feeling. The human context—your energy, mood, motivation, and overall sense of well-being—is the ultimate metric. The numbers from your smart ring are there to explain the "why" behind the "how you feel," to reveal hidden patterns, and to empower you with knowledge. They are a map, but you are the traveler. The destination is a life of vitality, balance, and resilience, measured not just in milliseconds of HRV, but in years of well-lived experience.
Beneath the conscious control of the nervous system lies a slower, yet equally powerful, communication network: the endocrine system. This network of glands and hormones acts as the body’s chemical messaging system, regulating metabolism, growth, reproduction, mood, and, crucially, the sleep-wake cycle and stress response. While you can’t directly measure hormones like cortisol, melatonin, or growth hormone with a smart ring, their effects are written clearly across the metrics you can track.
Understanding this hormonal symphony is key to deciphering why you feel and perform differently throughout the day, month, and even year. Your wearable data is the live performance; hormones are the composers writing the score.
Cortisol: The Rhythm of Stress and Energy
Cortisol, often labeled the "stress hormone," is actually the rhythm keeper of your daily energy. Its ideal 24-hour cycle—a sharp peak 30 minutes after waking (the Cortisol Awakening Response or CAR), a gradual decline throughout the day, and a low trough at midnight—is a master regulator of your circadian rhythm.
Melatonin: The Darkness Hormone
Melatonin secretion from the pineal gland is your body’s internal signal for darkness and sleep. Its rise begins in response to diminishing light, peaking in the middle of the night.
Growth Hormone & Testosterone: The Recovery Catalysts
The majority of Growth Hormone (GH) and testosterone release occurs during deep sleep (N3), particularly in the first few sleep cycles of the night. These hormones are fundamental for muscle repair, bone building, fat metabolism, and overall cellular rejuvenation.
Sex Hormones & The Menstrual Cycle: A Monthly Rhythm
For individuals who menstruate, the hormonal fluctuations of the menstrual cycle create a predictable, monthly pattern in biometric data. Progesterone and estrogen rise and fall, influencing core body temperature, metabolism, nervous system tone, and sleep.
By viewing your daily HRV, sleep stages, and temperature data through the lens of these hormonal rhythms, you gain a deeper appreciation for the biological forces shaping your energy, recovery, and mood. It explains why "perfect" habits one day might not yield the same results on another—your internal chemical landscape is constantly shifting. The goal becomes syncing your lifestyle with these rhythms, not fighting against them.
Inflammation is not inherently bad. Acute inflammation is a vital, localized immune response to injury or infection—it’s how you heal a cut or fight a cold. The problem is systemic, chronic, low-grade inflammation. This is a persistent, body-wide state of immune activation that acts like a slow-burning fire, damaging tissues and disrupting normal physiological function. It is a central player in nearly every modern chronic disease, from diabetes and heart disease to depression and Alzheimer's.
While you can’t measure inflammatory markers like C-reactive protein (CRP) with a wearable, chronic inflammation leaves a distinct, interconnected fingerprint across your biometric data. It is often the hidden thread tying together unexplained declines in multiple metrics.
How Chronic Inflammation Disrupts the System:
The Biometric Clues of Elevated Inflammation:
Watch for these correlated patterns in your data:
Lifestyle Levers to Cool Inflammation:
Your biometric data can guide you to intervene. If you suspect inflammation is a culprit:
By learning to read the potential signs of inflammation in your connected metrics, you gain early warning of a systemic imbalance. This allows for proactive, lifestyle-based intervention long before a clinical issue might arise, using your body’s own data to guide you back to a state of calm, efficient function.
Every process in the interconnected system of your body requires two fundamental inputs: water and nutrients. Hydration and nutrition are not just about satisfying thirst or hunger; they are about providing the raw materials and fluid medium for your cardiovascular system, nervous system, metabolism, and cellular repair to function optimally. Their impact is deeply etched into your biometric data.
Hydration: The River of Life
Water is the solvent for biochemical reactions, the medium for blood volume, and essential for temperature regulation. Even mild dehydration (a loss of just 1-2% of body water) can have measurable effects.
Nutrition: The Quality of Fuel
What you eat, and when you eat it, sends direct signals to your hormones, nervous system, and inflammatory pathways.
Using Your Data as a Dietary Feedback Tool:
Your smart ring provides a powerful feedback loop for nutritional experiments.
By paying attention to how hydration and nutrition modulate your cardiovascular and nervous system metrics, you move from following generic dietary rules to creating a personalized nutrition plan that supports your unique physiology and your goals for recovery, performance, and sustained energy.
Your body does not exist in a vacuum. It is in a constant, dynamic exchange with its environment. The data on your wearable isn’t generated in a lab; it’s the real-time output of your physiology interacting with the world. Key environmental factors—light, temperature, noise, and altitude—act as powerful external levers, pulling directly on your internal systems and leaving a clear mark on your biometrics.
Light: The Primary Zeitgeber
Light is the most potent zeitgeber ("time-giver") for your circadian rhythm. The specialized photoreceptors in your eyes (ipRGCs) detect light intensity and, critically, blue light wavelength, sending direct signals to your brain’s suprachiasmatic nucleus (SCN).
Ambient Temperature: The Sleep Catalyst
Your body needs to drop its core temperature by about 1-2 degrees Fahrenheit to initiate and maintain sleep. The ambient temperature of your bedroom is critical for facilitating this.
Noise & Interruptions: The Sleep Fragmenters
Even if you don’t fully wake up, environmental noises—traffic, a partner snoring, a pet—can cause micro-arousals, brief awakenings that fracture sleep architecture. These interruptions prevent you from completing full, restorative sleep cycles, particularly cutting into deep and REM sleep.
Altitude: The Hypoxic Stressor
At higher altitudes, the partial pressure of oxygen is lower. This creates a state of mild hypoxic stress, to which your body must adapt.
By becoming aware of these environmental forces, you shift from being a passive recipient of your data to an active designer of your health context. You can experiment: try blackout curtains and a cool room and watch your deep sleep increase. Wear blue-light blocking glasses after dinner and note if your sleep latency decreases. Your biometrics become the proof, showing you precisely how your environment is shaping your biology, empowering you to create surroundings that support, rather than hinder, your interconnected health.
We’ve explored how physical stressors like exercise, infection, and poor sleep affect your biometrics. But the mind is not a separate entity; it is the most sophisticated and influential part of your interconnected system. Psychological and emotional states—anxiety, rumination, excitement, contentment, grief—are not just "in your head." They are full-body events that initiate powerful physiological cascades, leaving an unambiguous signature in your objective health data. Ignoring this dimension renders any analysis of your metrics incomplete.
The Brain-Body Bridge: How Thoughts Become Physiology
A moment of acute anxiety or a period of chronic worry activates the same hypothalamic-pituitary-adrenal (HPA) axis and sympathetic nervous system ("fight or flight") as a physical threat. The brain perceives a psychological stressor, and the body responds as if it were real:
This is why a day spent in a stressful meeting room can leave your body in a state of physiological exhaustion similar to a day of hard physical labor. Your wearable data will reflect this: elevated daytime and nighttime RHR, suppressed HRV, and increased stress scores.
The Vicious Cycle: Stress -> Poor Sleep -> More Stress
The impact on sleep is particularly profound and recursive. An anxious, racing mind at bedtime makes it impossible for the parasympathetic system to engage. High cortisol blocks melatonin. The result is difficulty falling asleep (long sleep latency) and sleep that is light, fragmented, and lacking in deep, restorative stages. This poor sleep, documented clearly in your sleep data, then reduces your emotional resilience the next day, lowering your threshold for stress and perpetuating the cycle. This is the core of the hidden link between sleep quality and mental health.
Positive States and the "Broaden-and-Build" Effect
The converse is also true. Positive emotional states like gratitude, joy, calm, and social connection stimulate the parasympathetic nervous system and release hormones like oxytocin.
Using Your Data for Mental Awareness, Not Obsession
This is where a nuanced approach is critical. The goal is not to use your low HRV as a source of more anxiety ("My data is bad, so I must be failing"). That is orthosomnia for the nervous system. Instead, use your biometrics as an objective, non-judgmental mirror.
Your smart ring, in this context, becomes a tool for interoceptive awareness—the ability to perceive the internal state of your body. By connecting the subjective feeling of stress with the objective data of a spiking heart rate, you build a more integrated mind-body awareness. You learn that caring for your mental health is not a soft, abstract concept; it is a concrete, measurable necessity for the optimal functioning of your entire interconnected system. The path to better data often runs directly through a calmer mind.
The interconnected system of your body is not static. It evolves dynamically across your lifespan. Aging, in a biological sense, can be viewed as a gradual decline in the resilience and communication efficiency of this system. However, this decline is not a predetermined fate; it is a trajectory that can be significantly modulated by lifestyle. Understanding how the relationships between core health metrics typically change with age provides a powerful framework for proactive, lifelong health optimization.
The Nervous System: Declining HRV & Rising RHR
One of the most well-documented changes is in autonomic nervous system function. From early adulthood onward, there is a general trend of declining Heart Rate Variability (HRV) and a gradual increase in Resting Heart Rate (RHR). This reflects an age-related shift toward a higher sympathetic-to-parasympathetic balance, sometimes called "autonomic aging." The system becomes less flexible, slower to respond to stress, and slower to recover.
Sleep Architecture: The Fragmentation of Rest
Sleep patterns undergo significant changes. Total sleep time and, most notably, the amount of deep sleep (Slow-Wave Sleep) decrease progressively with age. Sleep becomes more fragmented, with more frequent nighttime awakenings and less consolidated sleep periods.
Metabolism & Body Composition: The Sarcopenia Shift
Basal metabolic rate naturally slows, and without intervention, there is a loss of muscle mass (sarcopenia) and an increase in body fat percentage, particularly visceral fat. This shift has cascading effects:
The Resilience Reserve & "Healthspan"
The central theme of aging is a reduction in physiological reserve—the body's buffer to handle stress. A young system can tolerate poor sleep, a rich meal, or a hard workout and bounce back quickly. An older system has a narrower "bandwidth" for error; the same stressors cause a larger and longer-lasting disturbance in metrics like HRV, RHR, and glucose.
Leveraging Data for Healthy Aging:
This knowledge empowers proactive strategies:
By tracking the interconnected metrics over years, you are not just logging data; you are charting the course of your own biological aging process. You gain the evidence to see which habits accelerate the decline of your system’s harmony and which habits preserve it, allowing you to make daily choices that add not just years to your life, but life to your years.
Theoretical understanding is one thing; personal application is another. Your body is unique. While the principles of interconnection are universal, your specific patterns—how your HRV reacts to caffeine, how your sleep affects your next-day RHR, how your temperature shifts with your cycle—are personal. The ultimate power of wearable data lies in building your own Personal Health Connection Map. This is a living document of your body’s unique language.
Step 1: Establish Your Honest Baselines
Before looking for connections, you need to know what’s normal for you. Don't compare to online averages.
Step 2: Conduct Single-Variable Experiments
Now, introduce one change at a time and observe the multi-metric effects over 3-5 days. Keep a simple journal.
Step 3: Look for Delayed and Cumulative Effects
Connections aren't always immediate. Learn to spot the lag.
Step 4: Correlate Subjective Feeling with Objective Data
This is the most important step. Every morning and evening, jot down 2-3 words about your energy, mood, and stress before looking at your data.
Step 5: Identify Your Key Leverage Points
Through your experiments and observations, you will discover your unique leverage points—the habits that, when optimized, create positive ripple effects across your entire system.
Your Map is Your Guide: This Personal Health Connection Map turns abstract knowledge into personal power. It moves you from "I should sleep more" to "When I sleep before 10:30 PM, my HRV averages 15% higher and my productivity the next day is noticeably better." It’s the process of becoming the world’s leading expert on the one subject that matters most: you.
The field of personal biometrics is not standing still. The current state of interconnected tracking, as powerful as it is, is merely the foundation for a coming revolution in personalized, predictive, and preventative health. The wearables of tomorrow will move beyond describing your current state to anticipating future states and providing deeply contextual, actionable guidance. Here’s a glimpse at the horizons we’re approaching.
1. Advanced Multi-Sensor Fusion & New Biomarkers
Future devices will incorporate a broader array of sensors, moving beyond PPG (heart rate) and accelerometers.
2. AI-Powered Predictive Analytics & Personalized Baselines
Static baselines will be replaced by dynamic, AI-generated expectations.
3. Contextual Awareness & Integrated Life Logging
Your wearable will cease to be an island of data. It will integrate with your digital life to add crucial context.
4. From Insights to Automated Actions & Closed-Loop Systems
The final frontier is moving from insight to automated environmental adjustment.
The journey of connected health is leading us toward a future where technology acts as a seamless, intuitive extension of our own self-awareness. It will not replace intuition or medical care but will augment them with a continuous stream of personalized, contextual, and predictive intelligence. The goal remains the same: to give you the knowledge and tools to harmonize the complex symphony of your body, ensuring it performs beautifully not just for a season, but for a lifetime.
Your Trusted Sleep Advocate: Sleep Foundation — https://www.sleepfoundation.org
Discover a digital archive of scholarly articles: NIH — https://www.ncbi.nlm.nih.gov/
39 million citations for biomedical literature :PubMed — https://pubmed.ncbi.nlm.nih.gov/
Experts at Harvard Health Publishing covering a variety of health topics — https://www.health.harvard.edu/blog/
Every life deserves world class care :Cleveland Clinic - https://my.clevelandclinic.org/health
Wearable technology and the future of predictive health monitoring :MIT Technology Review — https://www.technologyreview.com/
Dedicated to the well-being of all people and guided by science :World Health Organization — https://www.who.int/news-room/
Psychological science and knowledge to benefit society and improve lives. :APA — https://www.apa.org/monitor/
Cutting-edge insights on human longevity and peak performance:
Lifespan Research — https://www.lifespan.io/
Global authority on exercise physiology, sports performance, and human recovery:
American College of Sports Medicine — https://www.acsm.org/
Neuroscience-driven guidance for better focus, sleep, and mental clarity:
Stanford Human Performance Lab — https://humanperformance.stanford.edu/
Evidence-based psychology and mind–body wellness resources:
Mayo Clinic — https://www.mayoclinic.org/healthy-lifestyle/
Data-backed research on emotional wellbeing, stress biology, and resilience:
American Institute of Stress — https://www.stress.org/

