Health Metrics Explained: Understanding Baseline vs Current
Understanding your personal normal baseline versus your current state.
Health Metrics Explained: Understanding Baseline vs Current
In the age of quantified self, we are drowning in data yet starving for wisdom. Your smart ring buzzes with a sleep score. Your fitness tracker celebrates a new VO2 max reading. Your health app flashes a resting heart rate trend line. Each data point promises a clue to your well-being, but without context, it’s just noise. The critical, often missing, key that transforms this raw data into actionable intelligence is the understanding of two fundamental concepts: your Baseline and your Current state.
Think of your health not as a static photograph, but as a high-definition, continuously streaming movie. A single snapshot—today’s step count, last night’s heart rate variability—tells you very little. Is that score good or bad? Is that trend alarming or admirable? The answer lies not in universal benchmarks, but in your personal story. Your Baseline is your established, personal normal. It’s the average of you over time, factoring in your unique physiology, lifestyle, and even genetics. Your Current state is the real-time or short-term measurement you see today. The profound insight, the true power of wearable technology, emerges in the gap between them.
This article is your definitive guide to moving beyond generic scores and into the realm of personalized health intelligence. We will deconstruct the most vital health metrics, not through a one-size-fits-all lens, but through the dynamic, revealing relationship between your Baseline and your Current data. By mastering this framework, you’ll learn to listen to what your body is truly communicating, spot meaningful deviations before they become problems, and make lifestyle adjustments that are precisely calibrated for you. This is where data becomes knowledge, and knowledge becomes empowered well-being.
The Philosophy of Measurement: Why Context is Everything
We live in a world obsessed with optimization. We chase eight hours of sleep, 10,000 steps, a resting heart rate below 60. But this blanket approach to health is fundamentally flawed. It assumes we all start from the same place and strive for the same destination. The reality is far more personal, nuanced, and interesting.
Consider two individuals: Maya, a seasoned marathon runner with a lean build, and David, a software developer who focuses on strength training. Maya’s baseline resting heart rate might be 48 BPM. For her, a current reading of 58 BPM could signal fatigue, impending illness, or overtraining. For David, whose healthy baseline is 68 BPM, a current reading of 58 BPM might indicate a dramatic improvement in cardiovascular fitness. The identical number holds opposite meanings. Without the context of a personal baseline, the data is not just useless—it can be misleading.
This is the core philosophy of modern, intelligent health tracking: Individualization over generalization. The most advanced wellness technology, like sophisticated smart rings, is not built to judge you against the population, but to understand you against yourself. It seeks to establish your normal so it can help you identify what is abnormal for you.
This shift represents a move from reactive to proactive health management. Instead of waiting for a metric to cross a red line defined for the "average" person, you become attuned to subtle, early-warning signs that are specific to your body’s language. A 10% deviation from your own baseline in Heart Rate Variability (HRV) is often a more sensitive indicator of stress than your HRV falling below an arbitrary "good" threshold. This personalized context turns your wearable from a simple recorder into a insightful health guardian.
The Cornerstones: Defining Baseline and Current Health Metrics
To build our understanding, we must first lay precise definitions for our two cornerstone concepts. These are not interchangeable terms; they represent different dimensions of your health timeline.
What is a Baseline Health Metric?
Your Baseline is your physiological fingerprint. It is a calculated, stable average of a specific metric over a significant period, reflecting your body’s accustomed state under normal conditions. Think of it as your body’s "home setting."
A robust baseline isn’t established overnight. It requires consistent tracking over weeks, often months, to smooth out daily fluctuations caused by one-off events—a hard workout, a poor night’s sleep, or a celebratory dinner. Modern algorithms in advanced wearables analyze this longitudinal data, filtering out "noise" to identify your true, personalized trend lines.
For example, your baseline sleep quality isn't defined by one perfect night. It's the consolidated story of your typical sleep architecture, efficiency, and restfulness. You can explore what constitutes true sleep quality and how it forms your personal benchmark. This baseline becomes the reference point that makes each night's data meaningful.
Key characteristics of a baseline metric:
Personal & Unique: It has no inherent "good" or "bad" value outside of your own context.
Stable Over Time: It changes slowly, reflecting long-term lifestyle or fitness adaptations.
Requires Historical Data: It is a product of aggregation and pattern recognition.
Provides Context: It is the essential backdrop against which all current data is evaluated.
What is a Current Health Metric?
Your Current metric is the snapshot. It is the measurement of a specific parameter taken over a short period—last night, today, this current hour. It represents your body's immediate state.
This is the data you most commonly interact with: today's step count, last night's sleep duration, your heart rate during this afternoon's walk. Current metrics are dynamic, reactive, and can be volatile. They are directly influenced by your recent actions, environment, and choices.
The critical insight is that a current metric, in isolation, has limited meaning. Its true significance is unlocked only when compared to your established baseline.
Examples:
Current Resting Heart Rate (RHR): 64 BPM.
Your Baseline RHR: 58 BPM.
Interpretation: Your current RHR is elevated by 6 BPM (~10%) above your norm. This deviation prompts the question: "Why?" Potential answers could be dehydration, stress, lack of recovery, or the onset of an illness.
The dialogue between baseline and current is where actionable health intelligence is born. The baseline asks, "What is normal for you?" The current state asks, "What is happening right now?" Together, they answer the most important question: "Is this change meaningful?"
The Dynamic Relationship: How Baseline and Current Data Interact
The interplay between baseline and current metrics is not a simple comparison; it's a dynamic, informative conversation. Understanding this relationship allows you to interpret the story your body is telling. There are several key patterns to recognize.
The "Within Range" Signal: Stability and Homeostasis
When your current metrics consistently hover within a narrow, expected band around your baseline, it is a powerful signal of homeostasis—your body’s ability to maintain internal stability. This is the state of equilibrium we often associate with good health and effective recovery.
For instance, if your baseline HRV is 50 milliseconds with a typical daily fluctuation of ±5 ms, and your current HRV readings for the week are 48, 52, 49, and 51 ms, your body is communicating resilience. It is successfully managing daily stressors (work, light exercise, minor disruptions) without significant physiological strain. This pattern suggests your lifestyle, sleep, and nutrition are well-aligned with your body’s needs. It’s the green light of your personal dashboard.
The Meaningful Deviation: Your Body's Early Warning System
A deviation occurs when a current metric moves outside your typical range. The size, direction, and persistence of this deviation are what give it meaning. A single outlier may be a data glitch or a very acute one-off event. A sustained shift over 2-3 days, however, is your body raising a flag.
Negative Deviations (Current value worsens relative to baseline):
Elevated Resting Heart Rate: A sustained increase of 5-10% above baseline is a classic, research-backed sign of systemic stress. This could be due to overtraining (often called "overtraining syndrome"), insufficient sleep, emotional stress, or dehydration. Your cardiovascular system is working harder just to maintain basic function.
Depressed Heart Rate Variability: A noticeable drop in HRV indicates your autonomic nervous system is tilted toward "fight or flight" (sympathetic dominance), with reduced "rest and digest" (parasympathetic) activity. It’s a subtle sign your recovery resources are depleted.
Positive Deviations (Current value improves relative to baseline): These are the successes to celebrate and analyze.
Resting Heart Rate Trendline Downward: If, over months, you see your baseline RHR gradually decreasing from 65 to 58 BPM, it’s a strong indicator of improved cardiovascular efficiency.
HRV Baseline Creeping Up: A long-term rise in your HRV baseline suggests enhanced resilience and better autonomic nervous system balance, often the result of consistent recovery practices, mindfulness, or improved fitness.
Improved Sleep Scores: Witnessing your baseline sleep score improve over time is concrete evidence that changes to your evening routine, environment, or timing are paying dividends.
The key is to view deviations not as judgments, but as inquiries. Your data is asking: "What changed?" Your job is to become a detective, connecting lifestyle inputs to physiological outputs.
Key Health Metric #1: Heart Rate Variability (HRV) – The Ultimate Baseline Metric
If you could only track one metric to understand your internal state, Heart Rate Variability (HRV) would be a top contender. It is arguably the most sensitive and insightful baseline metric available through consumer wearables.
What HRV Actually Measures (It's Not Your Heart Rate)
Despite its name, HRV is not about the speed of your heartbeat. It measures the precise, millisecond variations in the time intervals between consecutive heartbeats. If your heart beat like a monotonous metronome at exactly 60 BPM (one beat every second), your HRV would be zero. But a healthy heart is dynamically responsive; under the influence of your breath and your autonomic nervous system, the interval between beats is constantly changing.
A higher HRV generally indicates a greater variation between beats, which signals a strong, adaptable autonomic nervous system. Your body can seamlessly shift between expending energy (sympathetic activity) and conserving/recovering (parasympathetic activity). A lower HRV suggests a less adaptable system, often stuck in a state of higher stress or fatigue.
Establishing Your HRV Baseline: Patience is Required
Because HRV is so sensitive, establishing a true baseline is critical. Daily fluctuations are normal and large. One morning you might read 42 ms, the next 55 ms, based on your workout, alcohol intake, or sleep quality. Your baseline is the rolling average that emerges after at least 4-6 weeks of consistent tracking.
Most experts recommend tracking your HRV at a consistent time, typically first thing in the morning after waking, to ensure comparable conditions. Your wearable will use this longitudinal data to calculate your normal range. It will then interpret your current morning HRV reading against that personal benchmark.
Interpreting Current HRV vs. Your Baseline
Current HRV Significantly Above Baseline: This is often a positive sign. It can indicate excellent recovery, successful adaptation to training, effective stress management, or that you are well-rested. Your body is in a state ready for positive stress (eustress).
Current HRV Significantly Below Baseline: This is a strong, personalized signal to pay attention. It suggests your body is under strain. Common causes include:
Physical overreaching or inadequate recovery from exercise.
The personalized nature of this is vital. A "low" HRV of 30 ms might be perfectly normal for one person’s baseline, while a drop from 80 ms to 50 ms for another person, while still in a "good" population range, represents a massive 37.5% decrease—a clear warning sign for them.
Key Health Metric #2: Resting Heart Rate (RHR) – The Steady Sentinel
Resting Heart Rate is one of the oldest and most fundamental vital signs. While simpler than HRV, its relationship between baseline and current states provides incredibly reliable, straightforward insights into your cardiovascular health and daily readiness.
The Physiology of a Lower Baseline RHR
Your baseline RHR is the average number of times your heart beats per minute while you are completely at rest—typically during sleep or upon waking. A lower baseline RHR is generally a hallmark of good cardiovascular fitness. Here’s why: with consistent endurance training, the heart muscle becomes stronger and more efficient. With each beat (stroke volume), it can pump a larger volume of blood. Therefore, it doesn’t need to beat as frequently to supply the body with oxygenated blood at rest.
Watching your baseline RHR gradually decrease over months of consistent training is one of the most gratifying signs of improved fitness. It’s a slow-moving, long-term trend that validates your efforts.
Current RHR as a Daily Readiness Indicator
While your baseline shifts slowly, your current RHR can be a brilliant daily or weekly biomarker. Because it’s less "noisy" than HRV for many people, a sustained deviation is very easy to spot and interpret.
Elevated Current RHR (≥7-10% above baseline): This is a red flag that is hard to ignore. Your body is working harder to perform basic functions. This sustained elevation is a classic indicator of:
Insufficient Recovery: Your body hasn't fully repaired from prior physical stress.
Dehydration: Reduced blood volume makes your heart work harder.
Stress or Anxiety: Chronic sympathetic nervous system activation.
Illness Onset: The body’s inflammatory response to infection increases metabolic rate and heart rate. Many people notice their RHR creeping up 1-2 days before full flu or cold symptoms appear.
The most accurate RHR is captured during deep sleep, when external influences are minimized. Advanced wearables track your nocturnal RHR—the curve of your heart rate throughout the night. A healthy pattern shows a distinct dip, typically reaching its lowest point (your true physiological rest) in the middle of the night.
A disrupted nocturnal RHR curve—one that is flat or elevated—can be an early sign of sleep disorders like apnea, or simply indicate that your body is not entering deeply restorative states. It provides a more nuanced view than a single morning number and is intrinsically linked to your overall sleep quality score and what it truly means.
Key Health Metric #3: Sleep – Where Baseline and Current Tell the Full Story
Sleep is not a monolithic metric. It’s a rich tapestry of duration, architecture, and quality. Understanding your sleep through the baseline vs. current lens is arguably where wearable technology provides its most transformative value, moving far beyond simple duration.
Deconstructing Sleep Architecture: More Than Just Hours
Your baseline sleep profile is a composite of several interconnected metrics:
Sleep Duration: Your typical total sleep time.
Sleep Efficiency: The percentage of time in bed actually spent asleep. A baseline of 90%+ is excellent.
Sleep Stages: Your personal pattern of Light, Deep, and REM sleep. Percentages can vary; what matters is your consistency.
Restlessness/Wake-ups: How many times you typically experience micro-awakenings.
Latency: How long it normally takes you to fall asleep.
A single night of poor sleep is common. But your current data, when compared to this multi-faceted baseline, reveals the depth of the disruption. Did you just get less sleep, or was the architecture shattered—missing crucial deep sleep, for instance? The latter has more severe next-day consequences.
The Gold Standard: Your Personal Sleep Quality Baseline
This is why generic advice like "get 8 hours" fails. One person may thrive on 7 hours of highly efficient, deep-sleep-rich rest. Another may need 8.5 hours with a different stage distribution. Your baseline defines your requirement for waking up refreshed.
Establishing this requires looking at aggregated data over time and correlating it with how you actually feel. Does a sleep efficiency of 88% with 1.5 hours of deep sleep consistently lead to you feeling great? That’s your gold standard. You can use a comprehensive sleep quality checklist to correlate your subjective feelings with this objective data.
When your current sleep metrics deviate from this personal standard, you have a clear starting point for investigation.
Interpreting Current Sleep Data Deviations
Consistently Low Efficiency & High Restlessness: If your current data shows you're spending 9 hours in bed but with 78% efficiency and 25+ wake-ups, you're not getting restorative rest. This strongly points to environmental or behavioral factors. It’s worth investigating the often-ignored factors that destroy sleep quality, from bedroom temperature to hidden light sources.
Suppressed REM or Deep Sleep: A current sharp drop in a specific sleep stage, even with good duration, is meaningful. REM sleep is crucial for cognitive and emotional processing, while deep sleep is for physical restoration. Stress and alcohol are common culprits that suppress REM, while pain or an irregular schedule can crush deep sleep. Understanding the distinct roles of sleep quality versus specific stages like REM is key here.
Improving Your Baseline: The ultimate goal is to use current data to improve your long-term baseline. By testing interventions—like optimizing your bedroom environment, adjusting caffeine timing, or practicing a wind-down routine—and observing their effect on your current sleep scores, you can gradually nudge your baseline upward. You can even test strategies to improve sleep quality in a focused period to see immediate impacts on your current data.
Key Health Metric #4: Activity & Recovery – The Delicate Balance
The relationship between activity (stress) and recovery is the central drama of physical well-being. Fitness improves not during the workout, but during the recovery afterward. Here, the baseline/current framework manages the tension between pushing forward and pulling back.
Readiness Scores: The Synthesis of Current Data
Many advanced platforms synthesize your current HRV, RHR, sleep, and temperature data into a single "Readiness" or "Recovery" score. This is the epitome of current-state analysis. It answers the question: "Based on how my body has recovered from recent stressors, how prepared am I for new stress today?"
A high readiness score (relative to your own norm) means your current physiological data suggests you are well-recovered. It might be a good day for a challenging workout or a high-stakes work project. A low readiness score is a recommendation, based on your personal data, to prioritize recovery—choose a lighter activity, focus on stress management, and get to bed early.
The Role of the Activity Baseline
Your activity baseline is your typical volume and intensity of movement—not just formal exercise, but daily steps, non-exercise activity thermogenesis (NEAT), and workout patterns. This baseline is in constant dialogue with your recovery metrics.
Overtraining doesn't happen because of a single hard workout. It happens when your current and recent activity load consistently outpaces your current and recent recovery capacity. If your readiness scores are chronically low while you maintain or increase your activity baseline, you are building a deficit. Your body will signal this through persistent negative deviations in HRV, elevated RHR, and declining sleep scores.
Listening to the Signals for Optimal Performance
The intelligent approach uses the baseline/current dynamic to practice periodization intuitively:
Stimulate (Current Activity > Baseline): Have a week of increased training load. Observe how your current recovery metrics respond.
Respond (Monitor Current vs. Recovery Baseline): If metrics dip negatively but rebound within 1-2 days, you are adapting well. This positive stress may eventually raise your fitness baseline.
Recover (Intentional Reduction): If current recovery metrics stay depressed, it's a clear signal to reduce current activity below your normal baseline for a few days to allow supercompensation to occur.
This creates a feedback loop where you are not blindly following a pre-written plan, but co-authoring it with your body’s real-time data.
Key Health Metric #5: Respiratory Rate & Blood Oxygen (SpO2)
While HRV and RHR take center stage, nocturnal respiratory rate and blood oxygen saturation (SpO2) are vital supporting actors, providing unique insights into sleep quality and overall respiratory health, best understood through their baseline patterns.
Nocturnal Respiratory Rate: The Silent Baseline
Your respiratory rate (breaths per minute) during sleep is remarkably stable for a given individual. It forms a very tight baseline. For most healthy adults, a sleeping respiratory rate falls between 12-20 breaths per minute, but your personal norm might be 14.
A sustained increase in your current nocturnal respiratory rate—say, from your baseline of 14 to a consistent 17—is a subtle but significant signal. It can indicate:
Respiratory Effort: Your body is working harder to breathe, potentially due to airway resistance (a mild sign of sleep-disordered breathing).
Fever or Infection: Increased metabolic demand from illness.
Cardiac Stress: In some cases, it can correlate with cardiovascular strain.
Because this baseline is so stable, even small, persistent upward shifts can be meaningful and are worth discussing with a healthcare provider if they persist.
Blood Oxygen (SpO2) During Sleep: Spotting the Dips
While awake, SpO2 is typically a steady 95-100%. During sleep, minor, brief dips are normal. However, your baseline is defined by the typical depth and frequency of these dips.
The critical metric is current deviations from this baseline. An increase in the number or depth of SpO2 dips (called desaturations) is a key objective indicator of disrupted breathing during sleep, such as in sleep apnea. Unlike subjective feelings of tiredness, this is hard physiological data.
If your wearable reports a significant increase in "low SpO2 events" or your measured sleep quality is poor without an obvious cause, your current SpO2 data may provide the clue. It moves the conversation from "I'm tired" to "My blood oxygen shows repeated disruptions, which explains the non-restorative sleep and next-day fatigue."
Key Health Metric #6: Skin Temperature & Its Subtle Shifts
Skin temperature, particularly its nocturnal trend, is a more recent addition to consumer wearables but offers profound baseline insights, especially for circadian rhythm and physiological changes.
The Circadian Rhythm Signature
Your core body temperature follows a distinct circadian rhythm, cooling down in the evening to initiate sleep and reaching its nadir in the early morning hours before rising to wake you up. This internal rhythm is mirrored in your peripheral skin temperature.
Your baseline temperature curve is this predictable nightly pattern. When your current data follows this smooth, descending-then-ascending curve, it suggests your circadian timing is strong and synchronized with your sleep schedule.
Current Deviations: What They Can Reveal
Deviations from your personal temperature baseline can be revealing:
Elevated Nocturnal Temperature: A current pattern showing less cooling or overall higher temperature can indicate:
An Inflammatory Response: Your body fighting an infection (even a subclinical one).
Hormonal Fluctuations: For women, this can be closely tied to the menstrual cycle, with a clear temperature rise after ovulation.
Poor Sleep Environment: A room that's simply too warm.
Disrupted Curve Shape: A erratic, non-rhythmic temperature curve often accompanies fragmented, low-quality sleep and a misaligned circadian clock.
For women tracking fertility, establishing a precise temperature baseline is crucial for identifying the current sustained shift that confirms ovulation, showcasing a powerful application of this metric.
The Technology Enabling This: From Smart Rings to Advanced Algorithms
Understanding baseline and current metrics is only possible because of significant advances in sensor technology, form factor, and data science. The wearable you choose directly impacts the fidelity and usefulness of your data.
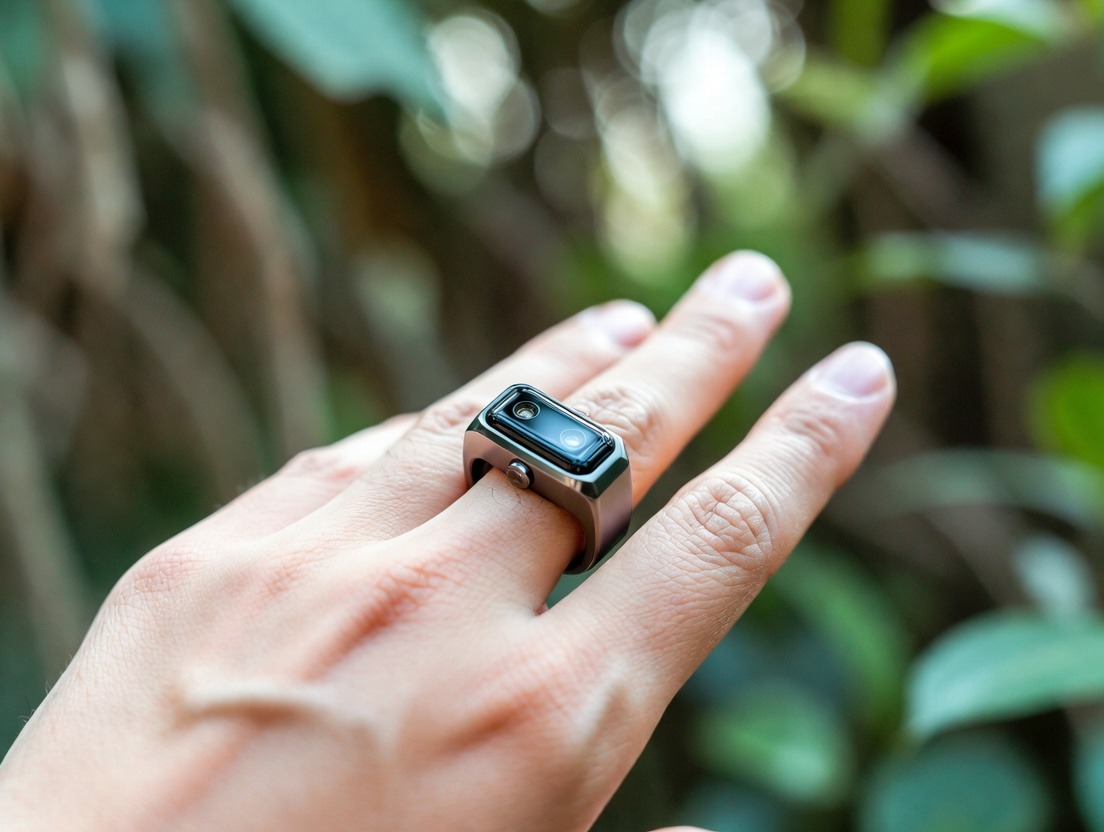
The Form Factor Advantage: Consistency of Measurement
This is where devices like smart rings hold a distinct advantage for establishing baselines. A ring, worn on the finger, provides an exceptionally consistent sensor placement and contact with a vascular-rich area (the finger). Unlike a wrist-based device that can shift during sleep or exercise, a ring maintains optimal positioning 24/7. This consistency reduces measurement "noise," leading to cleaner, more reliable data streams—which is absolutely foundational for calculating an accurate baseline. You can delve deeper into how this form factor enables more accurate sleep measurement.
Sensor Fusion: Building a Cohesive Picture
Modern wearables don't rely on a single sensor. They use sensor fusion—combining data from photoplethysmogram (PPG) heart rate sensors, 3-axis accelerometers, skin temperature sensors, and sometimes bioimpedance sensors. An algorithm cross-references these data points to validate readings and extract more complex metrics like HRV and sleep stages.
For example, to determine sleep, the device fuses movement data (accelerometer) with heart rate and HRV data (PPG). A drop in heart rate + a rise in HRV + minimal movement = higher confidence of deep sleep. This multi-sensor approach is what allows for the scientifically-validated understanding of what happens during good sleep.
The Role of Machine Learning in Personalizing Your Baseline
This is the true frontier. Basic algorithms calculate simple averages. Advanced platforms use machine learning to establish a dynamic, living baseline. These systems learn your unique patterns: how you typically respond to a hard workout, how your metrics shift during a work deadline, what your normal menstrual cycle pattern looks like.
Over time, they don't just compare your current HRV to a static number; they compare it to a predicted range based on what you did yesterday, the time of month, and your long-term trends. This makes the interpretation of "deviation" far more intelligent and personalized, filtering out expected changes to highlight truly anomalous and meaningful signals.
From Data to Insight: How to Track and Analyze Your Personal Metrics
Collecting data is the first step. The real work—and the real value—begins with analysis. Moving from a dashboard of numbers to actionable personal insight requires a systematic, mindful approach. This isn't about obsessing over daily fluctuations, but about observing trends and listening to the story your data tells over time.
Establishing Your Personal Baselines: A Step-by-Step Guide
You cannot understand your current state until you know your normal. Here is how to deliberately establish your baselines:
Commit to Consistent Tracking: Baseline establishment requires uninterrupted data collection for a minimum of 30 days, with 60-90 days being ideal for robust trends. Wear your device consistently, especially during sleep. Inconsistency creates gaps that distort the average.
Live Normally (At First): For the first month, don't try to "optimize" or make major changes. The goal is to capture your authentic, habitual state—your typical sleep patterns, activity levels, and stress responses. This honest snapshot is your true starting point.
Focus on Trends, Not Daily Numbers: Resist the urge to judge each day. Instead, open your app weekly to view the trend lines. Look at the 7-day and 30-day averages for core metrics like resting heart rate, HRV, and sleep duration. These rolling averages are the early formations of your baseline.
Note Key Lifestyle Markers: Use journal features or notes in your app to mark significant events: a particularly stressful work week, a new exercise program, a night of poor sleep due to travel, a social event with alcohol. These annotations will later help you explain deviations in your data.
Identify Your "Green Zone" Ranges: After 4-6 weeks, you can identify your personal ranges. For example: "My baseline HRV is 55ms, but it typically fluctuates between 48ms and 65ms on normal days. My baseline resting heart rate is 58 BPM, usually staying between 56 and 61."
Once this foundation is set, you can begin the more dynamic work of analyzing your current data against it.
Daily and Weekly Check-In Rituals
Effective analysis is built on regular, structured check-ins. These rituals should be brief and focused.
The Morning Check-In (2-3 minutes):
Review Your Readiness/Recovery Score: This synthesized metric is your starting directive for the day.
Look at Key Nightly Metrics: Check your sleep score, deep/REM sleep, and nocturnal HRV & RHR. Don't just see the numbers; ask: "Are these within my normal range?" A quick glance at the morning signs of good sleep quality can help correlate data with feeling.
Form a Hypothesis: If a metric is off, form a simple hypothesis. "My HRV is low. Was it the late dinner? The extra glass of wine? The intense workout yesterday?"
The Weekly Review (10-15 minutes): This is where the deepest insights emerge.
Observe Weekly Trend Lines: Look at the graphs for your key metrics. Is your resting heart rate trend line flat, slowly declining, or creeping up? Is your sleep efficiency holding steady?
Correlate Inputs and Outputs: Cross-reference your activity log with your recovery metrics. Did a high-volume training week correspond with a steady drop in HRV and a rise in RHR? That’s a clear sign you were exceeding your recovery capacity.
Look for Patterns: Do you see worse sleep metrics every Thursday night? Perhaps it's related to your weekly late meeting. Does your HRV consistently dip the day after your long run? This is your personal response map.
Plan Adjustments: Based on the weekly review, make one small, intentional adjustment for the coming week. "My deep sleep was lower all week. This week, I'll stop caffeine by 2 PM and test the impact."
Avoiding Analysis Paralysis and Data Anxiety
The flood of data can lead to stress—the opposite of its wellness intention. Here’s how to stay sane:
Embrace the 80/20 Rule: Focus 80% of your attention on 2-3 metrics most important to your goals (e.g., HRV + Sleep Score for recovery; RHR + Activity for fitness). Let the others be supporting context.
Look for Persistent Deviations, Not One-Offs: A single bad night or low HRV reading is meaningless noise. A trend of 3+ days is a signal. Train yourself to ignore the daily "score" and look for the slope of the line.
Let Your Body Have the Final Vote: Data is a guide, not a gospel. If your data says you're "ready" but you feel exhausted, listen to your body. The subjective feeling is a crucial data point in itself. Sometimes, what you need most is to close the app and take a walk in nature.
Application in Real Life: Case Studies and Scenarios
Theory becomes powerful when applied. Let’s walk through hypothetical but realistic scenarios to see how the baseline/current dynamic plays out in decision-making.
Case Study 1: The Overtraining Executive
Profile: Alex, 42, manages a team and trains for a half-marathon.
Analysis & Action: The sustained, multi-metric deviation from baseline is a textbook stress/recovery imbalance signal. Instead of pushing through, Alex uses the data to make a rational decision: he reduces running mileage by 40% for the next week, prioritizes 8-hour sleep windows, and practices mindfulness. Within 5-7 days, his current metrics begin returning to baseline, preventing potential burnout or injury.
Case Study 2: The Sleep Optimization Journey
Profile: Sam, 35, feels constantly "medium-grade tired" but gets 7.5 hours of sleep.
Initial Baselines: Sleep Duration: 7h 30m. Sleep Efficiency: 81%. Deep Sleep: 45 min. RHR: 66 BPM.
The Intervention: Sam decides to focus on sleep quality for one month. They implement a "sleep formula": cooler room temperature, complete darkness, and a consistent 10:30 PM bedtime.
Current Data Evolution & New Baseline:
By Week 2: Current sleep efficiency jumps to 88%. Deep sleep increases to 60+ minutes.
By Week 4: These improvements stabilize. The new baseline recalibrates: Sleep Efficiency: 89%. Deep Sleep: 65 min. A secondary effect emerges: morning RHR trends down to 62 BPM.
The Insight: Sam didn't need more sleep; they needed better sleep. The data proved that the environmental interventions directly improved sleep architecture, which in turn improved cardiovascular recovery (lower RHR). Sam could see the tangible return on investment for their changes.
Day 1 (Pre-Symptomatic): Morning RHR is normal, but the nocturnal RHR from the previous night shows a 4 BPM elevation. Respiratory rate is up to 15.5.
Day 2 (Feeling "Off"): Morning RHR is up 8% from baseline. Readiness score is low. Jordan feels a scratchy throat by evening.
Day 3 (Full Illness): Symptoms are clear. Data shows highly elevated RHR and respiratory rate.
Analysis & Action: The data provided a 24-48 hour head start. On Day 2, seeing the clear physiological signs, Jordan could proactively cancel intense plans, hydrate aggressively, rest, and increase sleep—potentially mitigating the severity and duration of the illness. During recovery, the data provides an objective guide: Jordan isn't "ready" to return to full activity until those metrics consistently return to their personal baseline ranges, not just when symptoms fade.
The Limitations: What Your Metrics Can't Tell You
A critical part of being an informed user is understanding the boundaries of consumer wearable technology. These devices are powerful wellness tools, not medical devices.
The "Why" Behind the "What": Correlation, Not Causation
Your smart ring is a brilliant detective of what is happening, but it is not a mind reader of why. It can tell you your HRV is down 20%. It cannot definitively tell you if it's due to dehydration, an argument with your partner, a hidden infection, or work anxiety. It provides the clue; you must provide the context through self-awareness and lifestyle logging.
This is where journaling becomes the indispensable companion to data tracking. A note like "big presentation today, felt anxious" turns a low HRV data point from an alarming mystery into an understandable, even expected, physiological response.
The Missing Pieces: Nutrition, Hydration, and Mental Health
Current wearable technology has significant blind spots:
Nutrition & Hydration: While some devices estimate calorie expenditure, they do not measure intake. They cannot track your macronutrient balance, vitamin levels, or hydration status—all massive influencers of your metrics. A sudden drop in HRV could be solved by drinking two glasses of water.
Mental & Emotional State: Stress is measured indirectly through physiology (HRV, RHR). The device doesn't know if you're feeling joyful, grieving, creatively inspired, or depressed. Your subjective mood is qualitative data that must be layered onto the quantitative metrics for a complete picture.
Blood-Based Metrics: Glucose, cortisol, thyroid hormones, vitamin D—these are profound health indicators that remain outside the scope of non-invasive wearables (for now).
When to See a Doctor: Data as a Conversation Starter, Not a Diagnosis
This is the most important rule. Your wearable data is meant to empower a conversation with a healthcare professional, not replace one.
Use your data to:
Provide Objective Evidence: Instead of saying "I feel tired," you can say, "My device shows my resting heart rate has been elevated by 10 beats per minute for three weeks, and my sleep efficiency is consistently under 80%, despite being in bed for 8 hours."
Track Progress Objectively: "Since starting this treatment for my suspected sleep apnea, my nightly SpO2 dips have decreased from 15 per hour to 2 per hour."
Identify Patterns: "I've noticed my heart rate spikes irregularly in the afternoons. Here's the data from the last five occurrences."
Never use your data to:
Self-diagnose a medical condition (e.g., "My SpO2 dipped, so I must have sleep apnea").
Ignore symptoms because your data looks "good."
Adjust medication without consulting your doctor.
If you see persistent, unexplained deviations in key metrics—especially related to heart rhythm, breathing during sleep, or sustained elevated RHR—schedule a visit with your doctor and bring your data with you.
Integrating Insights: Building a Personalized Health Action Plan
The culmination of tracking and analysis is intelligent action. Your personalized data should inform a living, breathing action plan that evolves with you.
Creating Feedback Loops: Test, Measure, Adapt
Turn your life into a gentle, personal science experiment. The goal is to build positive feedback loops.
Hypothesis: "If I stop looking at screens 90 minutes before bed, my sleep deep sleep percentage will increase."
Intervention: Implement the screen curfew for 7-14 days.
Measurement: Observe your current deep sleep and sleep score data during this period. Compare it to your baseline.
Adaptation: If the data shows improvement, the habit sticks and becomes part of your new normal, raising your baseline. If no change, you test a new hypothesis (e.g., "If I keep the room at 67°F...").
This method moves you away from generic health tips and towards a toolkit of strategies that are proven—by your own data—to work for you.
Prioritizing Interventions Based on Data Severity
Not all deviations require the same level of response. Use a tiered system:
Tier 1 (Minor, 1-2 day deviation): Practice observation and minor course correction. Hydrate well, aim for an early bedtime, maybe take a relaxing walk instead of a hard workout.
Tier 2 (Moderate, 3-5 day sustained deviation): Implement deliberate recovery protocols. This may include scheduling a rest day, practicing meditation or breathwork, actively testing sleep improvement strategies for a week, and evaluating major stress sources.
Tier 3 (Severe, week+ deviation or multi-metric alert): This signals a need for a lifestyle audit and potentially professional input. Consider a deload week from training, a digital detox, a vacation, or a conversation with a coach or doctor.
Long-Term Goal Setting with Baseline Shifts
Ultimately, you're not just managing daily readiness; you're guiding the long-term trajectory of your health. Set goals not as rigid targets, but as desired shifts in your baselines.
Weak Goal: "Get my resting heart rate below 60."
Strong, Data-Informed Goal: "Through consistent zone 2 cardio training 3x/week and improved sleep hygiene, I aim to gradually lower my 90-day average resting heart rate baseline from 64 BPM to 59 BPM over the next 6 months."
This reframes success from daily wins to sustainable, measurable trends in your underlying physiology. It’s the difference between chasing a score and building a healthier foundation.
The Future of Personalized Health Tracking
The field of biometric monitoring is advancing at a breathtaking pace. The relationship between baseline and current metrics will only become more sophisticated, predictive, and integrated.
Predictive Analytics and Early Warning Systems
The next generation of algorithms will move beyond describing your current state to predicting your future state. By analyzing your baseline rhythms and current deviations with machine learning, systems will be able to offer forecasts: "Based on your current recovery deficit and planned workload, there's an 85% probability your sleep quality will be poor tonight unless you prioritize wind-down time." Or, "Your physiological patterns are similar to those you exhibited 48 hours prior to your last seasonal allergy flare-up."
This shifts the paradigm from reactive to genuinely preventative, giving you a time window to intervene before a problem fully manifests.
Multi-Modal Integration: The Unified Health Dashboard
The future is not more devices, but smarter integration. Imagine a seamless ecosystem where:
Your smart ring data (physiology) syncs with your smart kitchen scale (nutrition).
Your continuous glucose monitor (metabolism) data is correlated with your HRV (stress/recovery).
Your electronic health records (lab results, diagnoses) are permissioned to integrate with your wellness app, allowing your wearable baseline to be contextualized with your clinical history.
This multi-modal view would create a holistic "unified health dashboard," offering insights impossible to glean from any single data stream. The baseline/current analysis would span domains, revealing, for instance, how specific foods impact not just glucose, but also your nocturnal heart rate and next-day readiness.
Ethical Considerations and Data Ownership
As the technology grows more intimate and powerful, critical questions arise:
Data Privacy and Security: Who owns your incredibly detailed physiological data stream? How is it stored, anonymized, and protected? Users must prioritize platforms with transparent, user-centric privacy policies.
Algorithmic Bias: Baselines and "normal" ranges are defined by algorithms trained on data sets. If these sets lack diversity, the "norms" they establish could be biased. The industry must strive for inclusive data collection.
Psychological Impact and Orthosomnia: The quest for perfect data can lead to "orthosomnia"—a clinically recognized anxiety over achieving perfect sleep scores. The future of design must focus on promoting wellbeing, not perfectionism, perhaps by debunking common sleep quality myths that fuel such anxiety.
The most empowering future will be one where technology gives us profound self-knowledge while firmly remaining a tool we control, not a master that controls us.
Conclusion of This Portion: Becoming the Author of Your Health Story
We began by confronting the paradox of data-rich, insight-poor health tracking. We've journeyed through the defining philosophy of personal context, deconstructed the vital partnership between Baseline and Current metrics, and explored their application across heart, sleep, activity, and beyond. We've discussed how to analyze this data, its limitations, and the exciting horizon of what's to come.
The fundamental takeaway is this: You are not an average. Your health journey is a singular narrative. Your baseline is the established plot; your current data are the new chapters being written each day. Wearable technology provides the pen and the feedback, but you hold the authorship.
By mastering the framework of Baseline vs. Current, you graduate from passively reading numbers to actively interpreting your body's unique language. You learn to distinguish meaningful signals from trivial noise. You gain the confidence to make lifestyle choices not based on generic advice, but on personalized, physiological evidence.
This knowledge transforms your smart ring or wearable from a fancy pedometer into a true wellness partner—one that helps you honor your body's need for recovery, celebrate its positive adaptations, and navigate the stresses of modern life with resilience and insight. The path to optimized well-being is not found in chasing universal ideals, but in understanding and nurturing your one-of-a-kind system. That journey starts with knowing where you typically are, so you can wisely assess where you are today, and intentionally guide where you will be tomorrow.
The Art of Biohacking: Optimizing Each Key Metric for Your Unique Baseline
Understanding your baseline and current data is the diagnosis; intelligent intervention is the treatment. This is where personalized biohacking begins—the systematic, data-driven process of nudging your unique physiology toward a higher state of well-being. It’s not about extreme measures, but about the cumulative power of precise, informed micro-adjustments. Let’s explore actionable strategies for optimizing each cornerstone metric, with the explicit goal of positively shifting your personal baselines over time.
Optimizing Heart Rate Variability: Building Resilience from the Inside Out
Since HRV is a premier marker of autonomic nervous system balance and recovery capacity, improving your baseline HRV is akin to upgrading your body’s fundamental stress resilience. Strategies must address both physical and psychological pillars.
Physiological Levers:
Consistent, Prioritized Sleep: This is non-negotiable. Deep, restorative sleep is the single greatest contributor to parasympathetic ("rest and digest") tone. Focus on enhancing sleep quality, not just duration. This includes maintaining a cool, dark environment and a consistent schedule. The impact on HRV is so profound that it’s worth exploring the science behind what happens during truly restorative sleep.
Strategic Nutrition & Hydration: Avoid large, heavy meals close to bedtime, as digestion can impair HRV overnight. Chronic dehydration stresses the system; ensure consistent fluid intake throughout the day. Some find a reduction in inflammatory foods (like processed sugars and certain vegetable oils) correlates with improved HRV trends.
Aerobic Base Building: Low-intensity, steady-state cardio (Zone 2 training, where you can hold a conversation) is particularly effective at strengthening parasympathetic response and improving cardiovascular efficiency, which raises HRV over time. This is a slow, foundational adaptation reflected in a gradually climbing baseline.
Psychological & Behavioral Levers:
Coherent Breathing Practice: This is one of the most direct biohacks for HRV. Breathing at a slow, rhythmic pace of 5-6 breaths per minute (inhaling for 5 seconds, exhaling for 5 seconds) can instantly increase HRV and stimulate the vagus nerve. Just 10-15 minutes daily can train your nervous system toward greater baseline resilience.
Mindfulness & Meditation: Regular practice reduces background psychological stress and sympathetic nervous system overdrive. The "relaxation response" cultivated through meditation directly promotes the physiological state that high HRV reflects.
Nature Immersion & Digital Detox: Chronic exposure to digital screens and urban stressors can keep the nervous system on alert. Regular time in nature ("forest bathing") and scheduled breaks from technology provide a necessary reset for the autonomic nervous system.
The Key Insight: Don’t chase daily HRV numbers. Look for a slow, upward trend in your 30-day rolling average. A successful intervention isn’t one high score; it’s a baseline that has recalibrated from an average of 45ms to 55ms over six months.
Optimizing Resting Heart Rate: Strengthening the Cardiovascular Engine
A lowering baseline RHR is a hallmark of improved cardiovascular fitness and efficiency. The path there is a blend of consistent training and dedicated recovery.
Training for Efficiency:
Build Your Aerobic Engine: As with HRV, consistent Zone 2 cardio is foundational. It increases stroke volume (the amount of blood pumped per beat), so the heart doesn’t need to beat as often at rest. This is a long-term structural adaptation.
Incorporate High-Intensity Interval Training (HIIT) Sparingly: While HIIT provides powerful fitness benefits, it places significant stress on the system. Used strategically (e.g., 1-2 times per week), it can improve overall cardiac output. However, too much can lead to a chronically elevated RHR due to insufficient recovery. Your current RHR data is the perfect guide to balance HIIT with lower-intensity work.
Recovery as a Catalyst:
Sleep as Recovery Prime Time: Nocturnal RHR is your truest metric. The depth of the nightly dip is a sign of recovery quality. Prioritizing sleep is paramount. If your RHR isn’t dipping adequately at night, investigate factors that may be destroying your sleep quality, from caffeine timing to light pollution.
Active Recovery Days: Incorporate genuine low-intensity days (walking, gentle yoga, mobility work). These promote circulation and recovery without adding cardiac stress, helping to keep your current RHR closer to its optimal baseline.
Manage Chronic Stress: Psychological stress manifests as a physiologically elevated heart rate. Techniques like the coherent breathing mentioned for HRV are equally effective here. A calm mind supports a slower, steadier heart.
The Warning Signal: Remember, a sudden, sustained increase in your current RHR relative to baseline is one of the clearest signals your body sends. It demands attention and a reduction in stress load, whether that stress is physical, emotional, or immunological.
The Master Optimization: A Comprehensive Guide to Elevating Your Sleep Baseline
Sleep is the bedrock upon which all other metrics are built. Optimizing sleep isn’t about one trick; it’s about building a fortress of habits, known as sleep hygiene. The goal is to elevate your baseline sleep score and architecture.
The Pre-Sleep Ritual (The 90-Minute Wind-Down):
Light Discipline: Blue light from screens suppresses melatonin. Implement a digital sunset 90 minutes before bed. Use blue-light blocking glasses if screen use is unavoidable. In the evening, favor warm, dim lights. This directly signals your circadian clock that sleep is approaching.
Temperature Protocol: Your core body temperature needs to drop to initiate sleep. A hot bath or shower 1-2 hours before bed actually helps this process; as you cool down afterward, it mimics the natural temperature drop. Keep your bedroom cool, ideally between 65-68°F (18-20°C).
Psychological Unloading: A racing mind is the enemy of sleep. Practice a "brain dump" by journaling worries or to-do lists for the next day. Engage in calm, non-stimulating activities like reading a physical book or gentle stretching.
Reserve the Bed for Sleep & Intimacy Only: Train your brain to associate the bed with sleep, not work, scrolling, or watching TV. This strengthens the cognitive link between bed and rest.
Daytime Habits That Fuel Nightly Recovery:
Morning Light Exposure: Get bright, natural light within 30-60 minutes of waking. This is the most powerful signal to anchor your circadian rhythm, making it easier to fall asleep at night.
Caffeine & Alcohol Management: Enforce a strict caffeine curfew (often by 2 PM, but your personal cutoff may vary—use your sleep data to find it!). While alcohol may induce sleepiness, it severely fragments sleep architecture, suppressing REM and causing awakenings in the second half of the night. Tracking your sleep after an evening drink provides brutal, objective evidence of its cost.
Consistent Schedule: Go to bed and wake up at roughly the same time every day, even on weekends. Variability confuses your internal clock and degrades sleep quality.
Using Your Data to Test and Validate: This is where the baseline/current model shines. Implement one change at a time (e.g., "this week, I’ll enforce a 9 PM screen curfew"). Observe its effect on your current sleep depth, efficiency, and HRV over 7-14 nights. If positive, it becomes part of your routine, gradually lifting your baseline. This methodically builds a sleep protocol proven to work for you, moving beyond guesswork. You can systematically evaluate your progress with a comprehensive sleep quality checklist.
Optimizing the Activity-Recovery Balance: The Dance of Stress and Adaptation
Fitness and vitality are born from the intelligent cycle of stress (activity) and adaptation (recovery). Your data provides the perfect choreography for this dance.
Principles of Personalized Periodization:
Use Readiness to Guide Intensity: Let your morning readiness or recovery score dictate your workout intensity for the day. High readiness? It’s a day for a challenging session. Low readiness? It’s a day for gentle movement, mobility, or complete rest. This is the essence of autoregulation—listening to your body’s real-time capacity.
Plan Deloads Proactively, Not Reactively: Don’t wait for injury or burnout. Every 4-6 weeks, based on your trend lines, schedule a "deload" week where you reduce training volume and intensity by 40-60%. This allows accumulated fatigue to dissipate and supercompensation to occur, leading to a higher performance baseline afterward.
Embrace Non-Exercise Activity (NEAT): Your general daily movement (walking, standing, fidgeting) is a massive component of your metabolic health and recovery. On non-training days, prioritize hitting a step goal or simply moving frequently. This aids circulation and recovery without adding systemic stress.
Listening to the Subtle Cues: Overtraining syndrome rarely announces itself with pain first. It whispers through your metrics:
A resting heart rate that won’t come down after a hard block of training.
A heart rate variability baseline that is trending downward despite "adequate" sleep.
A sleep quality score that is deteriorating even though you feel exhausted.
When you see this multi-metric convergence of negative deviations, it’s not a suggestion to push harder; it’s a mandate to rest. The smartest training plan is the one that can adapt to the feedback from your body.
Nurturing Respiratory and Metabolic Health Through Data
While SpO2 and respiratory rate are often seen as passive metrics, we can create conditions that support their optimal baseline patterns.
Supporting Nocturnal Breathing:
Positional Therapy: For some, mild sleep-disordered breathing is positional (worse on the back). If your SpO2 data shows more dips or your partner reports snoring, try side-sleeping. Wearable data can help confirm if this intervention reduces events.
Nasal Breathing: Practice breathing through your nose during the day and try to maintain it during sleep (mouth taping is a controversial technique that should be approached with extreme caution and preferably professional guidance). Nasal breathing filters, humidifies air, and can improve oxygenation.
Maintain a Healthy Weight & Avoid Late Alcohol: Excess weight can contribute to airway obstruction. Alcohol is a potent respiratory depressant and muscle relaxant, which can dramatically worsen breathing events during sleep, visible in your SpO2 and respiratory rate data.
Supporting a Stable, Healthy Metabolism (Indirectly):
Regular Meal Timing: Eating at consistent times helps regulate circadian rhythms, which in turn supports stable metabolic function and can improve sleep-related metrics.
Post-Meal Walks: A gentle 10-15 minute walk after meals can aid glucose metabolism and digestion, preventing the blood sugar spikes and crashes that can subtly disrupt your energy and, by extension, your activity and recovery balance.
Stress Management for Metabolic Health: Chronic stress elevates cortisol, which can dysregulate blood sugar and promote inflammation. The HRV- and RHR-improving practices (meditation, nature time) thus have a downstream positive effect on broader metabolic health.
The goal with these metrics is often one of preservation and prevention—maintaining a stable, healthy baseline and using current deviations as early investigation points, rather than trying to aggressively "optimize" a number that is naturally stable in healthy individuals.
Beyond the Ring: Integrating Subjective Feeling with Objective Data
The most advanced algorithm is still missing a crucial data stream: your lived, subjective experience. The integration of "how you feel" with "what the data says" is the final step in achieving true self-knowledge.
The Vital Practice of Correlative Journaling
Don't let your wearable be a detached oracle. Make it a dialogue partner through simple journaling.
The Daily Note: Each morning or evening, jot down 2-3 words or a short sentence: "Energy high, calm focus," "Foggy, low motivation," "Anxious about meeting, stomach tight."
The Weekly Correlation: During your weekly review, look for patterns. Do days labeled "anxious" consistently show lower HRV? Do you feel "refreshed" only on days following sleep with 90+ minutes of deep sleep? This connects the external number to your internal world.
Identify Your Personal "Tells": You may discover that for you, an impending cold doesn't start with a sore throat, but with a specific feeling of "heavy legs" that correlates with a 5 BPM RHR increase. This turns subjective feeling into a predictive tool.
When Data and Feeling Diverge: Who to Trust?
This is a common and important scenario. What do you do when you feel great but your readiness score is low, or vice versa?
Scenario 1: Feel Good, Data Bad. You're energized, but your HRV is low and RHR is high. This can happen in a state of "stress euphoria" or sympathetic overdrive (like before a big event). The data is likely revealing an underlying physiological cost that you haven't yet subjectively registered. Action: Proceed with caution. Maybe go for your workout but keep the intensity in check. Prioritize recovery later. The data is giving you a warning that your energetic feeling may be borrowed, not earned.
Scenario 2: Feel Bad, Data Good. You feel sluggish, but all your metrics are green. This can indicate non-physiological factors (like boredom, lack of mental stimulation, or mild depression) that wearables don't measure. It could also mean you're in the early stages of an illness that hasn't yet triggered a physiological response. Action: Trust the feeling. Use the "good" data as permission to explore other causes. Could you be dehydrated? Is it a mental health dip? The data rules out physiological fatigue, narrowing the diagnostic field to other areas of life.
The golden rule: Data informs, but feeling decides. Use the data to question and investigate your feelings, not to invalidate them.
Cultivating Body Awareness: Reducing Dependence on the Device
The ultimate goal of quantified self is not lifelong device dependency, but to become the device—to internalize the awareness so you no longer need the constant external validation.
Use Data as a Training Wheel: Periodically try to guess your readiness before looking at your app. How does your body feel? Heavy or light? Is your mind clear or foggy? Then check the data. Over time, you'll calibrate your internal sensations to your physiological state.
Scheduled Breaks: Consider taking a weekend or a vacation from wearing your device. This breaks the cycle of obsession and allows you to practice listening to your body without a digital intermediary. Often, you return with a healthier, less anxious relationship to the data.
Focus on the Macro-Trends: As you become more advanced, shift your focus from daily scores to monthly and quarterly trend lines. This reduces daily anxiety and keeps you focused on the long-term trajectory of your health, which is the true objective.
Advanced Analytical Techniques: Becoming Your Own Data Scientist
Once you've mastered the fundamentals of baseline vs. current, you can employ more sophisticated techniques to extract deeper meaning from your data streams.
Understanding Lagging vs. Leading Indicators
Not all metrics move in lockstep. Some are leading indicators (they change first, predicting a shift), and some are lagging indicators (they confirm a change that has already happened).
Leading Indicators (Early Warning):
**Acute: ** Current HRV (especially morning reading) is often the first to drop under stress.
**Acute: ** Nocturnal RHR and respiratory rate can increase 24-48 hours before you feel ill.
**Chronic: ** A sustained downward trend in HRV baseline often precedes a plateau or decline in performance.
Lagging Indicators (Confirmation):
**Acute: ** How you feel subjectively ("I'm tired") often lags behind the physiological data.
**Chronic: ** Improvements in resting heart rate baseline lag weeks behind consistent training.
**Chronic: ** Body composition changes are a lagging indicator of sustained nutritional and exercise habits.
The Application: Pay closest attention to leading indicators for daily decisions (e.g., adjusting training based on morning HRV). Use lagging indicators to validate the effectiveness of long-term lifestyle strategies.
Calculating Your Personal "Stress Bucket" Capacity
A powerful mental model is to think of your recovery capacity as a "stress bucket." Different stressors (work, exercise, family, poor sleep) pour water into the bucket. Recovery practices (sleep, meditation, nutrition, fun) empty it. Your baseline metrics represent the bucket's usual water level.
Quantify Stressors: Roughly score your day's total stress input (e.g., hard workout = +3, work deadline = +2, poor sleep = +4).
Quantify Recovery: Score your recovery actions (e.g., 8 hours of good sleep = -4, 20-minute meditation = -1, relaxing walk = -1).
Correlate with Data: See how days with a high net "bucket score" correlate with negative deviations in your current HRV and RHR. This model helps you make conscious choices: "I have a huge work stressor today (+3), so I'll skip my intense workout to avoid overflowing my bucket."
Seasonal and Cyclical Baseline Adjustments
Your baseline is not a monolith; it has natural rhythms. A rigid year-round baseline is less useful than a seasonal or cyclical baseline.
Women's Health: For those who menstruate, creating separate baselines for different phases of the cycle is revolutionary. Resting heart rate typically rises after ovulation and peaks before menstruation. HRV often follows an inverse pattern. Comparing your current data to your "follicular phase baseline" vs. your "luteal phase baseline" provides vastly more accurate and compassionate insights than a single average. It explains why a workout may feel harder or recovery may be slower at certain times—it’s not a failure, it’s physiology.
Seasonal Variations: Many people have slightly higher RHR and lower HRV in winter, potentially due to less daylight, different activity patterns, and immune system challenges. Your "winter baseline" and "summer baseline" may differ. Recognizing this prevents unnecessary alarm and allows for seasonal lifestyle adjustments.
By embracing these advanced concepts, you move from simply reading data to modeling your unique physiological system, predicting its responses, and managing it with a sophistication that truly honors its complexity.