Modern Health Monitoring: The Accuracy and Validation Question
A critical look at the processes used to validate the accuracy of consumer health devices.
A critical look at the processes used to validate the accuracy of consumer health devices.
In an era where we can track our every heartbeat, step, and sleeping breath with a device on our wrist or finger, we stand at a fascinating crossroads of empowerment and uncertainty. The promise of modern health monitoring is intoxicating: a continuous, data-driven window into our personal biology, offering insights that could help us live longer, healthier, and more optimized lives. From smart rings that whisper our stress levels to wearables that chart our sleep architecture, this technology has vaulted from sci-fi fantasy to mainstream wellness staple in less than a decade.
Yet, beneath the glossy marketing and the sleek, minimalist design of these gadgets, a critical, often unasked question echoes in the minds of clinicians, researchers, and discerning consumers alike: Can we trust the numbers?
This is not a question of mere curiosity. It is the fundamental bedrock upon which the entire edifice of consumer health technology must stand. When a device tells you your blood oxygen is dipping, your heart rate variability is low, or your core body temperature is elevated, what does that actually mean for your health? Is it a clinically-significant warning sign, a harmless anomaly, or simply a sensor error? The journey from raw photoplethysmography (PPG) signals to a clean, actionable insight on your smartphone screen is a long and complex one, fraught with algorithmic interpretation, physiological noise, and a minefield of variables.
This article is a deep, evidence-based exploration into that journey. We will move beyond the surface-level feature lists and dive into the scientific and industrial processes that separate a useful health tool from a glorified pedometer. We will dissect what "accuracy" truly means in a regulatory context, examine how and why different devices can tell you wildly different stories about your own body, and provide you with a framework to become an intelligent, critical consumer of your own data.
The stakes are quietly profound. As these devices begin to influence our daily decisions—when to rest, how to train, even when to seek medical help—understanding their limitations becomes as crucial as leveraging their capabilities. The age of data-driven wellness is here. It's time to ensure we are reading the map correctly.
Before we can trust a device, we must understand what it’s being compared to. In the world of medical measurement, the term "gold standard" refers to the best available, most accurate, and most reliable method for assessing a specific physiological parameter under controlled conditions. It's the benchmark against which all new, typically more convenient, technologies are measured.
For heart rate, the gold standard is often considered the 12-lead electrocardiogram (ECG or EKG) in a clinical setting. For sleep stages, it's polysomnography (PSG) conducted in a specialized sleep lab, involving EEG, EOG, and EMG sensors. For blood oxygen saturation (SpO2), it's a hospital-grade pulse oximeter that has passed rigorous FDA clearance.
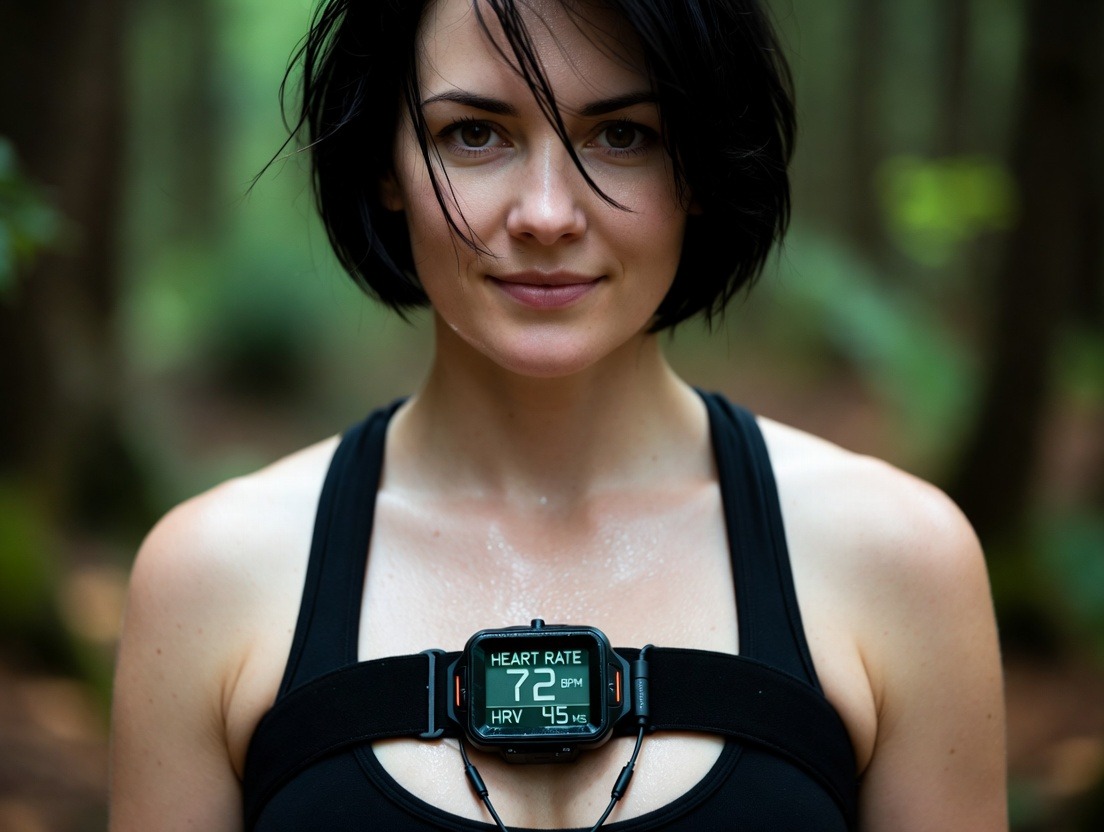
Consumer wearables and smart rings operate in a radically different environment: the real world. They face movement artifacts, varying skin tones, anatomical placement differences, and environmental factors never encountered in a sterile lab. This is the "Wrist Standard" (or "Finger Standard")—a measurement taken in the chaotic theater of daily life.
So, how do we bridge this gap? The answer lies in validation studies.
A robust validation study doesn't just slap a wearable on someone and say "look, it gives numbers." It follows a meticulous protocol:
When a company claims a device is "clinically validated" or "FDA-cleared," it's essential to dig deeper. FDA 510(k) clearance, for example, means the device has been shown to be substantially equivalent to a predicate device already on the market for a specific medical claim, such as detecting atrial fibrillation. It does not mean the FDA has tested every feature of the device. Many wellness features, like sleep stage scoring or stress scores, are classified as "general wellness" and do not require FDA clearance.
For the consumer, the takeaway is this: look for transparency. Reputable companies will publish their validation study whitepapers or have them cited in peer-reviewed journals. Be skeptical of broad, unsupported claims. A device validated for resting heart rate in a controlled lab may not be accurate during high-intensity interval training. Understanding the context and limits of a device's validation is the first step toward intelligent data interpretation.

The magic of a modern health monitor doesn't come from a single source, but from a symphony of sensors working in concert. To judge accuracy, we must understand what each instrument in this orchestra is trying to play.
Photoplethysmography (PPG): The Heart of the Matter (Literally)
This is the foundational technology for most optical heart rate and SpO2 sensors. A tiny LED shines light (typically green and/or red/IR) into your skin. A photodetector then measures the amount of light that bounces back. With each heartbeat, blood volume in the capillaries changes slightly, modulating the light absorption. The sensor captures these minuscule fluctuations to derive your heart rate.
The Accelerometer and Gyroscope: The Context Providers
These are micro-electromechanical systems (MEMS) that measure movement and orientation. They tell the device what you are doing: Are you still, walking, running, or typing? This context is critical for:
Skin Temperature Sensor: The Subtle Trend Tracker
Unlike a fever thermometer that seeks an exact core body temperature reading, the skin temperature sensor in wearables is designed to track relative changes. Worn continuously, usually on the finger (an excellent site for this measurement), it can detect subtle nightly dips and rises that form your personal temperature rhythm.
By understanding what each sensor is actually measuring—and its inherent limitations—you can better parse the data on your app. A spike in heart rate during a stressful meeting is likely real. A spike while you’re vigorously washing dishes might be an artifact. This discernment is the key to moving from data overwhelm to genuine insight.
Heart rate is the most familiar metric, but even here, there are layers of accuracy and meaning. Resting Heart Rate (RHR) is a well-established biomarker for cardiovascular fitness. Consumer devices typically measure it quite accurately during periods of stillness. The more dynamic and challenging measurement is Active Heart Rate during exercise. This is where high-end wearables with advanced filtering algorithms separate themselves, as they must maintain a clean PPG signal or switch to an ECG-based measurement during intense motion.
But the true frontier of optical sensing lies in Heart Rate Variability (HRV). HRV is not your heart rate itself, but the subtle, millisecond variations in the time intervals between consecutive heartbeats. It is a direct, non-invasive window into your autonomic nervous system.
The Extreme Accuracy Demands of HRV
Measuring HRV via PPG is a monumental technical challenge. Where a heart rate reading can afford a small error margin, HRV analysis requires precise, millisecond-level accuracy in detecting each heartbeat (a point known as the "R-peak"). Any noise or missed beats dramatically skew the HRV calculation. This is why the most reliable HRV measurements have historically come from chest-strap ECG monitors.
Smart rings, interestingly, have a potential advantage for nocturnal HRV measurement. The finger offers a strong PPG signal, and during sleep, motion artifact is minimized. This allows for a stable, all-night HRV reading, often reported as a single metric like RMSSD or the Nightly Average. This can be a more reliable indicator of overall recovery status than a spot-check during the day.
For the user, the lesson is to trend, not obsess over single readings. Look at your HRV over a weekly or monthly baseline. A single low score is meaningless; a consistent downward trend is a powerful signal from your body to prioritize rest. Using HRV data to inform your daily choices is one of the most practical applications of wearable technology, but its utility is completely dependent on the sensor's ability to capture those tiny, critical intervals faithfully.
Sleep is perhaps the most complex puzzle for a consumer device to solve. In a sleep lab, technicians score 30-second epochs of data from brain waves (EEG), eye movements (EOG), and muscle tone (EMG) into stages: Wake, Light (N1/N2), Deep (N3), and REM sleep.
Your wearable has none of these direct brain signals. Instead, it must make an educated guess—or more accurately, a statistical prediction—using the sensors it has: movement (accelerometer), heart rate (PPG), and sometimes HRV and skin temperature.
The Algorithmic "Black Box"
Each company's "secret sauce" is its proprietary sleep staging algorithm. It ingests your sensor data and compares it to a massive training dataset of people who wore both a consumer device and underwent lab PSG. The algorithm learns patterns: "When heart rate is very steady, HRV is high, and movement is absent, that correlates with deep sleep in 85% of lab cases."
Beyond Stages: The Value of Trends and Markers
While the stage percentages may have some error margin, the longitudinal trends are incredibly valuable. Your device can reliably tell you:
These trend-based insights are often more actionable than a debate over whether you got 72 or 78 minutes of REM sleep. They provide the feedback necessary to experiment with and improve your habits. For instance, establishing a science-backed nighttime routine for better sleep can directly improve these trend metrics, and a smart ring can give you the objective data to prove it.
Understanding that sleep tracking is a sophisticated estimate frees you from fixating on a potentially imperfect number and allows you to focus on the holistic story your sleep data is telling over time.
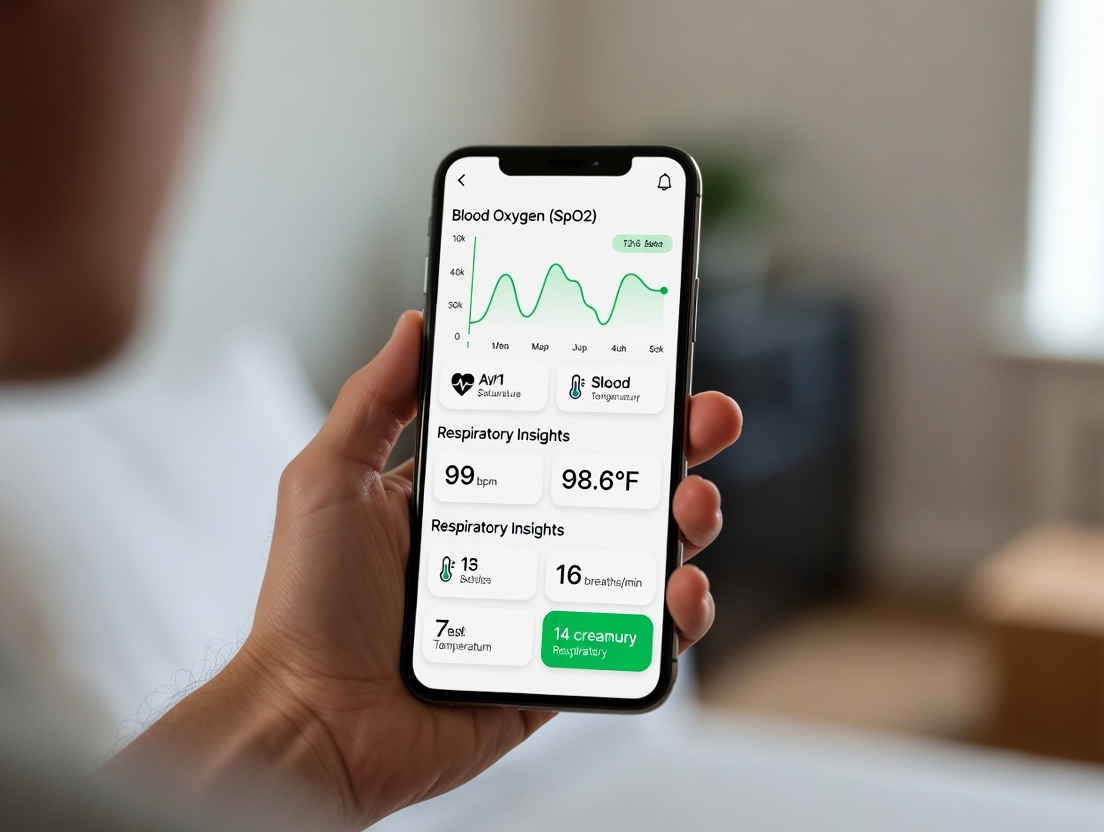
The COVID-19 pandemic brought pulse oximetry into the public lexicon. The ability to non-invasively estimate the oxygen saturation of your blood (SpO2) is a powerful medical tool. In consumer devices, it has found two primary applications: spot-check wellness and all-night trend monitoring.
The Technology & Its Limits
Consumer devices use the same basic PPG principle as medical oximeters: red and infrared light are absorbed differently by oxygenated and deoxygenated hemoglobin. However, medical devices are held perfectly still on a fingertip, often with a "spring-loaded" clip to ensure optimal perfusion. A wearable on a moving wrist or a loosely-fitted ring is at a fundamental disadvantage.
The Rise of Nocturnal SpO2 Monitoring
This is where the feature shines. Tracking SpO2 throughout the night can reveal patterns of sleep-related breathing disturbances, such as those seen in sleep apnea. The device isn't diagnosing apnea (which requires a formal sleep study), but it can flag frequent, significant desaturation events that warrant a conversation with a doctor.
Key metrics here include:
Similarly, respiration rate is typically derived not from a dedicated sensor, but from the rhythmic patterns in the PPG signal or the micro-movements of the chest/abdomen. Tracking its trend overnight is valuable; a consistently elevated respiratory rate can be a sign of sleep disruption or other issues.
For the health-conscious individual, these metrics transform the device from a sleep tracker into a broader nocturnal wellness sentinel. Noticing a correlation between poor sleep scores, high resting heart rate, and increased SpO2 disturbances could be the nudge needed to seek professional evaluation. It’s a perfect example of how consumer tech can serve as an early-warning system, directing you toward more precise, clinical-grade tools when necessary.
Perhaps no metrics are more emblematic of modern wellness tech than the composite "Stress" and "Recovery" scores. These are not direct physiological measurements like heart rate. They are algorithmically-derived indices, a fusion of multiple data streams into a single, digestible number meant to represent your body's systemic state.
Deconstructing the Stress Score
A typical stress score algorithm might continuously analyze:
The algorithm weighs these inputs against your personal baseline to output a score (e.g., 1-100) or a state ("Resting," "Stressed," "Focused"). The goal is to identify episodes of sympathetic nervous system activation that aren't explained by physical activity.
Recovery Scores: Looking Backward to Plan Forward
Recovery scores, often provided in the morning, are a retrospective analysis of your body's repair work. They typically factor in:
A high recovery score suggests you are physiologically prepared for strain (intense training, a demanding workday). A low score is a recommendation, explicit or implied, to prioritize restorative activities like light movement, meditation, or, as we've discussed, adhering to a minimal nighttime wellness routine with 5 essential steps to protect your recovery phase.
The Critical User Mindset
It is vital to view these scores as guides, not gospels. Their accuracy is a function of the underlying sensor data quality and the algorithmic assumptions. Their greatest power is in pattern recognition. If you see your stress score chronically elevated every weekday from 10 AM to 3 PM, you can investigate the environmental cause. If your recovery score is consistently low after poor sleep nights, it validates the connection and incentivizes better habits, like avoiding common nighttime routine mistakes that ruin your sleep.
These scores represent the pinnacle of a wearable's promise: to synthesize complex biology into simple, actionable feedback. Their validation is ongoing and personal—the most valid test is whether acting on them improves how you feel and perform.
A sensor is only as good as its connection to you. This is the most overlooked variable in the accuracy equation: the human factor. No algorithm can fully correct for poor signal acquisition.
Device Placement and Fit
This is non-negotiable. A wrist-based optical sensor must be snug—often tighter than you'd wear a traditional watch—to minimize motion and maintain consistent skin contact. This is one reason smart rings have a potential intrinsic advantage for certain metrics: the finger provides a strong, central blood supply, and a well-sized ring is naturally in constant, firm contact with the skin. For any wearable, following the manufacturer's fit guidelines is the first step to reliable data.
Anatomical and Demographic Variables
The "One Size Fits All" Challenge
This is the grand challenge of mass-market health tech: creating a single device and algorithm that works with high accuracy across a breathtakingly diverse human population. It’s an immense engineering and scientific undertaking. As a user, being aware that your unique biology interacts with the technology allows you to spot potential discrepancies. If a reading seems wildly off, consider factors like fit, temperature, and your own physiology before taking it as absolute truth.
Raw data is noise. The value of a health wearable is not in the individual data points it collects, but in the system of insight built around them. This system comprises the mobile app, the cloud-based analytics, and most importantly, you.
From Data Point to Data Trend
A single night of poor sleep is a bad night. A trend showing a 15% decrease in deep sleep over two weeks is a health signal. The most sophisticated part of your device isn't the hardware; it's the software that establishes your personal baselines over weeks of use and then flags meaningful deviations.
The Role of the App: Education and Context
A well-designed app doesn't just show charts; it provides contextual nudges. "Your recovery score is low today. Consider a lighter workout." "Your sleep was restless, and your skin temperature is elevated. You might be fighting something off." "You've been in a 'stressed' state for 90 minutes. Try a 1-minute breathing exercise." These insights bridge the gap between data and actionable behavior change.
This is where the internal logic of the ecosystem matters. A smart system will use correlated data to reinforce messages. For example, if it notices you consistently have higher readiness scores on days after you followed a wind-down ritual, it might proactively suggest you explore a perfect step-by-step nighttime wellness routine. This creates a virtuous cycle of experimentation and feedback.
The Human in the Loop
The ecosystem's final and most critical component is you, the user, applying judgment. The app might say "stress high," but you know you were just in a thrilling movie. It might flag "low HRV," but you know you had a glass of wine the night before, which is a known suppressor. This layer of phenotypic data—your own notes on diet, alcohol, stress, and feelings—is what transforms the device from a monitor into a true partnership for self-discovery.
Navigating the claims of health tech companies requires a basic understanding of the regulatory frameworks they operate within. This landscape defines what a device is legally allowed to tell you.
Medical Device vs. General Wellness Product
The core distinction is one of intended use.
Many wearable devices are dual-purpose. A smartwatch may have an FDA-cleared ECG app for AFib detection (a medical feature) alongside non-cleared sleep and stress tracking (wellness features). It is vital to know which features on your device fall into which category.
Decoding the Labels
What This Means For You
Understanding this landscape empowers you to set appropriate expectations. You can have high confidence in an FDA-cleared feature like an ECG for AFib detection. For a wellness feature like a stress score, you should view it as a sophisticated estimate based on physiological proxies, valuable for trend analysis but not for medical diagnosis. This framework helps you use each feature for its intended purpose: the medical tools for specific checks, and the wellness tools for holistic lifestyle guidance and early detection of patterns that merit professional consultation.
The quest for accuracy has spawned a ecosystem of form factors, each with inherent strengths and compromises. Understanding these trade-offs is key to choosing the right tool for your needs.
The Smartwatch: The Generalist
The Smart Ring: The Specialized Sentinel
The Chest Strap (ECG): The Accuracy Benchmark for Activity
The Holistic View: The Biometric Ecosystem
The most data-aware individuals often use an ecosystem. They might wear a smart ring 24/7 for baseline recovery, sleep, and readiness metrics, use a chest strap for high-intensity training sessions for perfect HR data, and have a smartwatch for daily convenience and notifications. This multi-device approach, while costly, captures the highest-fidelity data for each use case.
For most people, the choice comes down to priority: If detailed sleep, recovery, and continuous biomarker trends are your primary goal, a smart ring is a compelling choice. If real-time feedback, activity versatility, and smart features are key, a high-end smartwatch is ideal. There is no single "best" device, only the best device for your specific questions about your health.
Armed with an understanding of the technology, validation, and limitations, you are now equipped to move from a passive data recipient to an active data analyst. Here is a practical framework for building a trusting, productive relationship with your health monitor.
1. Establish Your Personal Baseline.
Ignore absolute numbers for the first 2-4 weeks. Wear the device consistently. Let it learn what is normal for you. This personal baseline is your most important reference point. All future insights will be deviations from this norm.
2. Conduct Your Own "N=1" Experiments.
Use the device to test hypotheses about your own behavior. This is the most powerful validation of all.
3. Look for Correlations, Not Isolated Numbers.
A single metric is a clue; a combination is a story.
4. Perform Spot Checks Against Reality.
When you feel calm, take a manual pulse and compare it to your device's reading. When you feel a clear stress response, note what your stress score shows. This "reality-check" calibration builds intuitive trust in what the device is reflecting.
5. Audit the Company's Transparency.
Revisit the company's website. Do they publish validation whitepapers? Do they openly discuss limitations? Do they have a scientific advisory board? A company invested in genuine health insight will lean into transparency, not hide behind marketing jargon.
By applying this framework, you demystify the device. It becomes a collaborative tool for self-experimentation. You learn when to heed its suggestions (a persistent low recovery trend) and when to dismiss an odd reading (a SpO2 dip while you slept on your hand). This critical partnership is the ultimate goal of modern health monitoring: not to outsource your health to an algorithm, but to use technology to deepen your own understanding of your body's unique language.
We are standing on the precipice of the next major leap in consumer health technology. The quest for accuracy is moving beyond refining individual sensors and toward a paradigm of sensor fusion and adaptive, personal calibration. The future device won't just measure; it will understand in context.
Beyond a Single Point of Measurement
The current model often relies on one primary sensor suite (on the wrist or finger). The future points to a distributed network of sensors, possibly across multiple devices, providing a more holistic physiological picture.
The Rise of the Calibrating Device
Imagine a device that doesn't just track, but learns and calibrates to you in real-time. Emerging concepts include:
Non-Invasive Blood Biomarkers: The Holy Grail
The frontier of research is the pursuit of continuous, non-invasive blood chemistry monitoring. Prototypes using spectroscopic techniques (Raman or NIR spectroscopy) aim to estimate glucose, lactate, hydration markers, and even certain electrolytes from the interstitial fluid just beneath the skin. While these are years from consumer readiness and face immense accuracy hurdles, they represent the ultimate goal: a true, lab-in-a-wearable.
For the user today, this evolving landscape means that the device you buy is not an endpoint, but a platform. The accuracy you experience can improve over time via software updates that incorporate new algorithmic learning. Choosing a device from a company with a robust R&D pipeline and a commitment to ongoing software innovation is an investment in future-proofing your access to precision.

All the sensor accuracy in the world is meaningless—or even harmful—if the human interpreting the data lacks the psychological framework to use it wisely. The final, and perhaps most crucial, component of the "accuracy question" isn't technological; it's behavioral and emotional.
From Data to Sustainable Action
The fundamental promise of these devices is behavior change. But data alone is rarely a sustainable motivator. The most effective health tech integrates principles of behavioral psychology:
The Dark Side: Orthosomnia and Data Anxiety
A new clinical term, "orthosomnia," has emerged to describe the paradoxical situation where the pursuit of perfect sleep data via trackers creates insomnia and anxiety. When the obsession with achieving a "perfect" sleep score generates performance anxiety at bedtime, the tool has backfired.
Similarly, constant vigilance over stress scores or HRV can lead to hyper-awareness and heightened anxiety about normal physiological fluctuations. This is a critical validation failure not of the sensor, but of the user interface and data presentation.
Cultivating a Healthy Data Relationship
To harness the power without the peril, adopt these mental models:
The most "accurate" use of a health monitor is one that improves your subjective quality of life, not one that enslaves you to an objective dashboard. It should feel like a supportive coach, not a demanding foreman. Finding this balance is the ultimate user skill, and it is the responsibility of both the individual and the technology companies to foster it through thoughtful design and education.
The data on your wellness app is not just numbers. It is a translation—an imperfect, yet incredibly valuable translation—of your body's native language. That language is spoken through biomarkers: measurable indicators of the state or condition of a biological system. To move from passive tracking to intelligent optimization, we must learn to understand what these biomarkers are fundamentally trying to tell us. This portion of our exploration delves into the core physiology behind the metrics, transforming you from a data collector into an insightful interpreter of your own biological story.
Every beat of your heart, every subtle shift in skin temperature, and every transition in your sleep is under the direct influence of a largely unconscious regulatory network: the Autonomic Nervous System (ANS). Think of the ANS as the master conductor of your body's orchestra, ensuring all sections play in harmony. It has two primary, opposing branches that create the dynamic tension behind nearly every biomarker your wearable measures.
The Sympathetic Nervous System (SNS): "Fight, Flight, or Freeze"
This is your body's accelerator pedal. It mobilizes energy for action. When activated (by stress, excitement, exercise, or danger), it:
The Parasympathetic Nervous System (PNS): "Rest, Digest, and Repair"
This is your body's brake and repair system. It promotes conservation, restoration, and growth. When dominant (during relaxation, meditation, and deep sleep), it:
The Dance of Homeostasis and Allostasis
The ANS isn't about one branch being "good" and the other "bad." Health is the dynamic balance between them—the ability to ramp up a strong SNS response when needed (to crush a workout or meet a deadline) and then efficiently downshift into a deep PNS state for recovery. This ideal balance is homeostasis.
However, modern life often forces allostatic load: chronic, repeated activation of the SNS without sufficient PNS recovery. This is the state of persistent stress that wears down systems. Your wearable's metrics—chronically elevated resting heart rate, suppressed HRV, poor sleep scores, and high stress readings—are the direct financial statements of this allostatic load.
By framing your data through the lens of ANS balance, the numbers gain profound meaning. A low HRV score isn't a "bad grade"; it's a signal that your sympathetic nervous system has been dominant for too long, and it's time to consciously engage the parasympathetic branch. This is where actionable insights, like the practices outlined in our guide on nighttime wellness rituals that take less than 30 minutes, become not just habits, but direct physiological interventions to restore balance.
HRV has emerged as the superstar biomarker of the wellness tech world, and for good reason. But its complexity is often lost in the pursuit of a single, higher number. Let's deconstruct what HRV truly represents.
The Physiology: Why Does the Heartbeat Vary?
Contrary to old beliefs, a healthy heart is not a perfect metronome. The tiny, millisecond variations between beats are a sign of a heart that is listening and responding to the body's needs in real-time. This is primarily mediated by the constant "tug-of-war" between the SNS and PNS on the sinoatrial node (the heart's natural pacemaker).
A high HRV indicates a heart that is responsive to both systems—it can accelerate and decelerate with agility. This cardiac flexibility is a proxy for systemic resilience.
Understanding the Metrics: Time Domain vs. Frequency Domain
Your app might show you RMSSD, SDNN, or LF/HF ratio. These are different mathematical ways to slice the HRV data:
How to Use HRV Practically: The Rule of Thirds
Obsessing over daily HRV is a recipe for orthosomnia. Instead, use this practical framework:
HRV is not a performance score to maximize; it's a recovery status indicator to listen to. Honoring its signals is one of the most powerful ways to use wearable data to prevent burnout and overtraining.
Sleep is not a uniform state of unconsciousness. It is an active, highly structured physiological process essential for repair, memory consolidation, and metabolic health. Your wearable's sleep stages are an algorithmic guess at this architecture. Knowing what each stage is for helps you understand the "why" behind your scores.
The Sleep Cycle: A 90-Minute Journey
Throughout the night, you progress through repeated cycles, each lasting roughly 70-120 minutes. A full night consists of 4-6 of these cycles.
What Your Wearable is Actually Detecting
Since your ring or watch lacks an EEG, it uses proxies:
Optimizing for Sleep Architecture
The goal isn't to maximize one stage at the expense of others. It's to get sufficient, uninterrupted cycles so each stage can perform its function.
Your biology doesn't run on a simple 24-hour on/off switch. It is governed by a profound, endogenous timekeeping system: your circadian rhythm. This ~24-hour cycle, orchestrated by a "master clock" in the brain's suprachiasmatic nucleus (SCN), regulates everything from hormone release and metabolism to body temperature and sleep-wake propensity. Your wearable tracks the outputs of this clock; aligning your life with its tempo is a master key to health.
Core Body Temperature Rhythm: The Prime Circadian Signal
One of the most robust circadian outputs is core body temperature (CBT). It follows a predictable wave:
Your wearable's skin temperature sensor tracks the peripheral echo of this rhythm. A well-defined, predictable nightly dip is a sign of a robust, synchronized circadian rhythm. A blunted or erratic temperature rhythm can signal circadian misalignment—a state linked to poor sleep, metabolic dysfunction, and impaired recovery.
Cortisol and Melatonin: The Hormonal Yin and Yang
The SCN uses light information from the eyes to synchronize the rhythm and direct the release of key hormones:
Circadian Disruption: The Modern Mismatch
Our modern environment is a minefield of circadian disruptors: bright screens at night, irregular meal times, late-night eating, and inconsistent sleep schedules. This creates social jet lag—a mismatch between your internal biological clock and your external social clock.
Your wearable data reveals this disruption through:
Harnessing Wearable Data for Circadian Alignment
You can use your data to become a circadian architect:
By viewing your wearable not just as a sleep tracker but as a circadian rhythm monitor, you gain insights into the foundational timing of your biology. Optimizing this rhythm is arguably the highest-leverage action you can take for long-term health, and your device provides the daily feedback to do it.
While often overlooked, continuous skin temperature tracking is a quiet powerhouse of predictive health insight. Unlike a fever thermometer, it's not about a single absolute number, but about deviations from your personal baseline trend. These deviations can tell several compelling stories.
The Menstrual Cycle Signature
For individuals with ovulatory menstrual cycles, basal body temperature (BBT) tracking has long been used to identify fertile windows. Wearable skin temperature provides a modern, automated version of this.
The Illness Signature
One of the most valuable applications is early illness detection. Before you feel symptomatic, your body begins its immune defense, which often involves creating a less hospitable environment for pathogens—a fever.
The Overtraining/Under-Recovery Signature
Similarly, when you are imposing more training stress than your body can recover from, it creates a state of systemic inflammation.
How to Use Temperature Data
In this way, skin temperature transforms your wearable from a retrospective journal into a prospective early-warning system, giving you a precious head start to support your body's innate defenses.
While we are often unaware of it, our breathing tells a vital story about our health, especially during sleep. Respiratory rate (RR) and blood oxygen saturation (SpO2) are two interconnected "vital signs" that, when monitored continuously, reveal the quality of our respiration and its impact on systemic restoration.
Respiratory Rate: The Silent Metric
Respiratory rate is typically derived from the cyclical patterns in the PPG signal (each breath causes subtle changes in blood pressure and heart rate) or from micro-movements.
Blood Oxygen Saturation (SpO2): The Oxygen Delivery Gauge
This metric estimates the percentage of hemoglobin in your blood that is carrying oxygen.
The Story of Sleep-Disordered Breathing
Together, these metrics paint a picture of nocturnal respiration. The classic signature of obstructive sleep apnea (OSA) is a sawtooth pattern: repetitive SpO2 dips followed by recoveries, often accompanied by spikes in heart rate as the body arouses briefly to resume breathing. While a consumer device cannot diagnose sleep apnea, it can flag a high probability pattern:
Actionable Insights for Everyone
Even without sleep apnea, these metrics are valuable:
For the health-conscious individual, these metrics add a crucial layer to the sleep picture. They move the analysis beyond "how long" and "what stages" to "how well did my body perform its basic life-sustaining functions during rest?" They are the ultimate test of the sleep environment's suitability and the body's resilience.
Viewing biomarkers in isolation leads to a fragmented and often confusing picture. The true power of continuous monitoring emerges when we see them as an interconnected web, a dynamic system where a change in one node ripples through all the others. This systems-biology perspective is where deep, personalized insight lives.
The Classic Stress/Recovery Cascade
Imagine a week of intense work deadlines (psychosocial stress). Here’s how the web might react:
The Positive Intervention Cascade
Now, imagine you intervene by instituting a strict, calming evening routine. The cascade reverses:
Identifying Root Causes Through Correlation
This interconnected view helps you play detective. For example:
By learning to read the web of data, you stop chasing single metrics and start supporting the entire system. You understand that taking a rest day (to improve HRV/RHR) will also improve that night's sleep, which will further improve next day's recovery—a virtuous cycle. Your wearable becomes a dashboard for your entire biological terrain, allowing you to nurture its balance.
Your Trusted Sleep Advocate: Sleep Foundation — https://www.sleepfoundation.org
Discover a digital archive of scholarly articles: NIH — https://www.ncbi.nlm.nih.gov/
39 million citations for biomedical literature :PubMed — https://pubmed.ncbi.nlm.nih.gov/
Experts at Harvard Health Publishing covering a variety of health topics — https://www.health.harvard.edu/blog/
Every life deserves world class care :Cleveland Clinic - https://my.clevelandclinic.org/health
Wearable technology and the future of predictive health monitoring :MIT Technology Review — https://www.technologyreview.com/
Dedicated to the well-being of all people and guided by science :World Health Organization — https://www.who.int/news-room/
Psychological science and knowledge to benefit society and improve lives. :APA — https://www.apa.org/monitor/
Cutting-edge insights on human longevity and peak performance:
Lifespan Research — https://www.lifespan.io/
Global authority on exercise physiology, sports performance, and human recovery:
American College of Sports Medicine — https://www.acsm.org/
Neuroscience-driven guidance for better focus, sleep, and mental clarity:
Stanford Human Performance Lab — https://humanperformance.stanford.edu/
Evidence-based psychology and mind–body wellness resources:
Mayo Clinic — https://www.mayoclinic.org/healthy-lifestyle/
Data-backed research on emotional wellbeing, stress biology, and resilience:
American Institute of Stress — https://www.stress.org/

