The Science Behind Wellness Ring Basics: Sensors and Algorithms
Explores how the combination of hardware sensors and software algorithms work together to generate health insights.
Explores how the combination of hardware sensors and software algorithms work together to generate health insights.
In the quiet moments of your day—as you type, drive, or simply breathe—a revolution in personal health is unfolding on your finger. The modern wellness ring, a device so discreet it borders on invisible, is collecting a torrent of biological data, transforming raw signals from your body into actionable insights about your sleep, stress, recovery, and overall vitality. This is not mere step-counting or passive monitoring; it is a continuous, intelligent dialogue between you and your own physiology. But how does this sleek piece of wearable technology accomplish such a feat? The magic lies in a sophisticated symphony of sensors and algorithms, the unsung heroes working tirelessly beneath a minimalist exterior.
This article peels back the polished titanium or ceramic surface to explore the core science that powers your wellness ring. We will journey from the precise physics of optical heart rate monitoring to the complex, decision-making mathematics of machine learning algorithms. You’ll discover how light is used to measure your blood’s pulse, how tiny temperature changes speak volumes about your metabolic health, and how motion data is scrubbed clean of daily noise to reveal the pure signal of your rest. More importantly, we will demystify how these disparate streams of data are woven together into coherent scores and recommendations, moving from simple measurement to meaningful interpretation.
Understanding this science is not an academic exercise. It empowers you to become an informed partner in your health journey, to interpret your data with context, and to leverage this technology to its fullest potential. It transforms the ring from a black box of outputs into a transparent window into your well-being. So, let’s begin at the most fundamental level: the remarkable sensors that give your wellness ring its vision into the inner workings of your body.

At the very heart of every advanced wellness ring lies a technology called photoplethysmography, or PPG. While the acronym may sound complex, the underlying principle is elegantly simple: using light to measure blood volume changes in the microvascular bed of tissue just beneath your skin. When your heart beats, it pumps a surge of oxygenated blood through your arteries. This momentary increase in blood volume slightly alters the density and color of the tissue in your finger. A fraction of a second later, as the heart relaxes, the blood volume recedes.
The PPG sensor in your ring exploits this physiological phenomenon. It consists of at least one miniature light-emitting diode (LED) that shines light—typically green light—into the skin of your finger, and a photodetector that measures the amount of light that is reflected back. Here’s the critical part: blood absorbs light more effectively than the surrounding tissue. Therefore, when there is more blood in the capillaries (during a heartbeat), less light is reflected back to the sensor. When blood volume decreases (between heartbeats), more light is reflected.
The photodetector captures these minute, rhythmic fluctuations in reflected light intensity, producing a wavelike signal called a photoplethysmogram. This waveform is the primary raw data treasure trove. Its peaks correspond to heartbeats, allowing for the direct calculation of heart rate (HR). The time interval between consecutive peaks, known as the inter-beat interval (IBI), is the foundation for calculating heart rate variability (HRV)—a profound metric of nervous system balance and recovery status. Furthermore, the subtle shape and amplitude of the PPG waveform contain clues about blood pressure changes, vascular health, and even the oxygen saturation of your blood, leading to peripheral blood oxygen (SpO2) estimates.
However, obtaining a clean PPG signal from a finger is a formidable engineering challenge. The finger is a dynamic environment. Every hand gesture, grip, or tap introduces motion artifacts—noise that can completely obscure the delicate blood volume pulse. This is why early PPG devices like chest straps or finger clips required you to be still. The wellness ring’s genius lies in its continuous operation amidst this noise. Advanced rings combat this with multi-LED setups (often using green, red, and infrared wavelengths for different purposes), sophisticated sensor arrays to find the best signal, and, most crucially, powerful algorithms that we will explore later, which act as digital sieves to separate the biological signal from the movement noise. This relentless pursuit of a clean signal is what enables 24/7 monitoring, turning sporadic snapshots into a full-motion picture of your cardiovascular system.
If the PPG sensor listens to the rhythm of your blood, the 3-axis accelerometer maps the choreography of your entire body through the micro-movements of your finger. This sensor, a microscopic electromechanical device, measures proper acceleration—the rate of change of velocity relative to freefall. In practical terms, it detects movement along three spatial dimensions: up-down (X), side-to-side (Y), and forward-backward (Z).
In the context of a wellness ring, the accelerometer’s role is multifaceted and indispensable. Its most recognizable function is activity tracking. By analyzing the magnitude and frequency of acceleration signals, algorithms can classify your movement into categories: sedentary, walking, running, cycling, or other exercises. It estimates step count, distance traveled, and calories expended by translating finger motion into whole-body kinetics through complex metabolic equivalency (MET) models.
Yet, its most critical application for holistic wellness is in the domain of sleep analysis. During sleep, your body is not truly still. The accelerometer detects the gross body movements of turning over, as well as the finer, cyclic movements associated with breathing. This data is paramount for sleep staging. For instance, periods of very low movement coupled with a stable respiratory signal suggest deep sleep. Periods of higher, frequent small movements with irregular breathing often indicate REM sleep. Lighter sleep stages fall somewhere in between. By tracking movement patterns throughout the night, the ring constructs a detailed sleep architecture profile, determining not just how long you slept, but crucially, how well you slept across different restorative phases.
Furthermore, the accelerometer is the primary tool for detecting periods of rest and non-rest. It helps contextualize PPG data; a high heart rate during high motion is expected (exercise), while a high heart rate during minimal motion (as indicated by the accelerometer) could be a sign of stress, illness, or poor recovery. This sensor synergy is key. The accelerometer also enables features like automatic exercise detection, sedentary reminders, and even specific gesture controls. It provides the essential "when" and "what" context—when you were active or at rest, and what you were doing—that gives meaning to the "how" data provided by the PPG sensor about your internal state. For a deeper understanding of how these movement and physiological patterns coalesce into a single metric, you can explore how your sleep score reflects total body recovery.
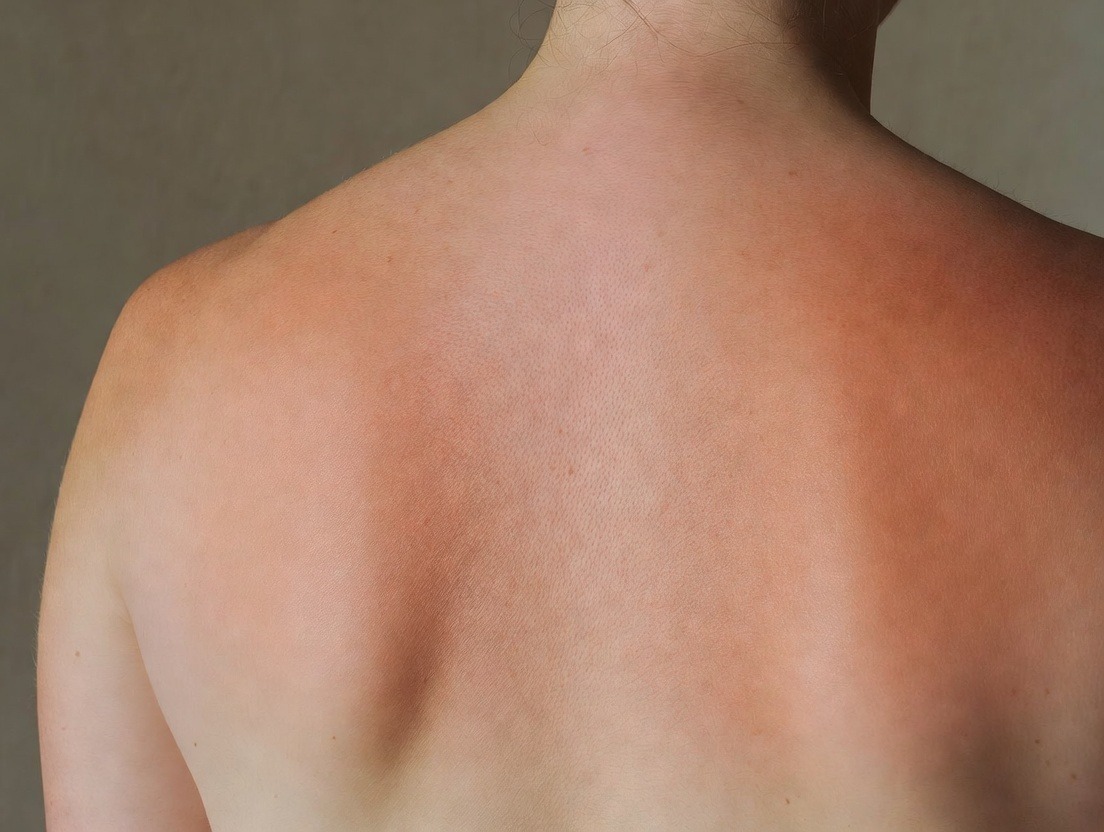
While your heart rate and movement tell a compelling story, they often describe the symptoms of your body’s state. The skin temperature sensor, however, provides a more direct window into the engine room: your core physiology and metabolic processes. It measures the temperature at the surface of your skin, typically on the palmar side of your finger, which is a sensitive proxy for changes in your body’s internal thermal regulation.
It’s vital to understand that this sensor tracks relative changes in temperature, not your absolute, clinical body temperature. Your baseline skin temperature is unique to you, influenced by ambient conditions, clothing, and individual biology. The power of this metric lies in its nightly trend. As you fall asleep, your body initiates a process called nocturnal distal vasodilation. To facilitate core cooling—a prerequisite for deep sleep—your body sends warm blood to the extremities, like your hands and feet. This causes a measurable rise in skin temperature at the finger as you transition into sleep. Conversely, a failure to exhibit this temperature rise is often correlated with difficulty falling asleep or poor sleep quality.
Beyond sleep initiation, the longitudinal tracking of overnight skin temperature is a goldmine of information. A sustained elevation above your personal baseline can be one of the earliest and most reliable indicators of onsetting illness, infection, or inflammation, as your body mounts a fever response. For women, tracking the subtle biphasic pattern of temperature shifts across the menstrual cycle can provide insights into ovulation and hormonal phases, offering a natural, physiological method of cycle tracking. Furthermore, skin temperature trends are intimately linked to metabolic rate and recovery. After intense physical exertion, the body’s repair processes can generate heat, reflected in a higher nocturnal temperature, signaling that your system is actively recovering.
The temperature sensor adds a crucial layer of metabolic and autonomic context. A high HRV is generally positive, but if it’s coupled with an unusually low or high skin temperature, it might tell a different story about stress or immune activity. By monitoring this quiet, rhythmic flux of heat from your body, the wellness ring gains insight into the subtle, often silent, processes of healing, adaptation, and hormonal balance that define true wellness from the inside out.
Sensors are the data gatherers, the tireless reporters feeding bits of information—light intensity, movement vectors, temperature millidegrees—into the system. But this raw data, on its own, is a cacophony of signals, filled with noise, artifacts, and isolated facts. The true intelligence of a wellness ring, what transforms it from a simple biometric recorder into a health companion, resides in its algorithms. These are the sophisticated sets of rules and mathematical models that clean, interpret, and synthesize the sensor data into the meaningful scores and insights you see on your app.
The first and most critical algorithmic layer is signal processing. This is the digital janitorial service. The PPG signal from your moving hand is messy. Algorithms employ techniques like digital filtering (e.g., bandpass filters to isolate the typical 0.5-5 Hz frequency of a heartbeat) and adaptive noise cancellation to suppress motion artifacts. They identify and reject corrupted signal segments, seeking out clean "windows" of data for analysis. The accelerometer data is similarly processed to distinguish intentional movement from vibrational noise.
Once the signals are clean, feature extraction algorithms go to work. They scan the processed data to identify key characteristics or "features." From the PPG waveform, they extract the precise timing of each heartbeat peak (for HR and HRV), the waveform amplitude and shape (for SpO2 and perfusion index). From the accelerometer data, they extract movement magnitude, periodicity, and patterns characteristic of different activities or sleep stages. From the temperature stream, they extract the rate of change and deviation from a personal rolling baseline.
Finally, these extracted features are fed into higher-order classification and regression models. This is where machine learning often comes into play. For sleep staging, a model trained on thousands of hours of polysomnography (the clinical gold standard) data learns to map combinations of movement, heart rate, HRV, and temperature features to the probabilities of being in Wake, Light, Deep, or REM sleep. For Readiness or Recovery Scores, a model might weigh features like overnight HRV, resting heart rate, sleep duration, and temperature deviation to output a single number that represents your body’s capacity for stress. These models are not static; the best ones continuously personalize, learning your unique baselines and patterns over time, making their insights increasingly relevant to you as an individual. To see how these algorithms track your progress over the long term, consider the insights from the sleep score journey tracking improvement over months.
Of all the metrics derived from a wellness ring, Heart Rate Variability (HRV) is arguably the most profound and insightful. Contrary to what one might assume, a healthy heart does not beat with the monotonous regularity of a metronome. Instead, there is a subtle, millisecond-level variation in the time interval between consecutive heartbeats. This variation, HRV, is a direct window into the dynamic interplay between your two branches of the autonomic nervous system: the sympathetic ("fight-or-flight") and the parasympathetic ("rest-and-digest").
Here’s the science: when you are stressed, anxious, or actively exerting yourself, the sympathetic nervous system dominates. It prompts the heart to beat more steadily and rapidly, reducing variability. When you are relaxed, recovered, and in a state of safety, the parasympathetic nervous system—primarily via the vagus nerve—exerts more influence, introducing more variability between beats. Thus, a higher HRV (within a normal, healthy range) generally indicates stronger parasympathetic tone, better resilience, and greater physiological capacity to handle stress. A lower HRV suggests sympathetic dominance, which can be due to acute stress, overtraining, poor sleep, or illness.
Wellness rings calculate HRV from the sequence of inter-beat intervals derived from the PPG sensor. The most common method used in consumer devices is the Root Mean Square of Successive Differences (RMSSD), which is particularly good at capturing the short-term, parasympathetic influence on the heart. This value, measured in milliseconds, is typically averaged over the night to provide your "nighttime HRV," which is considered the most stable and reliable reading, free from the acute influences of daytime activity.
Interpreting HRV requires a personal, longitudinal view. Comparing your number to someone else’s is meaningless, as HRV is highly individual, influenced by age, genetics, and fitness. The power is in tracking your own trends. A steady or rising trend in your baseline HRV suggests you are recovering well and adapting positively to your lifestyle. A significant dip, especially for several consecutive nights, is a clear biometric flag that your body is under strain—whether from physical overreaching, emotional stress, dehydration, or an impending cold. It is your body’s most honest signal asking for rest. By paying attention to this metric, you can learn to pace your training, manage your stress, and prioritize recovery before symptoms of fatigue or burnout manifest. This foundational understanding of nervous system balance is a cornerstone of the philosophy behind restful living for busy professionals through micro-recovery throughout the day.

Sleep is not a uniform state of unconsciousness. It is a dynamically cycling process of distinct stages, each with unique physiological signatures and restorative functions. The wellness ring’s ability to approximate these stages—Light, Deep, and REM sleep—without wires or clinical labs, is one of its most valuable feats of algorithmic engineering.
The ring’s sleep staging algorithm is a multi-sensor fusion masterpiece. It takes the features extracted from the PPG, accelerometer, and temperature sensors and uses them to emulate the scoring rules a sleep technician would use with lab-grade polysomnography (PSG).
By piecing together these biometric clues throughout the night, the ring constructs your personal sleep architecture. The cyclical pattern of these stages is as important as their totals. A healthy sleep cycle typically progresses from light to deep to REM, repeating every 70-120 minutes. Disruptions to this rhythm, such as frequent awakenings that reset the cycle or a lack of deep sleep early in the night, are key indicators of poor sleep quality that the ring can identify. This granular view moves you beyond simple duration tracking, allowing you to understand why you might feel unrested even after eight hours in bed. To learn how the industry defines quality sleep, you can read about sleep score standards and what research says is healthy.
After a night of data collection, you are presented with a single, composite score—often called a Readiness, Recovery, or Energy Score. This number is the ultimate expression of the ring’s analytical power, a holistic synthesis of multiple biomarkers into one intuitive metric. It answers the fundamental question: "Based on last night’s data, how prepared is my body to handle physical, mental, and emotional stress today?"
This score is not a simple average. It is the output of a proprietary algorithm that weights and balances various inputs, typically including:
The algorithm considers the interplay between these factors. For example, a great night of sleep might be slightly discounted if your HRV was low, suggesting your nervous system is still under strain. Conversely, a moderately short sleep night with exceptionally high HRV and low RHR might still yield a respectable score, indicating your body efficiently achieved deep recovery.
Using this score as a daily guide represents a paradigm shift in self-care. Instead of pushing through fatigue based on a calendar or arbitrary plan, you can let your physiology guide your decisions. A high score is a green light for intense training, important meetings, or social engagements. A low score is a yellow or red light, advising you to prioritize rest, opt for lighter movement like walking or yoga, manage stress, and hydrate. It is a tool for sustainable performance, helping you align your daily demands with your body’s actual capacity, thereby preventing the chronic overreaching that leads to burnout and injury.
A comprehensive picture of wellness requires balancing the inward focus of recovery with the outward expression of activity. Wellness rings have evolved far beyond simple step counters; they now provide intelligent, contextual insights into your daily movement and exercise through a combination of sensor data and smart algorithms.
Automatic Workout Detection is a key feature. The accelerometer and PPG sensor work in tandem to identify periods of sustained, elevated activity. The algorithm looks for a threshold breach in heart rate and movement amplitude that persists for several minutes. Once detected, it begins to classify the activity type. The specific signature of the motion—the frequency of steps (for running vs. walking), the absence of step-like patterns but presence of rhythmic movement (for cycling or elliptical), or the specific arm swing pattern—helps label the workout. During these detected sessions, the ring samples data at a higher frequency to provide more accurate metrics like average heart rate, heart rate zones, estimated calorie burn, and duration.
Perhaps more innovatively, rings now track Non-Exercise Activity Thermogenesis (NEAT)—the calories you burn from everything that is not sleeping, eating, or sports-like exercise. This includes walking to your car, typing, gardening, and fidgeting. NEAT is a major contributor to daily metabolic rate and overall health. By continuously monitoring low-level movement throughout the day, the ring can encourage you to break up prolonged sedentary periods, a well-documented health risk.
This activity data is not siloed. It is integrated into the holistic wellness model. A day of intense activity will provide context for that night’s recovery metrics. The ring’s algorithms will expect—and account for—a potential elevation in resting heart rate and skin temperature, and a possible dip in HRV, as normal responses to training stress. This prevents the misinterpretation of these signals as purely negative. Instead, it frames them as expected parts of an adaptation cycle. The goal is not to minimize all stress, but to apply the right stress (activity) and then provide adequate recovery, creating a positive feedback loop for fitness and health. This balanced approach is a practical application of the principles found in how to balance productivity with restful living.
Monitoring peripheral blood oxygen saturation (SpO2) has moved from a clinical tool to a mainstream wellness metric, thanks to its integration into devices like smart rings. The principle, again, relies on PPG. Hemoglobin—the protein in red blood cells that carries oxygen—absorbs light differently depending on whether it is oxygenated (oxyhemoglobin) or deoxygenated (deoxyhemoglobin). Oxygenated hemoglobin absorbs more infrared light and allows more red light to pass through. Deoxygenated hemoglobin does the opposite.
Advanced rings use a combination of red and infrared LEDs. By analyzing the ratio of absorbed red to infrared light across the pulsating (arterial) portion of the PPG signal, the algorithm can estimate the percentage of hemoglobin that is oxygenated—your SpO2%. A normal, healthy reading at sea level is typically between 95% and 100%.
While a single spot check is of limited value, nocturnal SpO2 monitoring is incredibly powerful. During sleep, especially during REM when muscle tone is lowest, breathing can become shallow or briefly pause (an event called an apnea). These events cause temporary dips in blood oxygen. By tracking SpO2 throughout the night, the ring can identify the frequency and depth of these dips, providing a screening-level insight into your breathing regularity. Frequent, significant desaturations may suggest sleep-disordered breathing, such as sleep apnea, prompting you to seek professional evaluation.
Furthermore, the ring derives respiratory rate—the number of breaths you take per minute—directly from the PPG signal. With each breath, intrathoracic pressure changes, subtly affecting blood flow back to the heart. This creates a low-frequency modulation in the PPG waveform amplitude, which algorithms can isolate and count. Respiratory rate is a vital sign; an elevated resting or sleeping respiratory rate can be an early indicator of cardiac stress, respiratory issues, or anxiety.
Together, SpO2 and respiratory rate add a critical cardiorespiratory dimension to the ring’s profile of your health. They move monitoring beyond fitness and recovery into the realm of fundamental physiological vigilance, offering peace of mind or an early nudge toward deeper investigation.
Your body operates on a 24-hour internal clock known as the circadian rhythm, governing cycles of alertness, hormone release, digestion, and sleep. While light exposure is the primary "zeitgeber" (time-giver) for this clock, core body temperature is one of its most reliable physiological outputs. Your core temperature naturally dips to its lowest point in the early morning hours (around 4-5 AM) and rises throughout the day, peaking in the early evening. The preparatory drop in core temperature, facilitated by releasing heat through the extremities, is a direct signal that promotes sleep onset.
The wellness ring’s skin temperature sensor, by tracking the timing and magnitude of the nocturnal temperature rise at your finger, provides a unique proxy for assessing the phase and amplitude of your circadian rhythm. A consistent, well-defined evening rise and overnight plateau suggest a robust, well-entrained rhythm. A blunted, delayed, or erratic temperature curve, however, can indicate circadian misalignment—such as that caused by shift work, frequent jet lag, or inconsistent sleep schedules.
This data is transformative for habit formation. By correlating your daily behaviors (meal times, evening light exposure, caffeine intake, bedtime) with your nocturnal temperature profile, you can experiment to see what truly helps or hinders your biological clock. You might discover that a late dinner delays your temperature rise, pushing back sleepiness. Or, that morning sunlight advances and strengthens the rhythm. This empowers you to move beyond generic sleep hygiene advice and create a truly personalized schedule for optimal energy and rest. It aligns perfectly with the goal of designing restful living spaces for calm and restoration, where your environment supports your natural biological rhythms.
The most advanced sensor array and the most clever generic algorithm are of limited use if they don’t understand you. This is why personalization is the final, crucial layer of a sophisticated wellness ring. Unlike a medical device that compares you to a population average, a wellness ring’s goal is to compare you to yourself.
From the moment you put it on, the ring begins a baseline establishment period, typically lasting 1-2 weeks. During this time, its algorithms are not just collecting data; they are learning. They calculate your average resting heart rate, your typical HRV range, your normal skin temperature flux, and your unique sleep architecture patterns. These personal baselines become the critical reference point against which all future deviations are measured.
This is why a single day’s data point is often less meaningful than the trend. A heart rate of 55 BPM might be high for one person and low for another. But if your heart rate is 10 BPM above your 30-day rolling average, the algorithm flags it as a significant deviation worthy of attention. This personalized modeling allows the ring to become increasingly accurate and relevant over time. It can learn that you naturally have a lower HRV than the textbook "ideal" but are perfectly healthy, or that your temperature reliably rises two nights before a menstrual cycle begins.
This learning system turns the ring into a true companion. Its notifications become more precise. It can distinguish between a normal post-workout elevation in resting heart rate and an unusual elevation that might indicate illness. It can recognize when your data is deviating from your norm due to travel, stress, or alcohol, and adjust its feedback accordingly. This continuous feedback loop—where your behaviors influence the data, and the interpreted data informs your future behaviors—is the essence of a quantified self-journey. It fosters a deeper, more intuitive connection with your own body, empowering you to make incremental, data-informed choices that compound into significant, lasting improvements in your overall well-being. This journey of self-awareness and adjustment is at the core of adopting the restful living mindset: shifting from doing to being.
We have now explored the fundamental sensors and core algorithms that transform a simple band of metal into a personal health observatory. But the science does not stop at measuring individual metrics. The true frontier of wellness ring technology lies in what happens when these disparate data streams are not just analyzed in parallel, but woven together into a coherent, multidimensional tapestry. This process, known as multi-sensor fusion, is where isolated signals become a holistic story, and where new, derivative biomarkers—deeper indicators of health—are born. It represents the evolution from a biometric recorder to a predictive health companion.
Imagine your nervous system on a stressful day. Your PPG sensor might show an elevated resting heart rate and a depressed HRV. Your accelerometer shows you fidgeting more but engaging in less purposeful movement. Your skin temperature might be slightly elevated from baseline due to stress hormones. Viewed separately, each could have multiple explanations. But when fused algorithmically, the convergence of these signals creates a high-confidence picture of psychophysiological stress. The ring isn't just guessing you're stressed because you selected a mood tag; it's detecting the physiological symphony of stress in real-time. This fusion is the key to moving from correlation to causation in personal analytics, allowing the device to provide context-aware insights, such as suggesting a breathing exercise when it detects the tell-tale signs of acute stress despite you being physically still.
This integrated data model also enables the discovery of complex biomarkers that no single sensor could reveal. One prime example is nocturnal cardiovascular coupling—the intricate dance between your heart and your breath during sleep. In deep sleep, this coupling is strong and regular: your heart rate subtly rises with each inhalation and falls with each exhalation, a phenomenon known as respiratory sinus arrhythmia. During disturbed sleep or in the presence of sleep disorders, this synchrony breaks down. By fusing the precise heartbeat timing from the PPG with the respiratory rate derived from either the PPG waveform or the accelerometer's micro-movements, algorithms can quantify the strength of this coupling, creating a powerful new metric for sleep quality and autonomic nervous system health that is more sensitive than heart rate or breathing rate alone.
While green light LEDs are the workhorse for PPG-based heart rate and HRV tracking due to their strong absorption by blood and good performance for superficial capillaries, advanced rings are incorporating additional wavelengths to expand their diagnostic and monitoring capabilities. The introduction of red and infrared (IR) light PPG sensors marks a significant leap forward, enabling more accurate blood oxygen tracking and providing a different physiological view.
The choice of wavelength is a matter of physics and physiology. Green light (~500-570nm) is highly absorbed by hemoglobin, making it excellent for detecting the high-frequency pulsatile blood flow in the shallow arterioles. However, it doesn't penetrate tissue as deeply. Red (~660nm) and Infrared (~850-940nm) light penetrate tissue more effectively, reaching deeper blood vessels. Crucially, as mentioned earlier, oxygenated and deoxygenated hemoglobin absorb these wavelengths differently. By using a multi-wavelength PPG sensor (often combining green, red, and IR LEDs), the ring can perform pulse oximetry.
The algorithm compares the pulsatile component of the red and IR light absorption. The ratio of these absorbed signals changes based on oxygen saturation, allowing for the calculation of SpO2%. This multi-wavelength approach also improves signal reliability. Different skin tones, tattoo pigment, and finger tissue composition can affect light absorption. Having multiple wavelengths provides redundancy; if the green signal is noisy due to motion or placement, the red or IR signal might remain clean, allowing the algorithms to maintain a continuous heart rate reading. Furthermore, deeper-penetrating IR light can provide a better signal from individuals with poorer peripheral circulation or in colder environments where superficial blood flow is reduced. This multi-spectral approach future-proofs the device for more advanced blood composition analysis that may emerge from ongoing research.
While not yet ubiquitous in rings, Electrodermal Activity (EDA)—also known as Galvanic Skin Response (GSR)—represents the next frontier for direct stress and emotional arousal monitoring. EDA measures subtle changes in the electrical conductivity of your skin, which is governed by the activity of your sweat glands. These glands are controlled solely by the sympathetic nervous system, our "fight-or-flight" branch.
When you experience stress, excitement, anxiety, or cognitive load, your brain triggers a sympathetic response, causing the sweat glands on your palms and fingers to fill with saline fluid. This increases skin conductivity, which is measured as a spike in the EDA signal. Unlike heart rate, which can be elevated by both stress and exercise, a spike in EDA while you are physically at rest (as confirmed by the accelerometer) is a much more specific indicator of emotional or sympathetic nervous system arousal.
Integrating a micro EDA sensor into a ring form factor is challenging due to the need for stable, continuous contact with two separate electrodes on the skin. However, the potential is immense. It would allow the ring to:
When fused with HRV (a measure of parasympathetic activity) and heart rate, EDA completes the autonomic picture. High heart rate + Low HRV + High EDA = a state of high sympathetic tone and low recovery capacity. This trio of metrics could power hyper-personalized stress interventions, nudging you with a breathwork prompt the moment your physiology indicates you're entering a stress spiral, even before you cognitively recognize it. This aligns with the science of managing chronic stress, detailed in resources on how restful living reduces chronic stress and burnout.
Within the ring's processor, two primary philosophical approaches govern how raw data becomes insight: heuristic (rule-based) algorithms and machine learning (ML) models. Understanding the distinction is key to interpreting your data with appropriate nuance.
Heuristic models are built on a foundation of established medical and physiological knowledge. Programmers codify explicit rules. For example: "IF movement is below threshold X for 5 minutes AND heart rate drops below daily resting average AND temperature begins to rise, THEN classify state as 'Sleep Onset.'" These rules are transparent, auditable, and based on decades of research. They are excellent for well-understood tasks like basic heart rate calculation or activity classification. Their strength is consistency and explainability; you can theoretically trace back why a certain classification was made.
Machine learning models, particularly deep learning neural networks, take a different approach. Instead of being given rules, they are trained on massive datasets of labeled biometric information. For instance, a sleep staging ML model is fed thousands of nights of ring sensor data (PPG, accelerometer, temperature) where each minute has already been labeled as Wake, Light, Deep, or REM by human scorers using clinical polysomnography. The model learns to find complex, non-linear patterns and correlations in the sensor data that predict these stages. It might identify a combination of 137 subtle features across all sensor streams that probabilistically indicates REM sleep—a pattern a human programmer could never manually define with simple rules.
The advantage of ML is its potential for superior accuracy, especially for complex tasks like sleep staging or predicting illness onset from subtle biomarker shifts. Its disadvantage is the "black box" problem; even its creators may not fully understand why it made a specific prediction. The best modern systems use a hybrid approach: heuristic rules to ensure basic reliability and safety, with ML models layered on top to refine accuracy and provide advanced insights. As a user, this means the metrics you see are the product of increasingly sophisticated, self-improving software that learns from aggregate anonymized data to become better for everyone.
A critical and often-asked question is: "How accurate is this data compared to medical-grade equipment?" This question of validation is paramount, as the utility of the information hinges on its reliability. The wellness industry operates in a spectrum, with consumer devices like rings occupying a space between casual fitness trackers and regulated medical devices (like ECG patches or clinical pulse oximeters).
Reputable wellness ring companies invest heavily in clinical validation studies. These studies are conducted in controlled laboratory settings, where participants wear the ring simultaneously with gold-standard reference devices. For sleep, this means polysomnography (PSG) with EEG, EMG, and EOG. For heart rate and HRV, it might be an ECG chest strap. For SpO2, it's a hospital-grade finger-clip oximeter. Researchers then statistically compare the ring's outputs to the reference data, calculating metrics like:
It's important to understand the context of these results. A ring's PPG sensor will likely never match the millivolt precision of an ECG for detecting every single heartbeat (especially during high-intensity interval training), but for measuring nighttime resting heart rate and HRV—where motion is minimal—studies show high correlation (>0.9) with reference devices. Sleep staging accuracy is often reported as around 70-85% agreement with PSG for four-stage classification, which is remarkably high for a non-EEG device and more than sufficient for personal trend analysis.
The key takeaway is that absolute precision is often less important than relative trend accuracy. Knowing your HRV is exactly 45 ms versus 48 ms matters less than knowing it has dropped 25% from your baseline for three nights in a row. The ring's supreme value is in providing a consistent, personalized measuring tool that tracks meaningful changes over time. It is a wellness guidance system, not a diagnostic medical device, and its data should be used as a powerful indicator for lifestyle reflection and adjustment, not as a replacement for professional medical advice.
The most sophisticated physiological model is incomplete without context. Two people could have identical sleep data—low deep sleep, elevated heart rate—but for entirely different reasons. One might be fighting a virus, while the other might have consumed alcohol before bed. This is where user-reported data transforms the ring from a passive observer into an interactive journal of your life.
When you log behaviors in the companion app—such as caffeine intake, alcohol consumption, medication, workout type and perceived exertion, menstrual cycle, stress levels, or even subjective mood—you are providing the "why" behind the "what." The algorithms can then perform correlation analysis over time. After several weeks, you might receive a personalized insight: "On days you log alcohol consumption, your deep sleep decreases by an average of 25%," or "Your resting heart rate tends to be lowest two days after strength training."
This creates a powerful feedback loop:
This process turns abstract health advice into personalized, verifiable truth. It empowers you to become a scientist of your own body, running n=1 experiments to discover what truly works for your unique biology. This active participation is the essence of modern, data-informed self-care, moving you from passive tracking to active optimization. It's a practical method for discovering which of the 15 restful living habits transform your energy.
A device that must be charged every day quickly becomes a burden. For a wellness ring to be effective, it must be worn continuously to establish baselines and catch nightly recovery data. This presents a monumental engineering challenge: how to run multiple power-hungry sensors (LEDs, processors) 24/7 from a tiny battery housed in a ring? The answer lies in intelligent power management and adaptive sensor scheduling.
The ring's firmware is a master of efficiency. It does not run all sensors at their highest sampling rate continuously. Instead, it operates in different power states:
Furthermore, the algorithms themselves are optimized for the embedded processor. Techniques like adaptive thresholding (e.g., only increasing LED brightness if the signal is weak) and on-device preprocessing (filtering and summarizing data before Bluetooth transmission) save precious battery life. This intricate dance between hardware capability and software efficiency is what allows a device smaller than a car key fob to provide days of continuous, clinically relevant biometric monitoring. It ensures the technology supports your journey without becoming a distraction, seamlessly integrating into the philosophy of restful living with zero-cost wellness tips.
The final, crucial step in the scientific journey is communication. The ring's profound physiological insights must be translated into a format that is instantly understandable, actionable, and non-overwhelming for the user. This is the domain of UX (User Experience) science and behavioral psychology. The design of scores, graphs, and notifications directly influences whether the data leads to positive change or anxiety.
The composite Readiness Score is a prime example of this translation. Presenting a user with 12 raw metrics each morning would cause paralysis. Synthesizing them into a single score (with supporting details available for those who want them) provides immediate orientation. The use of a simple color code—green (go), yellow (caution), red (rest)—taps into universal understanding. This design reduces cognitive load and enables quick decision-making about the day's planned intensity.
Similarly, intelligent notifications are carefully engineered. The goal is to provide value without becoming a nag. This involves:
The interface must walk a fine line between informing and alarming. It should educate the user on the meaning of metrics like HRV without medicalizing everyday fluctuations. The most effective apps focus on empowerment and curiosity, framing data as a tool for self-discovery and celebrating personal progress, not as a report card where you constantly strive for a perfect score. This thoughtful communication is what turns raw data into practical wisdom for daily living, supporting the creation of effective restful living evening rituals that prepare you for sleep.
The science encapsulated in today's wellness ring is merely the foundation. Research labs and engineering teams are actively working on next-generation sensors that could, within the next decade, turn the ring into a comprehensive health monitoring platform. Two of the most anticipated frontiers are non-invasive glucose monitoring and continuous blood pressure estimation.
Non-invasive glucose monitoring has been a holy grail of medical technology for decades. Current approaches being researched for wearables include spectroscopy using specific mid-infrared light wavelengths that are absorbed by glucose molecules, or monitoring interstitial fluid through techniques like reverse iontophoresis. Successfully miniaturizing this into a ring form factor would be revolutionary, providing diabetics and health-conscious individuals with continuous glucose trends without finger pricks, illuminating the metabolic impact of food, sleep, and stress.
Cuffless blood pressure monitoring is another active area of development. The concept is to use the PPG waveform's characteristics—its shape, the time it takes for the pulse wave to travel from the heart to the finger (pulse transit time, which can be derived if heart timing is known)—to estimate blood pressure. While incredibly challenging due to the need for frequent calibration against a cuff and many confounding variables (vascular stiffness, temperature), progress is being made with hybrid models that fuse PPG, accelerometer, and demographic data.
Beyond these, future rings may incorporate more advanced biochemical sensing, perhaps for markers of dehydration (electrolytes) or inflammation. The ultimate vision is a continuous, multi-system health snapshot—a silent guardian that not only tracks fitness and recovery but also provides early, longitudinal insights into metabolic, cardiovascular, and inflammatory health, seamlessly integrating into a proactive, preventative healthcare paradigm. This forward-looking science underscores the importance of building a foundational practice of awareness and rest today, as explored in the science behind restful living: why downtime matters.
We have journeyed from the fundamental physics of light absorption to the cutting-edge potential of predictive health analytics. The modern wellness ring is a masterpiece of interdisciplinary science, merging solid-state physics, electrical engineering, signal processing, physiology, machine learning, and behavioral psychology into a device that fits on your smallest finger.
The core revelation is this: the true product is not the ring itself. The ring is merely the most advanced tool yet created for a far more important endeavor—fostering a deep, responsive, and informed partnership with your own body. It provides the objective feedback your subjective mind often ignores or misinterprets. It translates the silent language of your autonomic nervous system, your circadian rhythm, and your metabolic processes into a dashboard you can understand and act upon.
This scientific foundation empowers you to use the technology with discernment. You now understand why HRV is a better indicator of recovery than just feeling "not tired." You appreciate why a night of poor sleep might affect your temperature rhythm for days. You can critically evaluate the insights it offers, knowing they are the result of sensor fusion and probabilistic algorithms, not infallible oracles.
Ultimately, the sensors gather the data, and the algorithms provide the interpretation, but you are the agent of change. The ring illuminates the path—showing the impact of your lifestyle on your physiology—but you must take the steps. It offers the unprecedented opportunity to align your daily choices with your long-term well-being, to recover proactively, to manage stress with awareness, and to sleep with intention. It is the beginning of a more conscious, data-empowered, and restfully intelligent way to live. This journey of integration, where technology supports timeless wellness practices, is the heart of the art of restful living in a fast-paced world.
Having established the remarkable science of how a wellness ring gathers and processes data, we now arrive at the most critical and personal phase: learning to listen. The scores and graphs in your app are not just numbers; they are a dynamic, living language spoken by your physiology. This section is your translator. Here, we move beyond what the metrics are and delve into what they mean—how to interpret their daily whispers and weekly shouts to understand the story of your stress, recovery, adaptation, and overall health.
The first and most fundamental principle of interpretation is this: Forget absolutes, embrace relativity. A heart rate of 62 BPM is meaningless in isolation. Is it 5 BPM above your baseline or 10 BPM below? The power of continuous wear is the establishment of your normal. The ring’s algorithms do this computationally, but you must adopt this mindset cognitively. Your personal baseline is your health’s true north. Deviations from it are the plot points in your story.
Trends are everything. A single night of low HRV might be due to a late meal or an intense movie. Three consecutive nights of declining HRV, especially when coupled with a rising resting heart rate and restless sleep, is a coherent narrative of accumulating strain. Learning to see these multi-metric patterns is key. Does your sleep score dip every Sunday night? This could be "Sunday Scaries" anxiety about the workweek. Does your resting heart rate reliably jump 2-3 BPM the day after heavy strength training? That’s a normal sign of muscular repair. By observing these cause-and-effect relationships over time, you become fluent in your body’s unique dialect of response and recovery. This pattern recognition is the cornerstone of moving from passive tracking to active understanding, a skill that enhances every aspect of the restful living morning routine to start your day right.
Your daily Readiness or Recovery Score is the synthesized headline. But to act on it intelligently, you need to read the full article beneath it. Let's break down a framework for interpreting a "Low," "Moderate," or "High" score, using the supporting physiological data.
A "High" Readiness Score (Green Zone):
A "Moderate" Readiness Score (Yellow Zone):
A "Low" Readiness Score (Red Zone):
Heart Rate Variability deserves its own extended discussion because it is so nuanced and informative. Think of your nightly HRV reading as a diary entry from your autonomic nervous system, summarizing the emotional and physical events of the previous day.
What a Sustained High HRV Trend (Relative to You) Can Indicate:
What a Sustained Low HRV Trend (Relative to You) Can Indicate:
The Critical Concept of "HRV Reactivity": It’s not just the absolute number, but how your HRV responds to stress. A resilient system will dip after a hard day (a hard workout, a stressful event) and then bounce back quickly—often within 24-48 hours. A system under chronic strain will dip and stay low, unable to mount a recovery response. Monitoring the speed of your HRV recovery is a more advanced insight into your true resilience. This deep awareness of your nervous system's ebb and flow is central to how restful living reduces chronic stress and burnout.
Your sleep data is a rich landscape to explore. Moving beyond the simple "Sleep Score," a nuanced look at your sleep architecture each night reveals the quality of your restoration.
Deep Sleep (Slow-Wave Sleep): The Physical Restoration Phase
REM Sleep: The Mental and Emotional Restoration Phase
Wakefulness and Sleep Latency: The Gatekeepers of Sleep
By analyzing these components, you can diagnose the specific "leak" in your sleep tank. Are you not getting enough fuel (total time)? Is the fuel low-quality (low deep/REM)? Is the tank leaking (high WASO)? This detailed analysis directly supports efforts in how to create a restful home environment room-by-room, especially the bedroom.
As a relative metric, skin temperature requires a shift in perspective. You’re not looking for a number, but for a meaningful deviation from your own established pattern.
The Nocturnal Rise: A healthy sign is a clear upward inflection point as you fall asleep. If this rise is blunted or absent, it can indicate poor peripheral circulation, an overly warm sleep environment preventing necessary core cooling, or circadian misalignment.
The Sustained Elevation:
The Sustained Depression:
Menstrual Cycle Tracking: For those who menstruate, temperature is a cornerstone of natural cycle tracking. A biphasic pattern is typical: lower temperatures in the follicular phase (post-period, pre-ovulation), a slight dip and then a sustained rise after ovulation due to progesterone, remaining elevated through the luteal phase until menstruation begins. Observing this pattern can provide non-hormonal confirmation of ovulation and cycle phases.
The interplay between your activity data and your recovery metrics is the core feedback loop for sustainable fitness and energy management. The ring helps you answer: "Did my activity help or hurt me?"
Positive Adaptation Signals:
Negative Strain Signals (Overtraining/Under-recovering):
The Concept of "Productive Strain": The goal is not to avoid all strain. Strain from a good workout or a productive work project is the stimulus for growth. The goal is to apply productive strain and then provide adequate recovery before applying the next stimulus. Your ring's readiness score and trend data are designed to help you time this cycle perfectly, preventing the non-productive, destructive strain that leads to breakdown. This is the practical application of the science of adaptation, aligning perfectly with the goals of restful living for parents finding peace in the chaos, where energy must be strategically allocated.
Modern stress is often psychological in origin but manifests in undeniable physiological patterns. Your ring can be the bridge that makes this connection tangible.
The Physiology of a Stressful Day:
Using the Data for Intervention:
When you notice these patterns, you can use them as a cue for physiological hacking. Since you can't always "think" yourself out of stress, you can use your body to influence your mind:
By correlating these physiological markers with your logged stressors (e.g., "big presentation," "difficult conversation"), you build self-awareness. You learn which types of stressors hit you hardest and which recovery tools work best for you, transforming stress from a vague, overwhelming feeling into a manageable biological process. This is the essence of building resilience through awareness, a key topic in the science behind restful living.
Your biometrics are a mirror to your life. Major events create distinct signatures. Learning to recognize them removes anxiety and fosters adaptation.
Jet Lag and Time Zone Travel:
Onset of Illness (Viral/Bacterial):
Alcohol Consumption:
Major Life Stressors (Grief, Job Change, Moving):
This is the most important guidance of all. The purpose of this technology is to reduce anxiety about health, not create a new source of it. Data neurosis—obsessively checking scores, fixating on minor fluctuations, and letting a "bad" number ruin your day—defeats the entire purpose. Here’s how to build a healthy relationship with your data:
The ring is a tool for empowerment and education. It should increase your agency and your connection to your body, not become a source of external validation or anxiety. This balanced approach is the ultimate expression of restful living in a fast-paced world, using technology not to add to the noise, but to help you find your signal. By interpreting your data with wisdom, compassion, and a focus on long-term trends, you unlock its true potential: not to tell you how to live, but to help you live better, in tune with the remarkable, intelligent system that is you.
Your Trusted Sleep Advocate: Sleep Foundation — https://www.sleepfoundation.org
Discover a digital archive of scholarly articles: NIH — https://www.ncbi.nlm.nih.gov/
39 million citations for biomedical literature :PubMed — https://pubmed.ncbi.nlm.nih.gov/
Experts at Harvard Health Publishing covering a variety of health topics — https://www.health.harvard.edu/blog/
Every life deserves world class care :Cleveland Clinic - https://my.clevelandclinic.org/health
Wearable technology and the future of predictive health monitoring :MIT Technology Review — https://www.technologyreview.com/
Dedicated to the well-being of all people and guided by science :World Health Organization — https://www.who.int/news-room/
Psychological science and knowledge to benefit society and improve lives. :APA — https://www.apa.org/monitor/
Cutting-edge insights on human longevity and peak performance:
Lifespan Research — https://www.lifespan.io/
Global authority on exercise physiology, sports performance, and human recovery:
American College of Sports Medicine — https://www.acsm.org/
Neuroscience-driven guidance for better focus, sleep, and mental clarity:
Stanford Human Performance Lab — https://humanperformance.stanford.edu/
Evidence-based psychology and mind–body wellness resources:
Mayo Clinic — https://www.mayoclinic.org/healthy-lifestyle/
Data-backed research on emotional wellbeing, stress biology, and resilience:
American Institute of Stress — https://www.stress.org/

