Preventive Wellness Guide: Catching Health Issues Before Symptoms
Catching potential health issues before symptoms appear.
The Silent Sentinel: Your Definitive Preventive Wellness Guide to Catching Health Issues Before Symptoms
We live in a world that glorifies the dramatic rescue. The heroic surgery, the life-saving diagnosis in the nick of time, the medical breakthrough that reverses a dire condition. Our healthcare narratives are dominated by reaction—by the fight against illness that has already declared itself with unmistakable, often debilitating, symptoms. But what if the pinnacle of health empowerment isn't found in the battle, but in the silent, vigilant watch that prevents the battle from ever beginning?
Welcome to the paradigm shift of Preventive Wellness. This is not about vague advice to "eat better and exercise more." This is a data-driven, technologically-empowered strategy to listen to the whispers of your body long before they become screams. It's about moving from a model of "sick care" to genuine "health care," where the goal is to intercept deviations from your unique baseline, understanding that the most crucial health battles are won invisibly, in the subtle shifts of biomarkers you can't feel.
Consider this: Many of our most significant health challenges—hypertension, prediabetes, sleep apnea, early-stage metabolic dysfunction, and even some forms of cardiovascular strain—are notoriously silent in their initial phases. They are clandestine operators, slowly remodeling your internal landscape without setting off a single alarm you can perceive. By the time fatigue, pain, or a noticeable symptom emerges, the condition is often already entrenched, requiring more aggressive intervention.
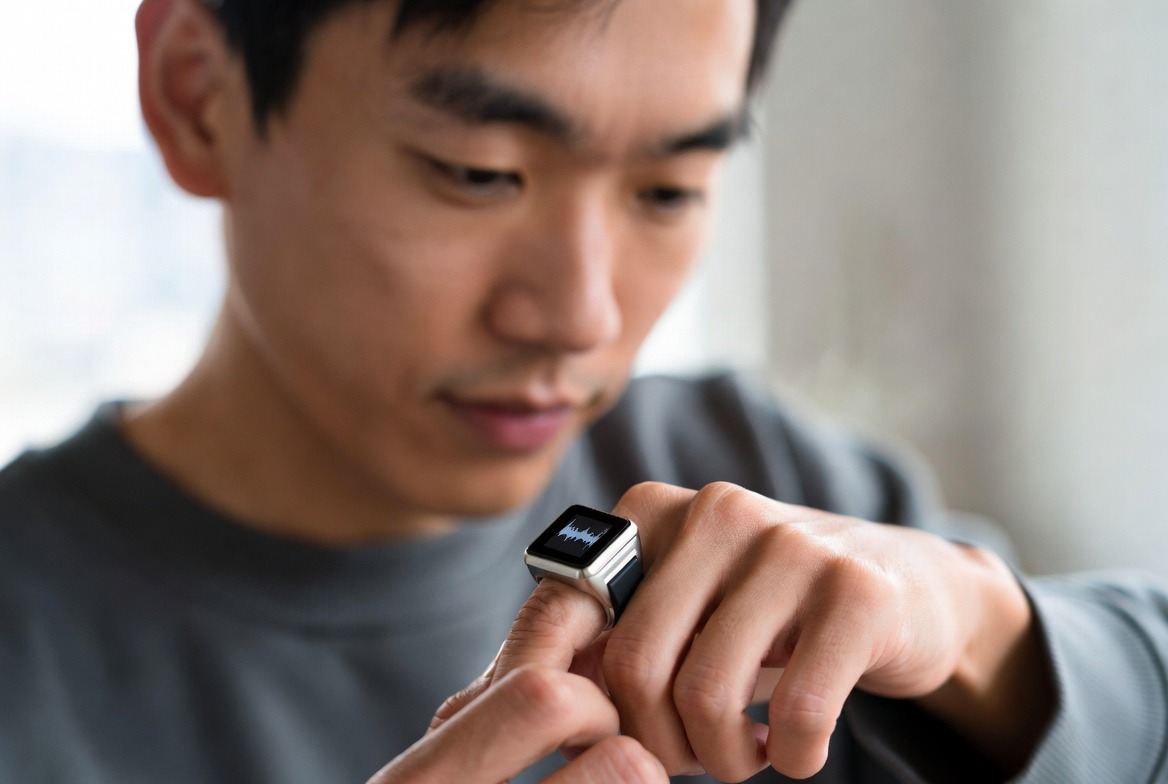
This guide is your master blueprint for building that silent sentinel for your own health. We are moving beyond theory and into actionable strategy, powered by the most accessible revolution in personal health: continuous, intelligent biometric tracking. At the heart of this new approach are devices like the advanced smart rings from innovators like Oxyzen, which offer a 24/7 window into your physiology. This isn't about creating health anxiety; it's about cultivating health awareness—the profound power of knowing, so you can act with precision and purpose.
Over the next 20,000+ words, we will dismantle the old reactive model and build a new proactive one from the ground up. We'll explore the science of early detection, decode the language of your key biomarkers, and provide a practical framework for integrating preventive monitoring seamlessly into your life. This journey begins with the most fundamental shift of all: redefining what it means to be responsible for your health in the 21st century.
The Paradigm Shift: From Reactive Treatment to Proactive Prevention
For decades, the dominant model of healthcare has been fundamentally reactive. The sequence is familiar: you experience a symptom (pain, shortness of breath, persistent fatigue), you visit a doctor, they run tests to identify the problem, and then a treatment plan is formulated to combat the now-identified illness. This "find-it, fix-it" approach is brilliant for acute issues—a broken bone, an infection, a sudden injury. But it is tragically misaligned with the slow, chronic conditions that account for the vast majority of modern disease burden and healthcare spending.
The preventive model flips this script entirely. Its core premise is that disease is a process, not an event. There is a long, often measurable, continuum between optimal function and clinical diagnosis. The goal of preventive wellness is to identify negative movements along that continuum at their earliest, most reversible point—frequently before any traditional "symptom" exists.
The Cost of Waiting for Symptoms
Why is the reactive model so problematic for chronic conditions?
The "Silent" Phase: Conditions like high blood pressure, high cholesterol, and elevated blood sugar can develop and cause internal damage for years without a single perceptible cue. You feel perfectly fine until you don't—and the "don't" can be a heart attack or stroke.
Lost Reversibility: Early-stage insulin resistance or minor arterial stiffness is often highly treatable with lifestyle modifications. By the time it progresses to full Type 2 diabetes or significant atherosclerosis, management becomes more complex, less effective, and sometimes irreversible.
The Snapshot Problem: Annual physicals provide a single, static data point. They can miss trends, fluctuations, and crucial patterns that only reveal themselves through continuous monitoring. A fasting glucose test might be normal, but what if your blood sugar spikes dangerously high two hours after every meal? You'd never know.
The Rise of Personal Biomarker Surveillance
This is where technology becomes the great enabler. We are no longer limited to annual check-ups. Wearable devices, particularly smart rings, allow for non-invasive, continuous surveillance of foundational biomarkers. Think of it as having a personal research lab dedicated solely to understanding the unique rhythms of your body.
The shift is profound:
From Episodic to Continuous: Instead of a yearly ECG, you have continuous heart rate tracking. Instead of guessing your sleep quality, you have data on sleep stages, disturbances, and resting heart rate night after night.
From Generic to Personalized: Population-based health guidelines (e.g., "get 8 hours of sleep") are replaced by personalized insights. Your optimal sleep duration is the one that correlates with your best recovery and daytime energy levels, a pattern you can only discover with consistent tracking.
From Symptom-Driven to Data-Driven: Action is prompted not by feeling bad, but by seeing an objective, undesirable trend in your data—a creeping rise in your resting heart rate, a decline in your Heart Rate Variability (HRV), or a pattern of inefficient sleep.
This paradigm is the cornerstone of modern wellness. Companies at the forefront, like Oxyzen, are building devices specifically for this purpose. To understand how this technology fits into your life, exploring their wellness ring basics for beginners is an excellent starting point. The goal is to empower you to become the expert on your own body, partnering with healthcare professionals from a position of knowledge, not mystery.
Understanding Your Body's Silent Language: Key Biomarkers Explained
If preventive wellness is about listening to your body's whispers, then you must first learn its language. This language is spoken through biomarkers—objective, measurable indicators of biological processes. In the reactive model, we wait for biomarkers to reach pathological levels (like an HbA1c over 6.5%). In the preventive model, we watch for trends and deviations from our personal baseline within the normal range.
Let's decode the most critical biomarkers you can now monitor continuously and what their subtle shifts are trying to tell you.
Resting Heart Rate (RHR): Your Metabolic Idle Speed
Your Resting Heart Rate is the number of times your heart beats per minute while you are fully at rest, typically during sleep or upon first waking. It’s a powerful, holistic indicator of cardiovascular fitness and autonomic nervous system balance.
What It Tells You: A lower RHR generally indicates stronger cardiovascular fitness and more efficient heart function. Think of a well-tuned engine that idles smoothly.
The Preventive Insight: A sustained increase in your RHR trend (e.g., from 58 to 68 bpm over several weeks) can be one of the earliest signals of:
Overtraining or Inadequate Recovery: Your body is under stress and struggling to repair.
Oncoming Illness: Your immune system is gearing up to fight an infection, often days before you feel symptoms.
Chronic Stress or Dehydration: Your sympathetic ("fight or flight") nervous system is overly active.
Potential Thyroid Issues: An elevated RHR can sometimes signal hyperthyroidism.
Monitoring this trend allows you to intervene with rest, hydration, or stress management before you crash with a cold or experience burnout.
Heart Rate Variability (HRV): The Master Metric of Resilience
If you learn only one new metric, make it HRV. Heart Rate Variability is the measure of the slight variations in time between each heartbeat. Contrary to intuition, a higher HRV is better. It indicates a healthy, responsive autonomic nervous system—a heart that can swiftly and adaptively respond to changing demands.
What It Tells You: High HRV suggests strong resilience, good recovery, and a good balance between your stress (sympathetic) and relaxation (parasympathetic) systems. It is a premier marker of your body's readiness to perform and adapt.
The Preventive Insight: A pronounced drop in your HRV trend is a major red flag from your nervous system. It can indicate:
Excessive Physical or Mental Stress: You are draining your adaptive reserves.
Poor Recovery Quality: You are not sleeping deeply or sufficiently.
Inflammation: Systemic inflammation from poor diet, illness, or other sources can depress HRV.
Risk of Future Health Events: Studies link low HRV to an increased risk of cardiovascular issues.
By watching HRV, you have a direct line to your nervous system's status. A low HRV reading is your body's plea for rest, better nutrition, or mindfulness practices—a chance to recharge your batteries before they go dead.
While you sleep, your blood oxygen saturation (SpO2) should remain steadily in the high 90s. Continuous nighttime SpO2 monitoring, a feature of advanced wearables, can reveal intermittent drops (desaturations) that are hallmarks of sleep-disordered breathing.
What It Tells You: Stable, high SpO2 throughout the night indicates efficient respiration and quality sleep.
The Preventive Insight: Repeated, even minor, dips in blood oxygen can signal:
Sleep Apnea or Upper Airway Resistance: Your breathing is being partially obstructed, straining your cardiovascular system and fragmenting your sleep without you ever waking up fully.
This is a quintessential "silent" issue. You may wake feeling unrefreshed but have no idea your oxygen levels were fluctuating all night. Left untreated, sleep apnea is a leading risk factor for hypertension, atrial fibrillation, and stroke. Nocturnal monitoring provides the first, crucial clue to seek a formal sleep study.
Skin Temperature & Respiratory Rate: The Subtle Vital Signs
Baseline deviations in these core vital signs are often imperceptible but deeply informative.
Skin Temperature Trends: A sustained elevation in your nighttime skin temperature can be an early sign of infection, inflammation, or hormonal changes (like ovulation in women). It's a more sensitive indicator than feeling feverish.
Respiratory Rate (RR): The number of breaths you take per minute, especially at rest. A creeping increase in your resting RR can be an early sign of cardiac stress, respiratory issues, or anxiety.
The power lies not in any single data point, but in the establishment of your personal baseline and the observation of trends over time. For a deeper dive into how these sensors work together, the science behind modern health tracking technology is a fascinating read. This knowledge transforms data from noise into a coherent narrative of your health.
Building Your Personal Baseline: The First 30 Days
You cannot detect a meaningful deviation if you don't first know what "normal" looks like for you. The first month with a continuous monitoring device is not about making drastic changes or diagnosing problems. It is a pure, observational discovery phase—a "get to know you" period with your own physiology. This process of building a personal baseline is the most critical step in preventive wellness.
The "Observe, Don't Judge" Protocol
For the first 30 days, commit to simply wearing your device consistently (especially during sleep, when data is most stable) and recording your daily activities, stressors, and diet in a simple journal or app note. The goal is to collect data under your current normal life conditions to establish a benchmark.
Consistency is Key: Wear the device every night. Try to take daytime readings (like a mindful minute to check stress metrics) at similar times.
Log Context: Briefly note:
Exercise type, duration, and intensity.
Perceived stress levels (scale of 1-10).
Alcohol consumption, caffeine intake, and heavy meals, especially close to bedtime.
Any unusual events (late night, travel, argument, etc.).
Identifying Your Unique Patterns
After 2-4 weeks, you will start to see your patterns emerge. This is where the magic happens.
What is your true resting heart rate? Not the textbook number, but the one your body settles into when well-recovered.
What is your HRV range? You'll see it's a range, not a single number. What does the high end look like? The low end?
How do lifestyle factors impact you? You might see:
That your RHR jumps 5-8 bpm and your HRV plummets the night after you have two glasses of wine.
That a hard workout leads to a higher RHR and lower HRV the next night (indicating needed recovery), followed by a "super-compensation" where your HRV soars to a new high 48 hours later.
That work deadlines consistently depress your recovery scores for three days straight.
That you sleep most soundly and have your best SpO2 readings when you finish eating 3 hours before bed.
This baseline is your personal health fingerprint. It turns generic advice into personalized law. For instance, the blanket statement "alcohol disrupts sleep" becomes the specific insight: "For me, alcohol reduces my deep sleep by 30% and raises my resting heart rate by 7 bpm." This is actionable, powerful self-knowledge.
All future data will be measured against this baseline. A preventive alert isn't when your RHR is "high" in a medical sense, but when it is significantly higher than your established normal. This is the core of personalized, predictive health. For those curious about the practicalities of setting up this kind of monitoring, the guide on how to enable preventive health monitoring with your device is an essential resource.
Sleep: The Unseen Foundation of All Health Metrics
If you wanted to sabotage every other preventive wellness effort, you would simply neglect sleep. Sleep is not downtime; it is the essential, non-negotiable period of repair, detoxification, memory consolidation, and hormonal regulation. It is the foundation upon which all other biomarkers rest. Poor sleep quality doesn't just make you tired—it distorts your entire health dataset and accelerates the development of silent diseases.
Beyond Duration: The Architecture of Recovery
Modern trackers move far beyond just counting hours. They analyze sleep architecture: the cyclical progression through light sleep, deep sleep (Slow-Wave Sleep), and REM (Rapid Eye Movement) sleep.
Deep Sleep (SWS): This is the physically restorative phase. Tissue growth and repair occur, energy is restored, and crucial hormones for growth and development are released. It's vital for physical recovery and immune function.
REM Sleep: This is the mentally restorative phase. It's when dreaming occurs, memories are processed and consolidated, and the brain's emotional centers are regulated. It's crucial for learning, mood, and cognitive resilience.
A preventive approach looks at the balance and quantity of these stages, not just total sleep time. You might be in bed for 8 hours but get only 30 minutes of deep sleep due to disruptions, which is profoundly insufficient.
How Sleep Disruption Manifests in Your Data (And Body)
Chronic, even minor, sleep disruption is a primary driver of silent pathology. Here’s how it shows up:
Elevated Resting Heart Rate: A sleep-deprived body is a stressed body, leading to a higher RHR as the sympathetic nervous system remains overly active.
Suppressed Heart Rate Variability: Lack of deep sleep prevents the nervous system from achieving full parasympathetic recovery, crushing your HRV.
Metabolic Dysregulation: Poor sleep increases insulin resistance, primes the body to store fat, and dysregulates hunger hormones (increasing ghrelin, decreasing leptin). This creates a direct, data-obscured path toward weight gain and metabolic syndrome.
Masked Inflammation: Sleep loss increases systemic inflammation (measured by markers like CRP), which is a root cause of countless chronic diseases and further depresses HRV.
SpO2 Dips: As discussed, fragmented sleep often correlates with respiratory disturbances, revealed by blood oxygen drops.
Using Data to Engineer Perfect Sleep
This is where tracking becomes transformative. You stop guessing and start engineering.
Find Your Chronotype: Your data will show you when you naturally fall asleep and wake up feeling most refreshed. Honor this rhythm.
Identify Disruptors: Correlate poor sleep scores with your journal entries. Was it the late dinner? The stressful day? The blue light exposure before bed? The room temperature?
Optimize Your Environment: Use the data to validate changes. Try blackout curtains and see if your deep sleep increases. Lower the thermostat and see if your sleep consistency improves. The blog post on how a wellness ring helps build healthy habits provides excellent practical strategies for this kind of optimization.
By securing high-quality, consistent sleep, you are not just preventing grogginess. You are creating the physiological conditions necessary for all other biomarkers to reflect true health, not the shadow of sleep debt. You are turning your body into a resilient, well-recovered system capable of resisting the silent creep of disease.
Stress & Recovery: Quantifying the Invisible Load
In our modern world, stress is often a constant, low-grade hum rather than an acute, life-threatening event. This chronic psychological and emotional stress translates directly into physiological stress via the autonomic nervous system and the hypothalamic-pituitary-adrenal (HPA) axis. The problem is, we become accustomed to this "background noise" and lose the ability to perceive its toll—until it manifests as burnout, anxiety, or a physical health crisis.
Preventive wellness demands we make the invisible visible. We must move from asking "How stressed do I feel?" to asking "How stressed is my body?"
The Physiology of Silent Stress
When your brain perceives a stressor (a deadline, a conflict, financial worry), it triggers a cascade:
The sympathetic nervous system activates (the "fight or flight" response).
Stress hormones like cortisol and adrenaline are released.
Heart rate increases, blood pressure rises, and digestion slows.
In the short term, this is adaptive. In the long term, with chronic activation, it becomes destructive, leading to inflammation, immune suppression, hormonal imbalance, and cardiovascular wear and tear.
Your Data as a Stress Barometer
Your biometrics provide an objective, unfiltered read on this physiological stress load, independent of your conscious perception.
HRV is the North Star: As your body's stress load increases, your HRV reliably decreases. It is one of the most sensitive indicators of autonomic nervous system imbalance. A low or trending-downward HRV is a clear signal that your recovery resources are depleted, even if you're "powering through."
Resting Heart Rate (RHR): A sustained high RHR is a classic sign of a body stuck in a sympathetic-dominant state.
Sleep Architecture: Chronic stress severely fragments sleep, particularly reducing deep sleep (when physical repair happens) and REM sleep (when emotional processing occurs). You may sleep for 8 hours but wake up with a recovery score of 45/100.
Respiratory Rate (RR): A higher resting respiratory rate can be a sign of anxiety and physiological arousal.
The Recovery Imperative
Stress is not the enemy; the lack of recovery is. The goal of preventive monitoring is not to eliminate stress (an impossible task) but to ensure it is punctuated by sufficient, high-quality recovery to restore balance.
Your data allows you to practice strategic recovery:
Active Recovery Days: If your morning HRV is low and RHR is elevated after a hard workout week, your data is telling you to take a walk or do gentle yoga instead of another intense session. Pushing further risks overtraining and injury.
Stress-Buffer Interventions: See a dip in your afternoon HRV during a stressful work period? That's your cue for a 10-minute guided breathing session. Afterwards, check your metrics—you will often see a tangible, immediate improvement, confirming the intervention worked.
Mind-Body Feedback: Use the data to validate which mindfulness or relaxation practices actually work for your physiology. Does meditation move your needle more than a nature walk? Your HRV and RHR will tell you the truth.
This approach transforms stress management from a vague, "should-do" concept into a precise, feedback-driven practice. You learn to listen to your body's signals for recovery before you reach a state of exhaustion or illness. For a deeper exploration of how this technology enables a truly personalized approach, see how health tracking technology enables personalized wellness. You are no longer managing an abstract feeling; you are managing a measurable physiological state.
Nutrition & Metabolism: Seeing the Impact Beyond the Calorie
For generations, nutrition has been mired in oversimplification: calories in vs. calories out. While energy balance is fundamental, it tells us nothing about the metabolic quality of those calories or their impact on our underlying physiology. Two people can consume the same number of calories yet have wildly different inflammatory responses, hormonal profiles, and long-term disease risks.
Preventive wellness uses biometrics to bypass the dogma and answer a more nuanced question: How is this food, diet, or eating pattern affecting my inner physiology in ways I can't feel?
Metabolic Markers Beyond the Scale
While continuous glucose monitors (CGMs) are the gold standard for glycemic response, advanced wearables provide powerful proxy metrics that reveal metabolic and inflammatory stress.
Resting Heart Rate & HRV Response: Observe what happens to your RHR and HRV in the hours and night after a meal.
A large, processed, or high-sugar meal often causes a noticeable increase in overnight RHR and a decrease in HRV. This indicates a metabolic and inflammatory burden—your body is working hard to process the meal, creating systemic stress.
Conversely, a balanced meal with protein, fiber, and healthy fats typically results in minimal disturbance to your nocturnal metrics.
Sleep Quality as a Metabolic Report Card: Chronic consumption of inflammatory foods (high in refined carbs, sugars, unhealthy fats) will degrade your sleep architecture over time, reducing deep and REM sleep. Your sleep data becomes a long-term report on your diet's compatibility with your system.
Skin Temperature & Inflammation: A diet high in inflammatory foods can contribute to a subtle but sustained elevation in nighttime skin temperature, reflecting increased metabolic activity and inflammation.
Personalizing Your Nutrition with N=1 Experiments
This is where you become a scientist of your own body. Use your baseline (from the first 30 days) to run experiments.
The Test: For 3-4 days, consciously eat a "clean" diet you suspect works for you—plenty of vegetables, lean protein, whole-food fats, and minimal processed foods. Note your average sleep score, RHR, and HRV.
The Challenge: Then, for 1-2 days, reintroduce a specific food or pattern (e.g., gluten, dairy, late-night carbs, a sugary dessert). Keep everything else consistent.
The Result: Analyze the data. Did your RHR spike that night? Did your deep sleep percentage drop? Did your HRV tank the next morning?
Example Finding: "For me, eating dessert after 8 PM increases my night-time RHR by 10 bpm and cuts my deep sleep in half. However, having the same dessert right after lunch has almost no negative effect."
This is personalized nutrition at its most powerful. You move from following generic rules ("carbs are bad") to understanding your unique physiological responses ("my body tolerates complex carbs at lunch but not at dinner"). It helps identify silent food sensitivities that cause low-grade inflammation without obvious digestive upset.
Fasting & Eating Windows
Similarly, you can test different eating schedules. Does a 12-hour overnight fast improve your morning HRV compared to a 10-hour window? Does a large breakfast or a large dinner better support your energy and recovery metrics? Your body's data provides the unbiased answer.
This data-driven approach takes the emotion and confusion out of eating. It aligns your diet not with a fad, but with the measurable goal of minimizing internal stress and inflammation—the very processes that lead to silent chronic disease. To see how these principles apply over a lifetime, the article on 50 healthy aging tips a smart ring helps implement daily offers a wealth of interconnected strategies.
Activity & Movement: Optimizing Fitness, Not Just Counting Steps
The modern fitness tracker popularized the step count, but in the realm of preventive wellness, steps are a crude and incomplete metric. The true goal is productive strain followed by adequate adaptation—pushing your body to stimulate positive physiological change (like improved cardiovascular fitness, stronger bones, and better metabolic health) and then providing it with the resources to recover and grow stronger.
This delicate balance is where most people err, either by not straining enough (a sedentary life) or by straining too much without sufficient recovery (leading to overtraining, injury, and burnout). Your biometrics are the essential guide to navigating this balance perfectly.
From Volume to Quality: Rethinking Exercise Metrics
While tracking workout duration and heart rate zones is useful, the most important data comes from how your body responds after the workout.
The Acute Response (The Strain): During a workout, you expect your heart rate to rise. The intensity and duration give you a measure of the acute stress applied.
The Adaptive Response (The Recovery): The next 24-72 hours are where the magic—or the damage—happens. This is when you must monitor:
Next-Night Resting Heart Rate: A slight elevation (2-5 bpm) is normal after a hard workout. A large, sustained elevation (>7-10 bpm) suggests the workout was too taxing and recovery is impaired.
Next-Night HRV: A significant drop in HRV is expected after intense strain. However, it should then rebound to baseline or higher within 1-2 days. This "super-compensation" is the sign of positive adaptation. If your HRV remains suppressed for 3+ days, you are not recovering and are likely overreaching.
Sleep Quality: Did the workout help you sleep more deeply, or did it leave you too amped up, fragmenting your sleep? Your deep sleep score is a direct reflection of your body's repair processes.
Preventing Overtraining and Injury
Overtraining Syndrome (OTS) is a state of prolonged fatigue and performance decline caused by an imbalance between training and recovery. It is a classic "silent" issue in fitness. You think you're being dedicated, but you're actually digging a hole. The early signs are almost entirely biometric, not perceptual:
A consistently elevated resting heart rate.
A chronically suppressed Heart Rate Variability.
Poor sleep scores despite exhaustion.
Increased susceptibility to illness.
By watching these trends, you can see OTS developing weeks before your performance plummets or you get injured. The data tells you to deload—to take a few easy days or complete rest—allowing your metrics to recover. This turns training into a sustainable, lifelong practice that builds health instead of breaking it down.
Finding Your "Minimum Effective Dose"
For preventive health, you don't need to train like an athlete. The goal is to find the "minimum effective dose" of activity that yields maximal health benefits with minimal wear-and-tear. Your data helps you find this sweet spot.
Maybe two intense strength sessions and two gentle cardio sessions per week give you perfect recovery metrics and steady fitness gains.
Perhaps adding a third intense session crashes your HRV for a week, showing it's counterproductive.
A daily 30-minute walk might do more for your baseline RHR and stress levels than occasional, brutal HIIT sessions.
This personalized approach to activity ensures that your fitness regimen is a pillar of prevention, not a source of silent, accumulated stress. For a comprehensive look at how modern devices track movement, the basics of activity and movement tracking are thoroughly explained in our dedicated resource.
Environmental & Lifestyle Triggers: The External Factors Shaping Your Internal World
Your body does not exist in a vacuum. It is in a constant, dynamic dialogue with your environment and daily habits. Many of these external factors exert a slow, cumulative effect that can precipitate silent health issues. The air you breathe, the light you're exposed to, your travel schedule, and even your social interactions all leave a biometric signature. A preventive approach uses data to identify these hidden triggers and mitigate their impact.
Chronodisruption: The Silent Toll of Messed-Up Rhythms
Your body runs on a 24-hour internal clock called the circadian rhythm, governing sleep, hormone release, metabolism, and even gene expression. "Chronodisruption"—the misalignment of your behaviors with this internal clock—is a potent silent stressor linked to obesity, diabetes, mood disorders, and cancer.
The Triggers:
Blue Light at Night: Suppresses melatonin, delaying sleep onset and degrading sleep quality.
Irregular Sleep/Wake Times: Confuses your circadian system, leading to poor metabolic and hormonal regulation.
Eating Late at Night: Forces your digestive system to work when it should be resting, raising nocturnal RHR and impairing sleep.
Social Jet Lag: The weekend shift in sleep schedule (staying up late, sleeping in) creates a mini jet-lag effect every week.
What Your Data Shows: Chronodisruption manifests as inconsistent sleep scores, depressed HRV, elevated RHR, and unstable temperature rhythms. By enforcing consistent bedtimes, minimizing evening blue light, and eating within a consistent window, you can see these metrics stabilize and improve, reflecting a healthier, more resilient circadian system.
Travel & Altitude: The Stress Test You Didn't Choose
Business trips and vacations are common, but they are massive physiological stressors.
Air Travel: Dehydration, cabin pressure, time zone changes, and disrupted routines wreak havoc. You will see this in your data: jet lag shows as a near-total collapse of normal sleep architecture and HRV for several days as your body struggles to resynchronize.
Altitude: Travel to high altitude causes lower blood oxygen saturation (SpO2). Your body compensates by increasing heart rate and respiratory rate. Watching your SpO2 and RHR data helps you pace yourself and understand your acclimatization process, preventing acute mountain sickness.
Social and Emotional Load
Human connection is vital, but social dynamics are a potent, often overlooked, biometric driver.
Positive Social Engagement: A joyful evening with close friends might lead to a great night's sleep and a high HRV the next morning.
Conflict and Negative Interaction: A stressful argument or a draining social obligation can trigger a classic stress response, spiking your RHR and crushing your HRV for hours or even days.
Loneliness and Isolation: Chronic lack of positive social contact is a profound stressor, often reflected in persistently poor recovery metrics and sleep quality.
By journaling your social interactions and correlating them with your biometric trends, you gain objective insight into which relationships and activities are truly nourishing versus those that are depleting. This empowers you to set boundaries and invest your time in connections that support your physiological health.
Interpreting Trends, Not Data Points: The Art of Health Forecasting
In the world of preventive wellness, a single data point is a curiosity; a trend is a conversation. Our bodies are dynamic systems, not static machines. Daily fluctuations in heart rate, HRV, and sleep are normal and expected. The true power of continuous monitoring lies not in obsessing over today’s number but in discerning the meaningful patterns that emerge over weeks and months. This is the art of health forecasting—using the trajectory of your biomarkers to predict your future state of health and intervene while you still have the steering wheel.
Distinguishing Noise from Signal
The first skill to develop is separating benign daily "noise" from a concerning physiological "signal."
Noise: This is the normal, expected variability. Examples include:
A slightly higher RHR and lower HRV the night after a hard leg day.
A dip in sleep score due to a neighbor's loud party.
A temporary HRV drop during a busy work week.
Noise is often explainable by a specific, temporary event and self-corrects quickly once the event passes.
Signal: This is a sustained, directional trend that deviates from your established baseline and persists beyond immediate, obvious triggers. Examples include:
Your 7-day moving average for RHR creeps up by 5+ beats per minute over three weeks, despite normal activity and sleep.
Your HRV’s weekly average trends downward for a month, and the "lows" are getting lower.
Your sleep score consistently declines, even on nights with no alcohol or late caffeine.
A signal suggests an underlying shift in your physiological state that requires investigation.
The Power of Moving Averages
To see signals clearly, you must smooth out the noise. This is done by focusing on moving averages (e.g., 7-day or 30-day averages) rather than daily values. Most advanced wellness apps provide these trend views.
Scenario: Your daily HRV looks like a chaotic mountain range: 65, 42, 70, 50, 68, 45, 72. It’s hard to interpret.
Insight: You look at the 7-day moving average. It reads: 58, 57, 56, 55, 54, 53, 52. This is a clear, consistent downward signal. Your body’s resilience is declining, even though some individual days look high. This trend would prompt you to scrutinize your stress, recovery, and lifestyle over that period.
The Four Key Trend Archetypes
Learn to recognize these common trend patterns and their preventive implications:
The Gradual Creep (RHR Up, HRV Down): This is the most common signal of accumulating, unaddressed stress—whether physical, mental, or emotional. It’s your body’s silent protest against a lifestyle it can no longer sustain without cost. Preventive Action: Mandate a “recovery week.” Dial back training intensity by 50%, prioritize sleep hygiene, incorporate daily mindfulness, and double-check nutrition. The goal is to reverse the trend before it leads to illness or burnout.
The Acute Cliff (Sudden, Severe Drop in HRV/Recovery): This often follows a massive, acute stressor: a severe illness (even before full symptoms), an intense emotional trauma, or extreme physical overexertion. Preventive Action: This is a red flag for mandatory rest. Treat it as a system-wide injury. Focus on hydration, gentle nutrition, and maximum sleep opportunity. It’s a sign your adaptive reserves are critically depleted and pushing further could have serious consequences.
The Inflammatory Signature (Elevated Nightly RHR + Poor Sleep): When your RHR stays elevated throughout the night and your deep sleep remains low, it often points to systemic inflammation. This could be from a hidden infection, a dietary intolerance you haven’t identified, or an autoimmune flare-up. Preventive Action: Audit your diet for potential inflammatory triggers. Consider an elimination diet. Ensure you’re not fighting off a low-grade infection. This pattern warrants closer attention and possibly a discussion with a healthcare provider.
The Detraining Signal (RHR Gradually Rising, Despite Stable Activity): If you maintain your exercise routine but see your RHR slowly increase and your HRV decrease over a period of months, it may signal that your current routine is no longer providing a positive stimulus and may be contributing to chronic fatigue. Preventive Action: It may be time for a strategic change in your fitness regimen—altering the type of exercise, incorporating periodization, or focusing on a different fitness domain (e.g., mobility, stability) for a cycle.
By becoming fluent in this language of trends, you transition from being a passive data collector to an active health forecaster. You can see trouble brewing on the horizon and change course long before you reach the storm. For those who want to understand the machinery behind these insights, the article on sensors, algorithms, and AI in health tracking demystifies the process.
Creating Your Personal Early-Warning System
Data is only as valuable as the action it prompts. The culmination of preventive wellness is building a personalized, responsive Early-Warning System (EWS). This is a set of predefined, data-driven rules that tell you when to pause, investigate, and intervene. An EWS turns abstract trends into concrete, timely alerts for your most valuable asset: your health.
Defining Your Alert Parameters
Your EWS should be based on deviations from your baseline, not population norms. Here is a framework for setting those parameters:
Tier 1 Alert (Pay Attention):
Trigger: A key metric (e.g., RHR, HRV, Sleep Score) moves outside your personal "normal range" (established in your first 30 days) for 3 consecutive days.
Example: Your normal RHR range is 52-58 bpm. It reads 61, 62, 60 on three consecutive nights.
Action: Initiate a lifestyle audit. Review sleep, stress, diet, and training load for the past 5-7 days. Make conscious, conservative adjustments (e.g., add 30 minutes of sleep, swap one workout for a walk, ensure perfect hydration).
Tier 2 Alert (Invest & Intervene):
Trigger: The 7-day moving average of a key metric shows a sustained unfavorable trend (e.g., HRV avg down by 15%, RHR avg up by 10%).
Example: Your weekly HRV average has dropped from 55ms to 47ms over two weeks.
Action: This requires a more structured intervention. Implement a planned "deload" or recovery protocol for 5-7 days. Consider more significant dietary adjustments (e.g., cutting alcohol, sugar). Use mindfulness or breathing exercises deliberately 2x per day. If the trend doesn’t reverse after a focused intervention, it may be time to consider external factors or consult a professional.
Tier 3 Alert (Seek Professional Insight):
Trigger: A persistent, unexplainable trend (lasting 3+ weeks) that does not respond to your interventions, OR the appearance of a severe, acute anomaly.
Examples:
A resting heart rate that has steadily climbed from 55 to 75 bpm over a month, with no change in medication, fitness, or obvious stress.
A sudden, drastic change in a metric that coincides with a new, unexplained physical sensation (e.g., chest discomfort, shortness of breath).
Action: Schedule a visit with your healthcare provider. Your role is not to diagnose, but to provide a compelling, data-supported narrative. Bring your trend charts. Say: "Doctor, over the last month, my resting heart rate has increased by 20 beats per minute according to my continuous monitor, and I haven't changed my lifestyle. I'm concerned. Can we explore potential causes?"
The Power of the "Why" Journal
Your EWS is intelligent because of the context you provide. Maintain a simple digital or physical journal to answer "why?" when an alert triggers.
Date: [Date of Tier 1 Alert]
Metric: RHR elevated (60, 61, 62 bpm) vs. normal (52-58).
Potential Context: Major work deadline Wednesday. Two late nights (>11:30 PM). Ate takeout 3 nights this week. Skipped mindfulness practice.
Action Taken: Committed to bed by 10:30 PM for 5 days. Prepped lunches to avoid takeout. Did 10-min breathwork before bed.
Result (3 days later): RHR back to 56 bpm. Sleep score improved.
This journal transforms your EWS from a nagging alarm into a learning system. Over time, you’ll identify your unique, repeatable vulnerability patterns and your most effective countermeasures.
Integrating with Professional Care
The most advanced early-warning system is one that connects you to your healthcare team. Share your insights. Many forward-thinking providers are eager to see this kind of longitudinal, personalized data, as it gives them a far richer picture than a snapshot in an exam room. It facilitates a collaborative partnership where you are the expert on your daily lived experience, and they are the expert on clinical pathology. To see how this is already happening, explore how health tracking technology is being used in hospitals. Your data can become a powerful bridge between daily life and clinical insight.
Case Studies in Prevention: Real-World Applications
Theory and frameworks come alive through application. Let’s examine hypothetical but realistic scenarios that illustrate how a preventive wellness system, centered on continuous biometric monitoring, can intercept health issues in their earliest, most manageable stages.
Case Study 1: The "Silent" March Towards Metabolic Syndrome
Profile: Alex, 42, software developer. Moderately active, eats fairly well but has a sweet tooth. Annual physicals show "borderline" fasting glucose (100 mg/dL) for two years, but no official diagnosis. Told to "watch his diet."
The Silent Process: Alex’s body is slowly developing insulin resistance. His pancreas works overtime to manage blood sugar spikes, especially after his afternoon candy bar and large pasta dinners. He feels fine, just a little more afternoon fog.
What the Data Showed (After establishing a baseline):
Nocturnal RHR Trend: Alex’s RHR began a gradual climb, from a baseline of 58 bpm to a 7-day average of 64 bpm over 6 weeks.
HRV Trend: His HRV showed a corresponding, steady decline.
Sleep Correlation: His deepest sleep periods were shortening.
The Experiment: Alex used his journal. He noticed his worst recovery scores followed days with high-sugar snacks and late, carb-heavy meals. He ran a 2-week experiment: no added sugar, and finishing dinner by 7:30 PM with balanced macros.
The Intervention & Outcome: Within 10 days, his RHR trend reversed, dropping back to 59 bpm. His HRV recovered, and his deep sleep increased. He felt more alert. He took this data to his doctor, who ordered an oral glucose tolerance test, which revealed significant post-meal spikes the standard fasting test had missed. With this early, data-validated insight, Alex and his doctor agreed on a sustained lifestyle plan, likely preventing the progression to full Type 2 diabetes.
Case Study 2: Unmasking Hidden Sleep Apnea
Profile: Maria, 50, teacher. Always tired, needs coffee to get through the day. Attributes it to age and stress. She snores lightly but has never been told she stops breathing. Her doctor suggested a sleep study, but she found it intimidating and put it off.
The Silent Process: Maria has mild obstructive sleep apnea. Throughout the night, her airway partially collapses dozens of times, causing micro-arousals (brief awakenings she doesn’t remember) and slight drops in blood oxygen. This fragments her sleep and strains her cardiovascular system.
What the Data Showed: Maria’s smart ring provided two key pieces of data her subjective feeling couldn’t:
Nocturnal Blood Oxygen (SpO2): The graph showed frequent, saw-tooth patterned dips, dropping from a baseline of 97% to 90-92% multiple times per hour.
Resting Heart Rate & HRV: Her RHR was higher than expected for her fitness level (68 bpm), and her HRV was chronically low, indicating poor recovery.
The Intervention & Outcome: The objective SpO2 data was the tangible evidence Maria needed. She showed the graphs to her doctor, who immediately ordered a home sleep study, which confirmed mild-to-moderate OSA. Maria began using a dental appliance. Within weeks, her ring data showed stable SpO2 lines at 97-98% all night. Her RHR dropped to 61 bpm, her HRV improved, and her subjective energy levels soared. She potentially mitigated long-term risks for hypertension and heart strain.
Case Study 3: Overtraining and the Risk of Immune Suppression
Profile: Ben, 35, amateur triathlete. Training for a half-Ironman. Adheres rigidly to his training plan, pushing through fatigue. Prides himself on never missing a workout.
The Silent Process: Ben is in a state of non-functional overreaching, edging towards Overtraining Syndrome. His chronic training load is outstripping his recovery capacity, creating systemic inflammation and suppressing his immune system.
What the Data Showed:
HRV Crash: Ben’s normally robust HRV (averaging 80ms) began a severe, multi-week descent into the 50s.
RHR Elevation: His RHR rose from 48 to 56 bpm.
Sleep Disruption: His deep sleep disappeared.
The Final Warning: Three days before he felt ill, his skin temperature trend showed a sustained nocturnal elevation—a classic early sign of his body fighting an infection.
The Intervention & Outcome: Ben’s EWS gave him a Tier 2 Alert two weeks before he planned to taper. Ignoring his plan, he took 4 full days off and slept 9+ hours each night. His HRV began a slow recovery. While he still caught a mild cold (the infection was already brewing), it lasted 3 days instead of 2 weeks. More importantly, he avoided a full-blown overtraining collapse that could have ended his season and caused lasting fatigue. The data taught him that recovery is not the absence of training; it is the positive adaptation that makes training worthwhile.
These cases demonstrate that preventive action is not dramatic; it’s a series of small, intelligent corrections guided by a clearer map of your internal terrain. For more real-world examples of how users benefit, the customer testimonials page offers genuine stories of discovery and improvement.
The Future is Now: Where Preventive Technology is Heading
The field of personal biometric monitoring is not static; it is accelerating at a breathtaking pace. What we consider cutting-edge today—continuous HRV, SpO2, and temperature—are merely the foundational layers of a much deeper diagnostic platform emerging on the horizon. Understanding this trajectory helps us appreciate the tool we have today and anticipate the even more powerful tools of tomorrow.
Beyond the Ring: Multi-Modal Sensing Ecosystems
The future of prevention lies not in a single wearable, but in a seamlessly integrated ecosystem of sensors that paint a complete, multi-dimensional picture.
Continuous, Non-Invasive Biomarkers: Research is advancing rapidly on sensors that can estimate:
Blood Pressure: Using photoplethysmography (PPG) and pulse wave analysis algorithms to provide trended blood pressure data without a cuff.
Blood Glucose Trends: While not replacing CGMs, next-gen optical sensors may provide proxy metrics for glycemic variability and metabolic stress through advanced spectroscopic analysis of interstitial fluid.
Hydration & Electrolyte Status: Via bioimpedance or advanced optical sensors.
Cortisol & Hormone Trends: Through salivary or sweat analysis in connected devices.
Environmental Integration: Your ring will not work in isolation. It will automatically sync with:
Smart Home Data: (e.g., air quality sensors, ambient light and noise levels) to correlate your internal metrics with your environment.
Digital Phenotyping: Anonymized data from your phone use (typing speed, voice tone, social interaction patterns) could provide passive mental health and cognitive load insights, cross-referenced with physiological stress markers.
The AI Health Coach: From Insight to Prescription
Today’s apps provide data and basic insights. Tomorrow’s platforms will provide hyper-personalized, dynamic prescriptive guidance.
Predictive Analytics: AI will not just tell you your HRV is low; it will analyze your past 90 days of data, your calendar, and your historical responses to predict, “Based on your current stress load and upcoming work deadline, there’s an 85% probability you will develop a upper respiratory infection in 5-7 days if you complete your planned intense workout tomorrow.”
Adaptive Guidance: The system will then offer a prescriptive alternative: “Recommended action: Convert tomorrow’s interval run to a Zone 2 recovery jog of 30 minutes, and schedule a 20-minute mindfulness session in the evening. This intervention has a 70% probability of restoring your immune resilience and preventing illness.”
Longitudinal Health Modeling: The AI will build a sophisticated digital twin of your physiology, allowing you to run virtual "what-if" scenarios: “What would be the projected impact on my 6-month metabolic markers if I switched to a Mediterranean diet?” or “How might my recovery metrics change if I moved my workout from evening to morning?”
Integration with Clinical Pathways
The ultimate goal is to close the loop between personal monitoring and professional healthcare, creating a true continuum of care.
Clinician Dashboards: Doctors will have secure dashboards where they can view their consenting patients’ longitudinal trend data, spotting concerning patterns long before an annual visit.
Remote Patient Monitoring (RPM) for Wellness: Beyond managing chronic disease, RPM will be used for pre-chronic condition management. Individuals with pre-hypertension or prediabetes could be “monitored” with a wellness device, and the data shared with a care team who can provide timely, preventative coaching.
Diagnostic-Grade Validation: The accuracy revolution is ongoing. As sensors and algorithms are clinically validated for specific use cases (like atrial fibrillation detection via PPG, which is already happening), these consumer devices will become powerful front-line screening tools, directing people to the right care at the right time. Learn more about this ongoing accuracy revolution in health tracking technology.
This future is not science fiction; elements of it are already in development. By engaging with the technology available today, you are not just protecting your present health—you are building the data foundation and the proactive mindset that will allow you to harness the even more transformative tools of the next 3-5 years. To explore the journey that led us here, the article on the evolution from manual tracking to smart rings provides essential context.
Getting Started: Your Step-by-Step Implementation Plan
The journey of a thousand miles begins with a single step, but a journey without a map leads in circles. This section provides your concrete, step-by-step roadmap for implementing a powerful preventive wellness system in your life. We’ll move from selection to integration, ensuring you build a sustainable practice, not a passing fad.
Step 1: Choosing Your Tool Wisely
Your monitoring device is your primary lens into your physiology. Choosing the right one is critical. Focus on these key features for preventive wellness:
Non-Negotiable Sensors:
High-Fidelity PPG Sensor: For accurate, continuous heart rate and Heart Rate Variability (HRV). This is your top priority.
Pulse Oximeter (SpO2): For nocturnal blood oxygen monitoring.
Skin Temperature Sensor: For tracking baseline shifts.
3D Accelerometer: For sleep staging and activity.
The Ecosystem (The App & Algorithms): The hardware is useless without intelligent software. Look for:
Trend Analysis: Clear views of 7-day and 30-day moving averages for all key metrics.
Recovery/Readiness Scores: A synthesized, easy-to-interpret score based on HRV, RHR, and sleep data.
Sleep Staging: Breakdown of light, deep, and REM sleep.
Data Export & Privacy: Ability to export your raw data and clear, robust privacy policies on how your sensitive health data is used and stored. For peace of mind, our guide on privacy settings and data security is essential reading.
Form Factor & Comfort: You must be willing to wear it every night. A comfortable, low-profile ring is ideal for 24/7 wear, especially during sleep when the most crucial data is collected. For help on styles and fit, see the options for color, style, and personalization.
Step 2: The Foundational 30-Day Baseline Period
As detailed earlier, this is your pure observation phase. Do not change your habits. Simply:
Wear the device consistently, especially at night.
At the end of 30 days, analyze to find your normal ranges for RHR, HRV, and sleep scores. This is your health "fingerprint."
Step 3: Establish Your Early-Warning System (EWS)
Using the framework from earlier, write down your personal alert parameters.
Tier 1 (3-day deviation): My RHR is above ___ or below ___. My HRV is below ___.
Tier 2 (7-day trend): My weekly average HRV drops by ___%. My weekly average RHR rises by ___%.
Create your "Intervention Playbook": Pre-determine your go-to actions for each tier (e.g., Tier 1 = add 30 min sleep, focus on hydration; Tier 2 = deload training, meditate 2x/day).
Step 4: Begin the N=1 Experimentation Cycle
Now, start actively learning. Use your baseline to test hypotheses.
Week 1: Test a new bedtime. Go to bed 45 minutes earlier. What happens to your deep sleep and morning readiness score?
Week 2: Test a dietary change. Remove added sugar for 5 days. Observe your nocturnal RHR and HRV response.
Week 3: Test a workout variable. Move your workout from evening to morning, or swap HIIT for yoga. How does it affect your recovery metrics? Keep a journal of these experiments. The goal is to build a personal encyclopedia of what works for you.
Step 5: Integrate and Automate
The final step is to make this system effortless.
Create Morning & Evening Rituals: Check your readiness score and last night’s sleep as part of your morning coffee routine. Review your day’s context and log it in the evening.
Schedule Quarterly Reviews: Every 3 months, do a deep dive on your long-term trends. Are you improving? Are there seasonal patterns? This is when you adjust your fitness or wellness goals.
Share with Your Inner Circle: Tell a partner or close friend about your system. It adds a layer of accountability and shared understanding.
By following this plan, you systematically build knowledge, then intuition. The data becomes not a source of anxiety, but a source of profound confidence—the confidence that comes from truly knowing yourself. For a visual and detailed walkthrough of beginning this journey, the wellness ring mastery guide from unboxing to expert use is an invaluable companion.
Conclusion of Part One: The Empowered Path Forward
We have covered immense ground in this first portion of our definitive guide. We began by dismantling the reactive “sick care” model and championing the proactive, preventive paradigm. We learned the language of our body’s silent signals—RHR, HRV, SpO2, and temperature—and understood that their true power lies not in snapshots, but in trends. We built a personal baseline, learned to engineer better sleep, quantify stress, personalize nutrition, and optimize activity. We constructed an Early-Warning System and saw it in action through real-world case studies. Finally, we glimpsed the future and laid out a practical plan to start today.
The through-line of all this is a fundamental shift in agency. Preventive wellness, powered by modern technology, returns the primary responsibility for your health to where it has always belonged: with you. It provides the tools to be an active, informed steward of your own well-being, transforming you from a passive patient waiting for something to go wrong into an empowered architect building resilient health every single day.
This is not a journey of perfection, but of awareness. It’s about catching the small leaks before the dam breaks. The data is your compass, not your critic. It guides you toward choices that make you feel not just not sick, but truly vital, resilient, and in tune with your body’s needs.
The path forward is clear. It begins with a single step of curiosity and a commitment to listen—really listen—to the subtle, intelligent language your body has been speaking all along. It continues with the daily practice of using that information to make smarter, more supportive choices. And it culminates in a life lived with more energy, less unexpected illness, and the profound peace of mind that comes from knowing you are doing everything within your power to safeguard your most precious asset.
Your silent sentinel is ready to stand watch. The question is, are you ready to listen?
Advanced Biomarker Interpretation: From Correlation to Causation
Mastering the basics of RHR, HRV, and sleep scores is akin to learning the alphabet of your body’s language. The next level of fluency involves constructing complex sentences—understanding how these biomarkers interact, influence each other, and point to specific underlying physiological systems. This is where you move from observing that something is changing to forming educated hypotheses about why.
The Interplay of Core Metrics: A Systemic View
No biomarker exists in isolation. They are nodes in a densely connected network. A change in one almost always affects others. Learning to read these interrelationships is key to advanced interpretation.
The Stress-Recovery-Sleep Triangle: This is the fundamental triad. Consider a scenario where you see a decline in HRV.
If it’s paired with an elevated RHR and poor sleep efficiency: The likely culprit is systemic overload—a combination of physical training, cognitive work, and emotional stress that has overwhelmed your recovery capacity. Your nervous system is stuck in "fight or flight."
If it’s paired with a stable or low RHR but fragmented sleep (frequent awakenings): This could point more specifically to sleep architecture disruption, potentially from sleep-disordered breathing (check SpO2), pain, or environmental factors. The stress on the body is focused on the sleep disruption itself.
If it’s paired with a gradually rising RHR and unrefreshing sleep over weeks: This is a classic signature of low-grade, chronic inflammation. Your body is in a constant state of repair and defense, which taxes the autonomic nervous system and hinders deep recovery. This pattern should prompt a review of diet, gut health, and potential hidden infections.
Respiratory Rate (RR) as a Nervous System Whisperer: While often overlooked, your resting breaths per minute is a direct window into autonomic balance.
A resting RR consistently above 16-18 breaths/minute can indicate a sympathetic (stress) dominance, even if your HRV hasn’t crashed yet. It’s an early, subtle sign.
Conversely, a low, steady RR (10-14 bpm) paired with high HRV is a sign of a calm, parasympathetic-dominant state—the pinnacle of recovery.
Key Insight: During mindfulness or breathwork exercises, watch your RR in real-time. Seeing it slow down and become more rhythmic is objective, immediate biofeedback that the practice is physiologically effective.
Skin Temperature Trends: The Inflammation and Rhythm Barometer Nighttime distal (limb) skin temperature is regulated by your circadian rhythm and blood flow.
A sustained upward trend in nightly temperature can be one of the earliest signs of:
Oncoming Illness: Your body raises its temperature to create a less hospitable environment for pathogens.
Overtraining/Inflammation: Increased blood flow for repair and inflammatory processes.
Hormonal Shifts: In women, a clear biphasic pattern correlates with the menstrual cycle, with a post-ovulation temperature rise.
Loss of Diurnal Rhythm: A flat, unvarying temperature curve can signal circadian rhythm disruption, often seen with shift work, extreme jet lag, or poor sleep hygiene.
The HRV "Banana Curve" and What It Reveals
Plot your daily HRV over a month. For a healthy, adapting individual, it often doesn’t look like a straight line aiming up. It can look like a bouncing ball or, intriguingly, a "banana" shape when you're productively straining and recovering.
The Dip: After a significant stressor (hard workout, big project), HRV drops.
The Rebound: With proper recovery, it doesn’t just return to baseline; it supercompensates, soaring to a level higher than before the stress.
The Curve: Connecting these daily points over a training or project cycle can create an upward-trending curve that resembles a banana. This is a visual representation of increased resilience. Your body isn't just coping with stress; it's getting better at handling it.
The Warning: If you only see the dips without the rebounds, or if the rebounds get progressively weaker, you are in a state of negative adaptation. The "banana" is missing or rotting. This is a precise visual cue to pull back.
By analyzing these patterns, you develop a systems-thinking approach to your health. You stop asking, "Why is my HRV low?" and start asking, "Given that my HRV is low, my RHR is high, and my sleep is fragmented, which system—nervous, immune, or metabolic—is most likely the primary driver?" This sophistication turns data into a powerful diagnostic compass. For those interested in the deep technical underpinnings of how these patterns are detected, our resource on sensors, algorithms, and AI provides a fascinating look behind the curtain.
The Gut-Health Connection: Your Second Brain’s Biometric Signature
A revolutionary frontier in preventive wellness is understanding the profound dialogue between your gut and the rest of your body. The gut is often called the "second brain," housing the enteric nervous system and home to trillions of microbes (the microbiome) that influence everything from immunity and inflammation to mood and metabolism. Crucially, gut disturbances often manifest silently in your biometric data long before you feel digestive upset.
How Gut Health Talks Through Your Wearable
A dysregulated gut—whether from imbalanced microbiota, intestinal permeability ("leaky gut"), or food sensitivities—creates a state of systemic, low-grade inflammation. This inflammation is a silent stressor that speaks clearly through your core metrics:
The Inflammation Triad:
Depressed HRV: Chronic inflammation directly activates the sympathetic nervous system and suppresses the parasympathetic response, leading to lower HRV.
Elevated Nocturnal RHR: The inflammatory response increases metabolic demand and stress on the cardiovascular system, raising your heart rate even at rest.
Poor Sleep Quality: Inflammatory cytokines can disrupt sleep architecture, particularly reducing deep, restorative sleep. You may sleep for 8 hours but wake with a low recovery score.
Skin Temperature & The "Inner Fire": As mentioned, sustained low-grade inflammation can elevate your core and peripheral body temperature subtly, often detected as a higher baseline in your nightly skin temperature readings.
Reactivity to Food: This is where N=1 experimentation becomes powerful. You may discover that after consuming certain foods (e.g., gluten for some, dairy for others, high-FODMAP foods, or industrial seed oils), your biometrics tell a clear story of distress that your gut does not.
Data Pattern: A meal is followed 3-6 hours later by a rise in RHR, a drop in HRV, and a night of restless sleep—despite no immediate bloating or pain.
Interpretation: This is an immune-inflammatory response to a food antigen or a fermentation process in the gut that your body perceives as a threat.
A Preventive Protocol for Gut-Biome Correlation
If you suspect your gut may be a silent source of systemic stress, you can use your wearable to investigate.
Phase 1: The Elimination & Baseline (3-4 Weeks) Adopt a known anti-inflammatory, gut-supportive diet. Think: whole foods, rich in fiber from diverse vegetables, fermented foods, healthy fats, and lean protein. Eliminate common irritants: processed foods, refined sugars, excessive alcohol, and any personal suspected triggers. During this phase, establish a new biometric baseline. Note improvements in your HRV, RHR, and sleep scores.
Phase 2: The Strategic Challenge (1-2 Weeks) Reintroduce one potential trigger food group at a time, in a significant quantity, for 2-3 days. Monitor your data closely.
Challenge Gluten: Have seitan or two slices of conventional bread with meals.
Crucial: Keep everything else—sleep, stress, other diet, exercise—as consistent as possible.
Phase 3: Data-Driven Decision Did your HRV plummet and RHR spike the night after the dairy challenge, but the gluten challenge had no effect? Your body has given you an objective answer. The food that creates a measurable inflammatory signature is a candidate for removal or strict limitation, not based on a fad, but on your personal physiology.
This approach can uncover hidden food sensitivities that contribute to a chronic inflammatory load, a primary accelerator of nearly every age-related and chronic disease. By using your biometrics as an objective judge, you take the guesswork and emotion out of dietary choices, building a way of eating that truly supports systemic peace and resilience. For more on building daily habits that support systemic health, including gut health, explore our guide on how a wellness ring helps build healthy habits.
Hormonal Harmony Through a Data Lens
Hormones are the body’s messaging system, orchestrating metabolism, energy, mood, reproduction, and stress response. Hormonal imbalances (like subclinical hypothyroidism, cortisol dysregulation, or sex hormone fluctuations) are another category of "silent" disruptors. While wearables cannot measure hormone levels directly, they are exceptionally good at capturing the physiological effects of hormonal shifts, providing indirect but highly valuable insights.
Cortisol Rhythms and the Stress Axis
Cortisol should follow a robust diurnal rhythm: high in the morning to help you wake (the cortisol awakening response), gradually declining throughout the day, and low at night to allow for rest and repair.
Biometric Signs of Dysregulation:
Flatlined HRV & High Nighttime RHR: This can indicate cortisol nonsuppression at night. Your body is stuck in a stress state, preventing parasympathetic recovery.
Difficulty Waking, Low Morning Readiness: A blunted cortisol awakening response can leave you feeling groggy and unrefreshed, often reflected in poor sleep scores and low HRV in the AM.
Mid-Afternoon Crashing Energy: While normal to have a dip, a severe crash can correlate with a dysregulated cortisol curve.
Data-Informed Management: If you see these patterns, interventions like morning sunlight exposure, consistent wake times, strategic caffeine use (only before noon), and mindfulness become critical. You can track the efficacy of these interventions by watching for an improvement in your morning HRV and a steeper decline in your RHR throughout the night.
The Menstrual Cycle & Female Physiology
For women, hormonal fluctuations across the menstrual cycle create a predictable, healthy pattern in biometric data. Recognizing this is crucial to avoid misinterpreting natural changes as problems.
Follicular Phase (Post-period to Ovulation): Often associated with higher, more stable energy. Biometric trends may show a gradual improvement in HRV, lower RHR, and better recovery scores as estrogen rises.
Ovulation: A small, temporary dip in HRV and a rise in RHR can occur, alongside a sustained rise in basal skin temperature that continues into the next phase.
Luteal Phase (Post-ovulation to period): With rising progesterone (and its slight thermogenic effect), resting heart rate can increase by 3-8 bpm, and HRV may trend slightly lower. Sleep may become more fragmented in the days preceding menstruation. This is normal.
The Preventive Power: Tracking this cycle allows a woman to:
Sync her training: Plan intense workouts in the follicular phase when recovery is often better, and focus on strength maintenance or deloading in the luteal phase.
Understand emotional and energy patterns: Seeing a correlation between biometric shifts and mood can foster self-compassion and better planning.
Detect Anomalies: A complete absence of these cyclical patterns or extreme versions of them (e.g., massive HRV crashes) can be data points to discuss with a healthcare provider regarding conditions like PMDD or PCOS.
Thyroid Function: The Metabolic Thermostat
The thyroid gland regulates metabolism. Both hyper- and hypothyroidism can be subclinical (showing abnormal lab values with mild or no symptoms) for years.
Potential Biometric Hints:
Unexplained Elevated RHR: A resting heart rate that is persistently and inexplicably high (e.g., consistently in the 70s-80s for a fit individual) can be a sign of hyperthyroidism.
Low RHR with Poor Recovery & Constant Fatigue: While a low RHR is usually a sign of fitness, if it's paired with very low HRV, unrefreshing sleep, and constant low energy, it could hint at hypothyroidism slowing everything down.
Temperature Extremes: Hyperthyroidism can raise basal temperature; hypothyroidism can lower it.
Crucial Disclaimer: These are hints and correlations, not diagnoses. A wearable cannot diagnose a thyroid condition. However, a persistent, unexplainable trend in these core metrics is a powerful, objective reason to request specific blood tests (TSH, Free T3, Free T4, antibodies) from your doctor. You’re not complaining of vague fatigue; you’re presenting a data trend: "My resting heart rate has averaged 15 bpm higher than my normal baseline for 60 days with no lifestyle change. Can we check my thyroid?"
This proactive, data-supported approach is the future of patient-provider collaboration. To understand how this technology is changing the clinical landscape, read about how health tracking technology has changed preventive medicine.
Cognitive Performance & Mental Fitness: Optimizing Your Brain’s Biometrics
The mind and body are inseparable. Mental stress, cognitive load, focus, and emotional state all have direct physiological correlates. The frontier of preventive wellness now extends to brain health and cognitive resilience, using biometrics not just to prevent physical disease, but to optimize mental performance and safeguard against burnout and cognitive decline.
The Physiology of Focus and Flow
Optimal cognitive states like "flow" (deep, effortless concentration) are supported by a specific physiological environment.
The Ideal Neuro-Cardiovascular State: Research suggests that states of focused attention are associated with moderate, stable heart rate and coherent, high-amplitude HRV patterns (specifically, an increase in respiratory sinus arrhythmia). In simpler terms, your heart and breath are in sync.
What Your Data Can Show: You can experiment with different work conditions.
Try a 90-minute focused work block with phone on airplane mode. Afterwards, check your HRV reading—was it stable or elevated?
Contrast that with a work block filled with constant Slack notifications, emails, and multitasking. You will likely see a more chaotic heart rate pattern and a lower post-session HRV, indicating higher cognitive and physiological stress.
This biofeedback allows you to structure your workday for peak mental performance: long, uninterrupted blocks for deep work, with breaks for recovery.
Quantifying Mental Load and Emotional Stress
Emotional and mental stress are potent physiological events.
The Biometric Signature of a Stressful Meeting or Argument: A difficult conversation can cause a sharp, acute spike in heart rate and a precipitous drop in HRV that lasts for hours. Seeing this data objectively can help you:
Validate Your Experience: It confirms the event was physiologically taxing, which can be helpful for self-validation and setting boundaries.
Implement Recovery: Knowing your nervous system is agitated, you can deliberately choose a recovery activity—a walk in nature, breathwork—and watch your metrics normalize.
Chronic Cognitive Load: The constant pressure of a demanding job, caregiving, or financial worry creates a low-grade sympathetic tone. This manifests as the now-familiar trend: suppressed HRV, elevated RHR, and poor sleep. It’s a physical manifestation of mental burden.
A Protocol for Mental Fitness Training
Just as you train your body, you can train your nervous system for mental resilience using biofeedback.
Baseline Measurement: At a calm moment, sit quietly for 2 minutes and note your heart rate and a subjective calmness score (1-10).
Stressor Introduction: Recall a mildly stressful thought or engage in a challenging cognitive task (e.g., mental math) for 60 seconds. Observe the spike in your heart rate (visible on most device apps in real-time).
Recovery Intervention: Immediately practice a resilience technique:
Box Breathing (4-7-8): Inhale 4 sec, hold 7 sec, exhale 8 sec.
Humming or Long Exhalations: Activates the vagus nerve.
Quick Body Scan Meditation.
Measure Recovery Speed: Time how long it takes for your heart rate to return to its pre-stressor baseline. This heart rate recovery (HRR) time is a powerful metric of autonomic flexibility and mental resilience.
Track Progress: Over weeks of daily practice, you should see your HRR time decrease. Your nervous system learns to ramp up for a challenge and ramp down efficiently afterward. This is the bedrock of emotional regulation and stress resilience.
By applying your wearable to cognitive and emotional health, you transform it from a fitness device into a comprehensive mental fitness tool. It helps you design a life and workstyle that not only avoids burnout but promotes sustained clarity, creativity, and calm. For strategies on integrating these practices into a long, healthy life, our article on 50 healthy aging tips a smart ring helps implement daily offers a holistic view.
Building a Collaborative Partnership with Your Healthcare Provider
The pinnacle of a mature preventive wellness practice is integrating your self-collected data with professional medical expertise. The goal is not to replace your doctor, but to empower a new, collaborative model: you as the expert on your daily, longitudinal data, and your provider as the expert on clinical diagnosis and treatment. This partnership is the most powerful health alliance you can form.
Preparing for a "Data-Visit"
Walking into a doctor’s office with 6 months of biometric trends is vastly different from walking in with a list of vague symptoms. Here’s how to prepare:
Summarize, Don’t Dump: Doctors have limited time. Prepare a one-page summary.
Header: Patient Summary for [Your Name], [Date Range of Data].
The Concern: State it clearly. "I am concerned about a persistent, unexplained elevation in my resting heart rate and decline in heart rate variability over the past four months."
The Trends: Use simple graphs or clear statements. "My 7-day average RHR has increased from 58 bpm to 72 bpm. My HRV has dropped by 30%. This correlates with persistent unrefreshing sleep (attached sleep score trend)."
Lifestyle Context: Briefly note relevant factors. "I have maintained consistent moderate exercise, a stable diet, and no new medications. Stress levels have been normal."
Specific Ask: "Given this data, I would like to explore potential underlying causes. I am requesting tests for thyroid function, iron/ferritin levels, and a check for underlying infection or inflammation (e.g., CRP)."
Use the Right Language: Frame your data as observations and concerns, not self-diagnoses. Say "My data is showing this trend, which worries me," not "My ring says I have thyroiditis."
Bring Visual Aids: A graph is worth a thousand words. A simple line chart showing the RHR climb is immediately understandable and compelling.
What This Collaboration Makes Possible
Identifying "White Coat Syndrome": If your at-home RHR averages 62 but spikes to 85 in the clinic, you have objective evidence of appointment anxiety, which can contextualize a single high office blood pressure reading.
Monitoring Treatment Efficacy: If you are started on a medication for hypertension or anxiety, your daily RHR and HRV trends become a sensitive gauge of its physiological effect, far more nuanced than occasional office checks.
Pre-Diagnostic Triage: Your data can help a provider prioritize which investigations are most urgent. Unexplained nocturnal SpO2 dips warrant a sleep study referral. A persistent high RHR trend warrants cardiac and metabolic investigation.
Motivation and Adherence: Showing your provider how lifestyle changes (inspired by their advice) have positively shifted your biometrics reinforces the treatment plan and builds mutual investment in success.
Navigating Potential Pushback
Some providers may be unfamiliar or skeptical of consumer wearable data. Your preparation is key.
Acknowledge Limitations: "I understand this is not a medical-grade device, but the consistent trend over months is significant to me."
Cite the Science: Mention that metrics like HRV are validated indicators of autonomic function and systemic stress.
Focus on Collaboration: "I’m bringing this to you as a partner, hoping this additional information can help us get to the root of this sooner."
The most forward-thinking providers will welcome this engagement. It represents a shift towards true preventative, participatory medicine. To see examples of how this technology is being taken seriously in medical contexts, read about how doctors find wellness ring data most useful.
The Long Game: Preventive Wellness for Healthy Aging
The ultimate goal of all these strategies is not just to avoid illness next month, but to build a foundation for vital, independent, and cognitively sharp aging. The conditions we fear most in later life—cardiovascular disease, neurodegenerative decline, metabolic dysfunction, and frailty—are not sudden events. They are the culmination of processes that begin decades earlier. Preventive wellness is the practice of influencing those processes, daily, in your favor.
Biomarkers of Aging vs. Chronological Age
Biological age (the age of your cells and systems) can differ significantly from chronological age (the number of years you've lived). Your wearable data provides proxies for your biological age.
Cardiovascular Aging: A low, stable RHR and high HRV are hallmarks of a "young" cardiovascular and autonomic nervous system.
Metabolic Aging: Stable blood glucose (and by proxy, minimal post-meal RHR spikes) and healthy body composition correlate with a younger metabolic profile.
Recovery & Repair Capacity: The speed and robustness with which your HRV rebounds after stress is a direct measure of your systemic resilience—a key factor in aging well.
The Cumulative Benefit of Micro-Corrections
Aging well is not about a single heroic effort; it’s about the compound interest of daily, data-informed choices.
Sleep: Consistently prioritizing sleep protects against hippocampal atrophy (memory), clears metabolic waste from the brain, and supports immune function.
Stress Management: Regularly practicing techniques that improve HRV reduces cumulative allostatic load (the wear and tear from chronic stress), a major contributor to age-related disease.
Activity: Maintaining muscle mass and cardiovascular fitness through intelligent training preserves mobility, metabolic rate, and cognitive function.
Nutrition: An anti-inflammatory, gut-supportive diet directly fights the inflammaging process, a root cause of most chronic age-related conditions.
Your wearable is the tool that provides the feedback loop for these micro-corrections. It answers: "Is what I’m doing today contributing to a younger, more resilient biological age?"
Building a Legacy of Health Data
Imagine reaching age 70 with a 20-year longitudinal dataset of your sleep, heart rate variability, and activity. This would be an invaluable asset, allowing you and your doctor to:
See exactly when subtle declines began.
Compare your current metrics to your personal peak, not just to age-based population averages.
Make incredibly personalized decisions about health interventions.
This long-term view transforms the purpose of tracking from daily optimization to life-span architecture. You are not just logging data; you are writing the story of how you age, one conscious, informed day at a time. For a comprehensive collection of strategies focused on this lifelong journey, our resource on 50 healthy aging tips is an essential guide.
Conclusion: Becoming the Author of Your Health Story
We have journeyed from the fundamental principles of listening to your body’s silent language to the advanced interpretation of interconnected systems, from gut health to hormonal balance, from cognitive optimization to forging a new partnership with medicine. This is the essence of 21st-century preventive wellness: a data-informed, personalized, and profoundly empowering practice.
The old model of health was passive—you were a passenger in a vehicle you didn't understand, waiting for a warning light to flash. The new model is active. You are in the driver’s seat, with a sophisticated dashboard providing real-time feedback on every system. You understand the gauges—RHR, HRV, SpO2, temperature. You can read the maps—trends, correlations, patterns. And you have a destination: not merely the absence of disease, but the active cultivation of resilience, vitality, and longevity.
This journey begins with a choice: the choice to pay attention. It is sustained by curiosity—the desire to run N=1 experiments and learn what truly works for your unique biology. It is solidified by partnership—using your knowledge to engage more effectively with healthcare professionals.
Your body is always speaking. It whispers in the subtle dip of your HRV after a poor meal, in the gentle climb of your RHR under unrelenting stress, in the restorative depth of your sleep when you honor your rhythm. For too long, we have waited for these whispers to become screams. Now, we have the technology to listen from the very first word.
The silent sentinel is not just the device on your finger. The silent sentinel is you—the aware, proactive, and empowered individual using every tool available to guard your most precious asset. The story of your health is being written every day. With knowledge, intention, and the right tools, you hold the pen.
Continue your journey. Dive deeper into specific topics on our blog, learn about the mission behind the technology on our About Us page, or take the first step in equipping your silent sentinel by visiting the Oxyzen shop.