The Heart Attack Australia Didn’t See Coming: 50% of First Events Happen to People With No Prior Symptoms
Many heart attacks occur without prior symptoms, showing the need for continuous monitoring to detect hidden cardiovascular risks before they lead to life-threatening events.
The Heart Attack Australia Didn’t See Coming: 50% of First Events Happen to People With No Prior Symptoms
Every twelve minutes, somewhere in Australia, a heartbeat stops.
Not in a hospital. Not under observation. Not following weeks of mounting symptoms that everyone somehow missed. In a car on the way to work. In a bedroom at three in the morning. In a backyard on a Sunday afternoon while the barbecue is still hot.
The person who collapses had a plan for next week. They had a mortgage. They had adult children who were finally starting to make them proud. They had a gym membership they used inconsistently and a GP they saw once a year for the obligatory Medicare-funded pat-down that always ended with the same reassurance: “Your numbers look fine. Keep doing what you’re doing.”
And then, without warning, their heart stopped.
Here is what makes that statistic not just sad but existentially confronting: half of all first heart attacks happen to people with no prior symptoms. No chest pain. No shortness of breath. No midnight sweating that made them wonder if something was wrong. Their blood pressure was managed. Their cholesterol was borderline but nothing their doctor lost sleep over. Their last check-up came back with no red flags.
But their heart had been sending signals for months. Their HRV had been quietly declining. Their resting heart rate had been climbing one beat per month, so slowly they never noticed. Their sleep had been fragmenting in ways that felt like normal middle-aged restlessness but were actually the metabolic signature of a cardiovascular system under siege.
They just didn’t have a device that could read the language their body was speaking.
This is the heart attack Australia didn’t see coming. And if you are between 40 and 60 years old, if you are a man who hasn’t seen a doctor in three years, if you are a woman who has been told your fatigue is “just hormones,” if you have a parent whose heart failed without warning—this article is the most important thing you will read this year.
Because the old model of heart health is killing us. The annual check-up. The risk score that only looks at five variables. The assumption that if you feel fine, you are fine. That model is why 50 percent of first heart attacks have no prior symptoms. That model is why cardiovascular disease remains Australia’s single biggest killer, claiming more lives than any cancer, any accident, any infectious disease.
And that model is about to be replaced by something that works.
The Fifty Percent: Why the Most Dangerous Heart Attack Is the One You Don’t See Coming
Let’s sit with that number for a moment. Fifty percent.
Not five percent. Not ten percent. Half of all first myocardial infarctions—medical language for heart attacks—occur in people whose prior risk assessment suggested they were fine. The Framingham Risk Score, the gold standard cardiovascular risk calculator used in GP clinics across Australia, classified them as low to moderate risk. Their LDL cholesterol was acceptable. Their blood pressure was controlled. They didn’t smoke. They weren’t diabetic. By every conventional measure, these people were not supposed to have heart attacks.
And then they did.
The data comes from multiple large-scale cohort studies spanning decades. The REACH registry. The INTERHEART study. The Australian Heart Disease and Stroke Database. Across every population, across every demographic, the finding holds: conventional risk stratification misses half of all first events.
Here is what that means in human terms. There are approximately 56,000 heart attacks in Australia every year. Twenty-eight thousand of those are first events—meaning the person had never had a heart attack before. And of those 28,000 first events, 14,000 happen to people who had no idea they were at risk.
Fourteen thousand Australians every year. More than thirty-eight every day. One every thirty-eight minutes, if you want to measure it that way—but we already have a better measure. One Australian dies from cardiovascular disease every twelve minutes. Many of those deaths are first events. Many of those people had no symptoms.
The widespread false belief that heart disease announces itself before it kills is not just wrong. It is dangerous. It creates a permission structure for complacency. “I feel fine, so I must be fine.”“My GP said my numbers were okay, so I don’t need to think about this.”“Heart disease is something that happens to unhealthy people, and I’m not unhealthy.”
This belief system is why middle-aged Australians—particularly men—don’t engage with preventive health content. They don’t see themselves as the protagonist in a heart disease story. They see themselves as the exception. And that perception is exactly what the data disproves.
Because the mechanism of a “silent” heart attack is not mystery. It is biology. Atherosclerosis—the progressive narrowing of arteries by plaque—develops over decades. But the body compensates. Collateral vessels form. The heart adapts to reduced blood flow. Symptoms don’t appear until a plaque ruptures and a clot forms, and by then, the window for intervention is measured in minutes.
That rupture can happen in a person with 70 percent stenosis or 30 percent stenosis. It can happen in a person with optimal cholesterol or borderline cholesterol. It can happen in a person who exercises or a person who doesn’t. The rupture is the event. Everything before it is silence.
But silence is not the same as absence. The body is not quiet in the months before a cardiac event. It is speaking in a language most Australians have never been taught to understand. Heart rate variability. Nocturnal oxygen saturation. Resting heart rate trends. Atrial fibrillation burden. Sleep architecture. These are not abstract biometrics for biohackers and endurance athletes. They are the early warning system your body has been running continuously since the day you were born.
And for the first time in human history, you can wear that warning system on your finger.
The question is not whether your heart will send signals before a first event. The question is whether you have the tool to receive them. OxyZen was built to answer that question—not as a luxury gadget for the health-obsessed, but as a continuous monitoring platform for every Australian who wants to know what their heart is doing while they sleep, while they work, while they live their completely normal life that feels completely fine right up until it doesn’t.
The fifty percent statistic is not designed to scare you into paralysis. It is designed to wake you up. Because once you know that half of all first heart attacks happen without warning, you have two choices. You can accept that risk and hope you’re in the other half. Or you can start monitoring the signals your body has been sending all along.
What the Framingham Risk Score Misses: The Invisible Risk Factors Your GP Isn’t Measuring
Let’s be clear about something upfront: the Framingham Risk Score is not bad medicine. When it was developed in the 1940s, it was revolutionary. For the first time, clinicians had a evidence-based tool to estimate a patient’s ten-year risk of a cardiovascular event using variables that could be measured in a standard office visit: age, sex, total cholesterol, HDL cholesterol, blood pressure, smoking status, and diabetes status.
For population-level risk stratification, Framingham works. It identifies broad trends. It guides public health policy. It has saved countless lives by alerting clinicians to patients whose conventional risk factors place them in high-risk categories.
But Framingham was designed in an era before continuous biometric monitoring existed. It was designed for a world where the only data points available were the ones collected during a fifteen-minute appointment. It was designed to answer a specific question: “Based on these seven variables, what is this patient’s statistical probability of an event in the next ten years?”
It was never designed to detect the subtle, dynamic changes that precede a cardiac event in the weeks and months beforehand. And those changes—the ones Framingham cannot see—are precisely the ones that predict the fifty percent of first events occurring in low-to-moderate risk patients.
Here is what Framingham misses.
Heart Rate Variability (HRV). Your HRV is the variation in time between consecutive heartbeats. High HRV means your autonomic nervous system is balanced—your parasympathetic “rest and digest” branch and your sympathetic “fight or flight” branch are in healthy communication. Low HRV means your system is under stress, your recovery is compromised, and your cardiovascular resilience is declining.
Low HRV is one of the strongest independent predictors of adverse cardiac events. It precedes heart attacks by weeks to months. It declines gradually, often without any perceptible change in how you feel. And your GP has never measured it because measuring HRV requires continuous monitoring over days or weeks—something impossible in a fifteen-minute appointment.
Nocturnal Oxygen Saturation (SpO₂). When you sleep, your oxygen levels should remain above 94 percent. If they drop—even briefly, even without waking you—your heart works harder. Your blood pressure spikes. Your sympathetic nervous system activates. Over months and years, this nocturnal hypoxemia drives hypertension, arrhythmias, and cardiac remodeling.
The primary cause of nocturnal desaturation is obstructive sleep apnea (OSA), a condition affecting an estimated 1.5 million Australians, with up to 80 percent undiagnosed. OSA triples your risk of heart attack. It is almost entirely invisible to standard cardiovascular risk assessment. And the only way to detect it is to measure your oxygen while you sleep.
Atrial Fibrillation Burden. Atrial fibrillation (AF) is an irregular, often rapid heart rhythm that increases stroke risk fivefold. Paroxysmal AF—episodes that come and go—is particularly dangerous because it is intermittent. You can have AF for hours, convert back to normal rhythm, and have no idea it happened. Your ECG in the GP’s office will look completely normal.
But those hours of AF are hours during which blood pools in your atria, clots form, and your stroke risk accumulates. The only way to detect paroxysmal AF is continuous monitoring over days or weeks. The average time from first AF episode to diagnosis in Australia is over two years. Two years during which your stroke risk was elevated and you had no idea.
Resting Heart Rate Trends. Your resting heart rate (RHR) is not a static number. It changes with fitness, stress, sleep quality, hydration, and autonomic function. A gradual elevation in RHR—one beat per month, two beats per month—is a signal that your cardiovascular system is under increasing load. It predicts adverse events with surprising accuracy. But because RHR varies day to day, a single measurement in a GP clinic tells you almost nothing. Only a trend over weeks reveals the signal beneath the noise.
Sleep Architecture. Deep sleep is when your cardiovascular system recovers. Blood pressure drops. Heart rate slows. Parasympathetic tone increases. Poor sleep architecture—fragmented sleep, reduced deep sleep, excessive light sleep—is associated with hypertension, insulin resistance, and increased cardiac risk. Your GP cannot measure your sleep architecture. You spend fifteen minutes in their office awake.
These are not exotic biomarkers for researchers and elite athletes. They are fundamental physiological signals that your body generates continuously. They are the language your heart uses to tell you how it is doing. And for the first time in history, consumer technology has matured to the point where these signals can be measured accurately, continuously, and affordably.
The gap between what Framingham measures and what your body is actually doing is the gap where fourteen thousand first heart attacks happen every year. Closing that gap requires moving from episodic to continuous monitoring. From population statistics to personal physiology. From what your risk is to what your risk is becoming.
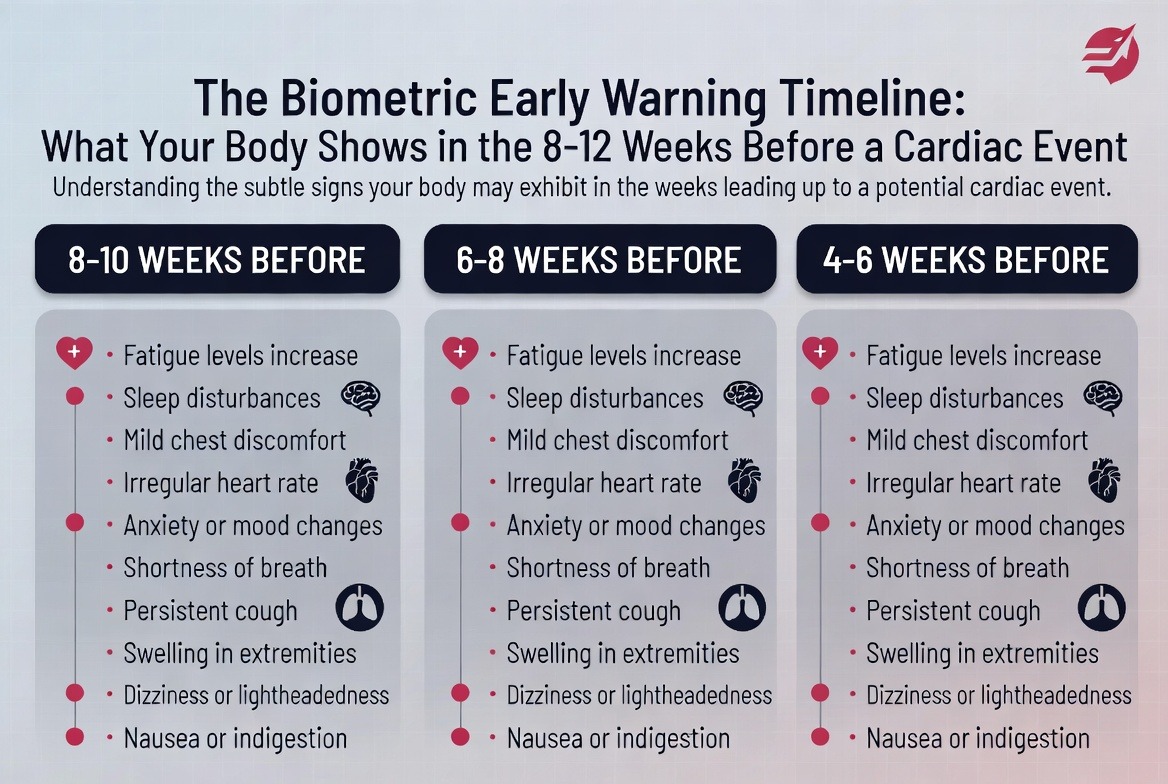
The Biometric Early Warning Timeline: What Your Body Shows in the 8-12 Weeks Before a Cardiac Event
If you knew a heart attack was coming eight weeks before it happened, what would you do differently?
You would see your GP. You would request advanced testing. You would adjust your medications. You would change your exercise and nutrition. You would call your adult children and tell them you loved them. You would take the window of opportunity that biology gave you and you would walk through it.
Here is the truth that changes everything: your body gives you that window. Every time. The signs are there. They are measurable. They are specific. And they appear weeks to months before a first cardiac event—not in dramatic symptoms that send you to emergency, but in gradual, progressive changes in your daily biometrics.
The research is clear. A 2020 study in the Journal of the American Heart Association followed 878 patients who experienced cardiac events while wearing continuous monitors. The data revealed a predictable cascade of changes beginning eight to twelve weeks before the event. The same pattern has been replicated in multiple cohorts using different monitoring technologies. The biometric early warning timeline is real. It is reproducible. And it is the single most important reason to start continuous monitoring today.
Here is what that timeline looks like.
Week 12 to Week 8 Before Event: HRV Begins to Decline. The earliest signal is almost always a sustained decrease in heart rate variability. Not a single low reading—single readings are meaningless, influenced by alcohol, stress, illness, and a hundred other variables—but a downward trend over weeks. Your HRV drops below your personal baseline and stays there. The recovery that used to happen overnight no longer happens. Your autonomic nervous system is stuck in sympathetic dominance.
You do not feel this decline. HRV is not a sensation. It is a calculation. But your body knows. The shift from parasympathetic to sympathetic tone increases inflammatory markers, raises blood pressure variability, and reduces cardiac resilience. Your heart is working harder than it should, and the strain is accumulating.
Week 8 to Week 6 Before Event: Resting Heart Rate Begins to Rise. As autonomic balance shifts further, your resting heart rate starts climbing. The increase is subtle—one or two beats per week—so gradual that you would never notice it without daily measurement. But the trend is unmistakable. Your RHR, which normally fluctuates within a narrow range, is now persistently elevated.
This elevation reflects increased sympathetic drive and reduced vagal tone. Your heart is beating faster not because you need it to, but because your nervous system has lost its ability to slow it down. Each extra beat per minute increases cardiac workload and oxygen demand. Over weeks, this creates a state of metabolic inefficiency that precedes plaque rupture.
Week 6 to Week 4 Before Event: Sleep Architecture Deteriorates. This is when the changes become detectable in your subjective experience—though most people still don’t recognize them as warning signs. You wake up more often during the night. Your deep sleep decreases. Your REM sleep fragments. You feel tired in the morning despite spending adequate time in bed.
The mechanism is nocturnal sympathetic activation. Your autonomic nervous system, already biased toward fight-or-flight, fails to make the normal nighttime transition to parasympathetic dominance. Your heart rate stays elevated during sleep. Your blood pressure doesn’t experience the normal nocturnal dip. Your recovery is compromised, and the cascade accelerates.
Week 4 to Week 2 Before Event: Nocturnal Oxygen Begins to Drop. If obstructive sleep apnea is present—and it is present in a substantial percentage of middle-aged Australians, most undiagnosed—this is when oxygen desaturation events become more frequent and more severe. Your SpO₂ drops below 90 percent multiple times per night. Each desaturation triggers a sympathetic surge, a blood pressure spike, and a burst of oxidative stress.
Even without OSA, this period often shows increased respiratory rate and decreased oxygen variability. Your body is working harder to maintain oxygenation, and the effort is visible in your breathing patterns during sleep.
Week 2 to Event: The Final Warning Signs. In the two weeks before a cardiac event, the biometric changes accelerate and new signals appear. Heart rate recovery after exercise or stress slows dramatically. The relationship between activity and heart rate becomes abnormal—your heart rate stays elevated longer than it should after you stop moving. Atrial fibrillation burden often increases, with short episodes of irregular rhythm that may last minutes to hours.
Some patients in the research literature showed a characteristic “heart rate decoupling” pattern, where the normal relationship between physical activity and heart rate breaks down. Others showed sudden drops in HRV below any previously recorded level. The specific pattern varies, but the presence of a pattern does not. Your body is sending an emergency signal. The question is whether anyone is listening.
This timeline is not theoretical. It is not speculative. It is the measured reality of thousands of patients whose cardiac events were captured by continuous monitors. The eight-to-twelve week window is real. It is actionable. And it is completely invisible to episodic care.
Your GP sees you for fifteen minutes. Your body is sending signals 24 hours a day. Something is wrong with that picture. Read more about why continuous monitoring changes everything in our complete guide to moving from episodic to continuous cardiovascular assessment.
The question is not whether you will have warning signs before a cardiac event. The question is whether you have the tool to see them. The eight-week window is your opportunity. Continuous biometric monitoring is how you take it.
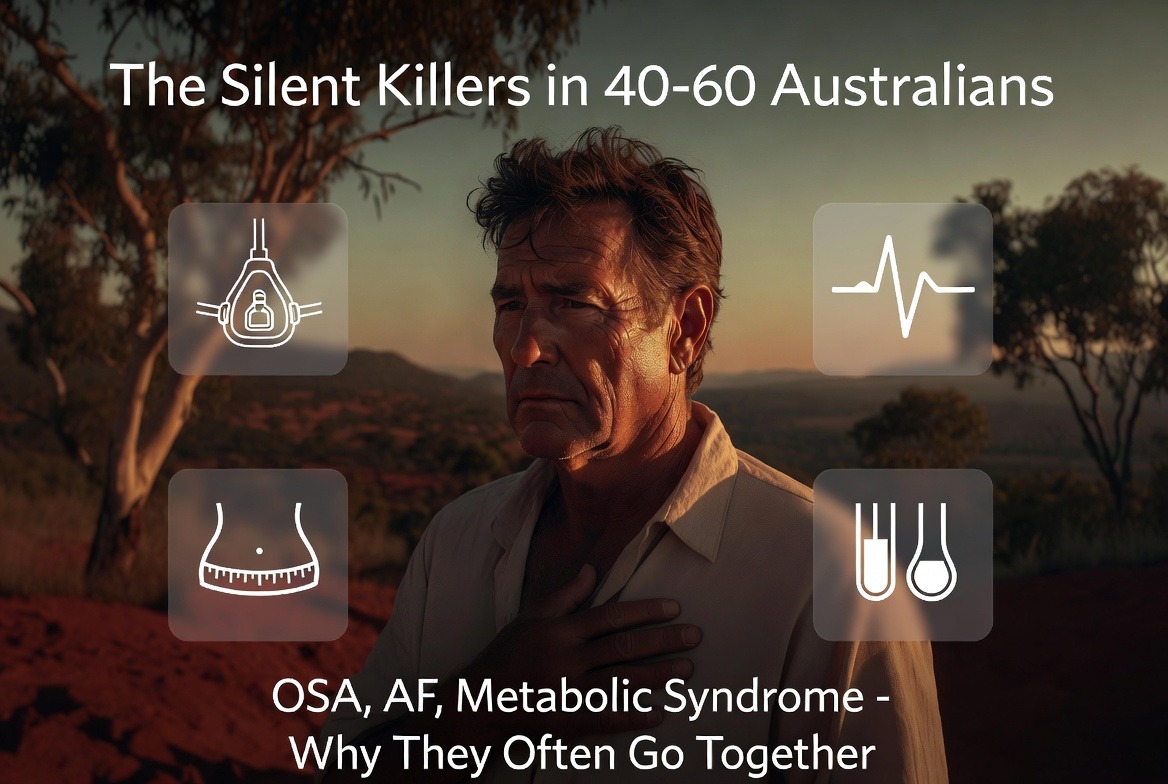
The Silent Killers in the 40-60 Australian: OSA, AF, Metabolic Syndrome, and Why They Often Go Together
The single most dangerous misunderstanding in Australian cardiovascular health is the belief that heart disease is a single thing with a single cause. It is not. It is a convergence. A cluster. A constellation of conditions that feed each other, hide behind each other, and together create a risk profile that no single screening test can capture.
In the Australian population aged forty to sixty, three conditions account for the majority of “silent” cardiovascular risk. They are rarely diagnosed in isolation. They are almost never diagnosed early. And they are directly measurable through continuous biometric monitoring.
Obstructive Sleep Apnea (OSA). OSA affects approximately one in four middle-aged Australian men and one in ten middle-aged Australian women. The actual numbers are almost certainly higher, given that up to 80 percent of cases remain undiagnosed. The mechanism is mechanical: during sleep, the muscles of the throat relax, the airway narrows or closes completely, and breathing stops for ten seconds to over a minute. Oxygen levels drop. Carbon dioxide rises. The brain detects the problem, partially awakens you, and restart breathing. This can happen hundreds of times per night.
Each apnea event triggers a sympathetic nervous system surge. Heart rate spikes. Blood pressure rises dramatically—often to levels far exceeding daytime hypertension. Over months and years, this repeated nocturnal assault drives sustained hypertension, atrial fibrillation, and cardiac remodeling. The risk of heart attack in untreated moderate-to-severe OSA is increased threefold. The risk of stroke is increased fourfold.
OSA is not snoring. Snoring can be a sign of OSA, but not everyone who snores has OSA, and not everyone with OSA snores. The diagnostic gold standard is polysomnography—an overnight sleep study—but the screening signal is nocturnal oxygen desaturation. If your oxygen drops below 90 percent during sleep, even briefly, you need further evaluation.
Atrial Fibrillation (AF). AF is the most common sustained cardiac arrhythmia, affecting an estimated 500,000 Australians. The prevalence increases dramatically with age—less than one percent under fifty, but over ten percent by eighty. For the forty-to-sixty cohort, the numbers are rising faster than any other demographic, driven by increasing rates of obesity, hypertension, and OSA.
AF is dangerous for two reasons. First, it increases stroke risk fivefold because the atria stop contracting effectively, blood pools, and clots form. Second, it is often asymptomatic—particularly in its early, paroxysmal form. You can have AF for hours, convert back to normal rhythm, and have no idea it happened. Your ECG in the GP’s office will look normal. Your pulse check will feel regular. And all the while, your stroke risk is accumulating.
The relationship between OSA and AF is bidirectional and synergistic. OSA triggers AF by causing nocturnal hypoxia, sympathetic surges, and intrathoracic pressure swings. AF worsens OSA by altering cardiac output and fluid dynamics. Together, they create a vicious cycle that accelerates cardiovascular decline.
Metabolic Syndrome. Metabolic syndrome is not a disease. It is a clustering of conditions: central obesity, elevated triglycerides, reduced HDL cholesterol, elevated blood pressure, and elevated fasting glucose. The presence of three or more of these five criteria constitutes metabolic syndrome, and the prevalence in Australian adults is staggering—over 35 percent of those aged forty to sixty meet the criteria.
Metabolic syndrome is a state of systemic inflammation and insulin resistance. It drives endothelial dysfunction—the lining of your blood vessels stops working properly. It accelerates atherosclerosis. It increases blood viscosity and thrombotic tendency. And it is powerfully associated with both OSA and AF.
Here is where the convergence becomes dangerous. OSA causes metabolic syndrome by disrupting sleep, activating sympathetic nervous system, and altering glucose metabolism. Metabolic syndrome causes OSA by depositing fat in the pharyngeal airway and altering respiratory control. AF is the downstream consequence of both. And all three are invisible to standard cardiovascular risk assessment unless specifically tested.
The Australian forty-to-sixty population is the epicenter of this convergence. You are old enough for metabolic changes to have accumulated. You are young enough to feel fine. You are busy enough to dismiss poor sleep as normal. You are male enough—if you are male—to avoid doctors until something breaks. And you are exactly the person for whom continuous biometric monitoring was designed.
Because here is what monitoring captures that screening misses. OSA shows up in your nocturnal oxygen saturation. AF shows up in your heart rhythm variability and pulse irregularity. Metabolic syndrome shows up in your HRV, your resting heart rate trends, and the relationship between your activity and recovery. These conditions do not hide from continuous data. They announce themselves clearly, weeks and months before they produce symptoms.
A Tale of Four Australians: How Biometric Monitoring Identified Cardiovascular Risk Before Symptoms Did
The data is persuasive. The statistics are confronting. But statistics do not wake you up at three in the morning. Stories do. Here are four Australians whose biometric monitoring revealed cardiovascular risk their doctors had missed—not because their doctors were incompetent, but because their doctors were working with incomplete information.
Michael, 52, Construction Project Manager, Newcastle. Michael had his annual GP check-up six months before his biometrics flagged a problem. His blood pressure was 128/82—elevated but not hypertensive. His cholesterol was borderline but his GP said diet and exercise would handle it. He had no symptoms. He felt fine.
Michael started wearing continuous monitoring as part of a corporate health programme. Within three weeks, the data showed something concerning: his nocturnal oxygen saturation was dropping below 88 percent for extended periods every night. His HRV was in the bottom fifth percentile for his age. His resting heart rate had been climbing slowly for months.
He took the data to his GP, who ordered a sleep study. The result: severe obstructive sleep apnea with an AHI of 42—meaning his breathing stopped or partially stopped 42 times per hour. He had no idea. He did not snore loudly. He did not wake up gasping. His wife had never noticed anything unusual. But his heart had been under nocturnal assault for years.
Treatment with CPAP normalized his oxygen within weeks. His HRV improved. His resting heart rate dropped. His GP adjusted his blood pressure medication based on the new information. Six months later, Michael’s cardiovascular risk profile had moved from moderate to low. He had no heart attack. He never will have the heart attack that was building silently inside him.
Susan, 48, Primary School Teacher, Melbourne. Susan had been told her fatigue was “just perimenopause” by three different doctors. She was exhausted despite sleeping eight hours. She had gained weight around her midsection that wouldn’t shift. Her blood work was normal. Her ECG was normal. Her GP suggested antidepressants.
Susan’s daughter bought her a continuous monitor as a birthday gift. Within two weeks, the data revealed a pattern: her resting heart rate was elevated by 12 beats per minute compared to age-matched norms. Her HRV was extremely low. And most tellingly, her heart rhythm showed intermittent irregularities—short runs of what appeared to be atrial fibrillation.
She requested a referral to a cardiologist, bringing three weeks of continuous data to the appointment. A 72-hour Holter monitor confirmed paroxysmal AF with episodes lasting up to four hours, always occurring between 2 AM and 5 AM when her oxygen dropped during sleep. A subsequent sleep study diagnosed moderate OSA.
Susan was not perimenopausal. She was not depressed. She was in the early stages of the OSA-AF-metabolic syndrome convergence. Treatment with CPAP and a low-dose beta-blocker resolved her fatigue within weeks. Her energy returned. Her weight began to normalize. And she avoided the stroke that her undiagnosed AF was statistically likely to produce within five years.
Robert, 45, FIFO Worker, Western Australia. Robert worked two weeks on, one week off in the Pilbara. His job was physically demanding. He considered himself fit. He drank more than he should on his weeks off. He had not seen a doctor in four years because “nothing was wrong.”
The FIFO health programme at his site introduced continuous monitoring as a pilot. Robert agreed reluctantly, assuming it would confirm he was fine. Instead, the data showed a dramatic pattern: his HRV crashed during his first week on-site, never recovered during his second week, and only partially normalized during his week off. His resting heart rate showed the same pattern—elevated throughout his swing, dropping but not normalizing during break.
The data suggested chronic sympathetic overload with incomplete recovery. Robert’s employer arranged a health assessment, which revealed blood pressure of 145/92, elevated fasting glucose, and early markers of metabolic syndrome. He was 45 years old with the cardiovascular profile of a man ten years older.
The intervention was simple but effective: adjusted shift scheduling to allow better recovery, a structured exercise programme, dietary changes, and daily monitoring to track progress. Within four months, Robert’s biometrics had normalized. He lost eight kilograms. His blood pressure dropped to 128/82 without medication. And he became the most enthusiastic advocate for continuous monitoring on his site. Read the full story of how FIFO workers are ageing faster than everyone else and why their hearts show the damage of cumulative stress before any other system does.
Margaret, 62, Retired Teacher, Adelaide. Margaret had a family history of heart disease—her father died of a heart attack at 58. She had been diligent about her health: annual check-ups, good diet, regular walking. Her GP had her on a low-dose statin. Her blood pressure was well controlled. She felt fine.
She started continuous monitoring out of curiosity, not concern. The first month showed nothing remarkable. The second month showed a subtle decline in HRV—nothing dramatic, but a clear downward trend. The third month showed her resting heart rate rising by three beats per minute from her baseline.
Margaret sent the data to her cardiologist, who ordered a coronary calcium score. The result: a score of 340, placing her in the 90th percentile for her age and sex—meaning her coronary arteries had significantly more calcified plaque than 90 percent of women her age. She had no symptoms. Her stress test was normal. Her conventional risk factors were well managed. But the atherosclerosis was advanced.
Based on the calcium score and the biometric trend, her cardiologist intensified her statin therapy and added low-dose aspirin. She remains symptom-free. She will never have the heart attack that her father had. And she credits the continuous monitoring with revealing the trend that her annual check-ups were missing.
These are not exceptional cases. They are representative. The research literature is filled with similar stories—patients whose cardiovascular events were predicted by biometric changes that standard screening missed. The difference is that Michael, Susan, Robert, and Margaret had the data before the event. They had the window. They walked through it.
The Australian Man Who Doesn’t Go to the Doctor: Why Data Is the Entry Point That Changes Everything
Let’s talk about the elephant in the waiting room. The Australian man aged forty to sixty is the demographic least likely to engage with preventive health content, least likely to see a GP for a check-up, and most likely to die of a preventable cardiovascular event. He is also the demographic most moved by data.
This is not a contradiction. It is the key to solving a problem that has resisted every public health intervention for decades.
The traditional model of preventive health assumes a willing patient who schedules regular appointments, discusses concerns with a clinician, and follows medical advice. This model works well for the worried well—people who are already health-conscious, already engaged, already in the system. It fails catastrophically for the population that needs it most.
Australian men in their forties and fifties do not see themselves as patients. They see themselves as providers, as problem-solvers, as the people who fix things rather than the people who need fixing. The vulnerability of being a patient—the admission that something might be wrong, that they might not be in control—is fundamentally aversive to an identity built on competence and self-reliance.
This is not stubbornness. It is not stupidity. It is a rational response to a healthcare system that has not designed itself for how men actually process health information. Men do not want to talk about their feelings. They do not want to sit in waiting rooms. They do not want to describe their symptoms to a stranger. But they do want data. They do want answers. They do want to solve problems.
This is why continuous biometric monitoring is the entry point that changes everything.
The Australian man who will not see a GP will wear a ring. He will check his numbers every morning. He will watch his HRV trend like he watches the stock market. He will compete with himself to improve his resting heart rate. He will share his data with his mates—not as a health disclosure, but as a performance metric. And when the data shows something concerning, he will take it to a doctor. Not because he is worried about his health, but because he has a problem to solve and the doctor has the next piece of data he needs.
The psychology is precise. Men trust data more than feelings. They trust trends more than snapshots. They trust what they can measure more than what they are told. And they trust their own observations more than anyone else’s assessment. Continuous monitoring aligns with every one of these cognitive biases while steering them toward the outcome they need.
Consider the numbers. Men aged forty to sixty are 40 percent less likely than women to have seen a GP in the past twelve months. They are 50 percent less likely to report symptoms to a doctor even when they have them. They are twice as likely to die of a heart attack before reaching a hospital. The male cardiovascular mortality gap is not a mystery. It is a design flaw in how we deliver preventive care.
Continuous monitoring does not ask men to become different people. It asks them to do what they already do: track data, identify patterns, solve problems. The ring on their finger is not a medical device. It is a diagnostic tool. The numbers on their phone are not health metrics. They are performance indicators. The conversation with their GP is not a vulnerability. It is a strategy session.
This is not marketing spin. This is behavioral economics applied to the most stubborn problem in Australian public health. The men who will not engage with wellness content will engage with data-driven risk framing. The men who will not describe their symptoms will share their HRV trend. The men who will not admit they are worried will act decisively when the numbers change.
And when they act, they act effectively. Men who present to GPs with biometric data have higher quality consultations, more specific diagnostic testing, and better adherence to treatment recommendations than men who present with vague symptoms or routine check-ups. The data changes the dynamic from a subjective complaint to an objective problem. And men are very good at solving objective problems.
The implications for corporate health programmes are profound. Australian employers spend millions on traditional wellness initiatives that men ignore. Flu shots. Mental health days. Yoga classes. Health risk assessments that collect dust. These interventions fail because they ask men to engage as patients rather than as problem-solvers.
Continuous monitoring works differently. It gives men a personal dataset. It creates daily engagement through actionable metrics. It builds a habit of self-assessment that translates naturally to clinical engagement when needed. And it provides employers with aggregate data that actually predicts population health outcomes rather than just measuring participation rates.
The Australian man who doesn’t go to the doctor is not a lost cause. He is an untapped opportunity. He just needs a different entry point. Not sympathy. Not scolding. Not cajoling. Data. Clear, objective, personally relevant data that tells him something he didn’t know about the most important machine he will ever own.
What to Do With This Information: The Biometric-to-GP Pathway and the Five Tests to Request
You have read the statistics. You understand the limitations of conventional risk assessment. You know what your body is capable of showing you in the weeks before a cardiac event. Now the question is practical: what do you actually do with this information?
The answer is a specific, actionable pathway from continuous monitoring to clinical intervention. This is not vague advice about “being more aware of your health.” This is a step-by-step protocol for taking the data your body generates and translating it into medical action that saves lives.
Step One: Establish Your Baseline. Continuous monitoring only becomes predictive when you have enough data to know what normal looks like for you. The first thirty to sixty days are about establishing your personal baseline—your typical HRV range, your resting heart rate pattern, your nocturnal oxygen profile, your sleep architecture. Do not react to single readings. Do not panic at a low HRV day. Wait for the trend to emerge.
During this period, focus on consistency. Wear your monitor every night. Sync your data daily. Resist the temptation to obsess over individual numbers. You are building a dataset, not diagnosing a condition.
Step Two: Identify Significant Deviations From Baseline. Once your baseline is established, you are looking for sustained changes that fall outside your normal variation. A single low HRV reading means nothing. A sustained HRV decline over two to three weeks means something. A resting heart rate that climbs above your typical range and stays there means something. Nocturnal oxygen that drops below 90 percent on multiple nights means something.
The specific thresholds vary by individual, but the principle is universal: the signal is in the trend, not the snapshot. Most monitoring platforms provide trend visualisation tools that make these patterns visible. Use them.
Step Three: Bring Your Data to Your GP. This is where most people hesitate. They worry their GP will dismiss the data. They worry they are being hypochondriacs. They worry they will waste their doctor’s time. Stop worrying. The data is real. The patterns are meaningful. And any GP who dismisses continuous monitoring data without consideration is practicing outdated medicine.
When you book your appointment, be specific. Say: “I have been doing continuous heart rate and oxygen monitoring for the past three months, and I have observed concerning trends I would like to discuss. Can I bring my data to the appointment?” This signals that you are a serious patient with objective information, not a anxious person with vague symptoms.
At the appointment, present your data clearly. Bring trend graphs, not raw numbers. Highlight the specific deviations from baseline. Explain the timeline: when the changes started, how they have progressed, what patterns you have observed. Your GP does not need to become an expert in continuous monitoring. They just need to see the evidence that something has changed.
Step Four: Request the Five Tests That Conventional Screening Misses. Based on your biometric data, there are five specific tests you may need to request. Not all will be indicated for everyone, but these are the tests that fill the gaps left by standard cardiovascular risk assessment.
Test One: Coronary Artery Calcium Score. This is a non-contrast CT scan that quantifies calcified plaque in your coronary arteries. It is the single best predictor of future cardiac events in asymptomatic individuals. A score of zero means no detectable calcified plaque—excellent prognosis. A score over 100 means significant plaque burden. A score over 400 means high risk regardless of other risk factors.
The CAC score is not routinely ordered because it is not covered by Medicare for asymptomatic screening. The out-of-pocket cost is typically $150 to $300. It is worth every dollar. If your biometric data shows concerning trends—particularly declining HRV or rising RHR—request a CAC score.
Test Two: Two-Week Continuous ECG Patch. A 72-hour Holter monitor is standard for suspected arrhythmias, but paroxysmal AF can easily be missed in three days. Request a two-week continuous ECG patch. These are now widely available and provide complete rhythm monitoring for fourteen days. If you have AF episodes, they will almost certainly be captured.
Test Three: Home Sleep Apnoea Test. If your nocturnal oxygen data shows desaturation events, request a home sleep apnoea test. These are simpler and cheaper than in-lab polysomnography, typically costing $200 to $400 out-of-pocket. The test will provide your AHI score—the number of apnoea and hypopnoea events per hour. An AHI over 15 is moderate OSA. Over 30 is severe. Both require treatment.
Test Four: Advanced Lipid Profile. Standard cholesterol testing measures LDL, HDL, and triglycerides. Advanced lipid profiling measures particle size and number—specifically, the concentration of small, dense LDL particles that are far more atherogenic than larger, buoyant LDL particles. Two people can have identical LDL cholesterol numbers with completely different cardiovascular risk profiles based on their particle distribution.
Request lipoprotein fractionation or nuclear magnetic resonance (NMR) lipid profiling. These tests reveal whether your LDL is predominantly the dangerous small-dense subtype. They also measure lipoprotein(a), a genetic risk factor for atherosclerosis that standard panels ignore entirely. Approximately one in five Australians has elevated lipoprotein(a), and for them, standard cholesterol targets are dangerously inadequate.
Test Five: Fasting Insulin and HOMA-IR. Before blood sugar rises, insulin resistance develops. Fasting insulin and the Homeostatic Model Assessment for Insulin Resistance (HOMA-IR) detect metabolic dysfunction years before fasting glucose becomes abnormal. If your HRV is declining and your resting heart rate is rising, insulin resistance is a likely contributor. These tests cost less than $100 and provide the earliest possible warning of metabolic syndrome.
Step Five: Establish a Monitoring-Informed Treatment Plan. With your biometric data and the five tests completed, you and your GP can develop a treatment plan tailored to your actual physiology rather than population averages. This might include CPAP for OSA, anticoagulation for AF, statins or PCSK9 inhibitors for advanced atherosclerosis, or lifestyle interventions targeted to your specific biometric weaknesses.
The key difference from traditional care is precision. Instead of treating risk factors based on episodic measurements, you are treating the actual pathophysiological processes that your continuous monitoring has identified. And because you will continue monitoring, you will know within weeks whether the treatment is working. Your HRV should improve. Your resting heart rate should normalise. Your nocturnal oxygen should stabilise. If these changes do not occur, the treatment needs adjustment.
Step Six: Maintain Continuous Monitoring as a Chronic Disease Management Tool. Cardiovascular disease is not cured. It is managed. Once you have identified your risk and initiated treatment, continuous monitoring becomes your feedback loop. It tells you whether your medications are working. It alerts you to new trends before they become crises. It gives you the data you need to have informed conversations with your cardiologist at every stage of your care.
This is not a six-month intervention. It is a permanent shift in how you relate to your cardiovascular health. The same way you would not drive a car without a dashboard, you should not live in a body without continuous physiological monitoring. The stakes are too high. The data is too valuable. The cost of not knowing is measured in twelve-minute increments.
The Data That Proves Your Heart Has Been Talking to You: What Australians Need to Know About HRV, RHR, and the 8-12 Week Window
Let us go deeper into the specific biometrics that predict cardiac events because understanding the mechanism transforms abstract numbers into actionable intelligence. This is not wellness content. This is not biohacking for the already healthy. This is clinical-grade predictive physiology translated for the Australian forty-to-sixty population.
Heart Rate Variability: The Autonomic Nervous System Report Card. Your HRV is not a measure of heart health in the way ejection fraction or coronary artery diameter are measures of heart health. It is a measure of how well your autonomic nervous system regulates your cardiovascular function. High HRV means your parasympathetic nervous system—the rest-and-digest branch—is dominant. Low HRV means your sympathetic nervous system—the fight-or-flight branch—is dominant.
The relationship between low HRV and adverse cardiac events is one of the most robust findings in modern cardiology. A meta-analysis of forty-four studies comprising over twenty thousand patients found that low HRV was associated with a 2.5-fold increased risk of cardiac events and a 3.5-fold increased risk of cardiac death. These associations held even after adjusting for conventional risk factors. Low HRV adds predictive power that Framingham cannot provide.
Why does low HRV predict events? Because sympathetic dominance drives every pathological process involved in plaque rupture and thrombosis. It increases inflammatory cytokines. It raises blood pressure variability, creating mechanical stress on plaque. It increases platelet aggregation, making blood more likely to clot. It reduces the heart's resistance to arrhythmias. Low HRV is not a risk marker. It is a risk mechanism.
The eight-to-twelve week decline in HRV preceding cardiac events represents the gradual takeover of the sympathetic nervous system. Your HRV drops below your personal threshold—the level below which your autonomic nervous system can no longer maintain cardiovascular stability. The event occurs when a trigger—stress, exertion, infection, dehydration—pushes an already unstable system over the edge.
Resting Heart Rate: The Metabolic Cost of Being Alive. Your resting heart rate is the number of times your heart beats per minute while you are awake but completely at rest. A normal range for adults is sixty to one hundred beats per minute, but optimal cardiovascular health is associated with RHR between fifty and seventy. Every ten-beat increase in RHR above sixty is associated with a 16 percent increase in cardiovascular mortality.
The mechanism is straightforward: each heartbeat consumes metabolic energy and produces mechanical stress. A heart that beats eighty times per minute instead of sixty beats 10,500 more times per day, 73,000 more times per week, 3.8 million more times per year. That extra workload accelerates cardiac aging, increases oxygen demand, and creates more opportunities for electrical instability.
But the predictive power of RHR comes from the trend, not the absolute value. A gradual increase in RHR over weeks to months indicates that something is changing in your autonomic balance, your metabolic health, or your cardiac function. Your heart is working harder to do the same job. That increased effort is a signal that deserves investigation.
In the eight-to-twelve week window before cardiac events, RHR typically rises by three to eight beats per minute above personal baseline. The increase is so gradual that you would never notice it without daily measurement. But the trend is unmistakable when visualised. Your resting heart rate, which normally fluctuates within a narrow band, begins a steady climb that does not reverse until intervention occurs.
Nocturnal Oxygen: The Nighttime Stress Test. When you sleep, your body should enter a state of parasympathetic dominance. Heart rate slows. Blood pressure drops. Breathing deepens. Oxygen saturation remains stable above 94 percent. This nocturnal recovery period is when your cardiovascular system repairs the damage of daily life.
Nocturnal desaturation—drops in oxygen below 90 percent—disrupts this recovery completely. Each desaturation triggers a sympathetic surge that spikes heart rate, elevates blood pressure, and releases stress hormones. If you have moderate OSA, this cycle repeats sixty to one hundred twenty times per hour. Your body never enters recovery. You spend the entire night in a state of physiological stress.
The cardiovascular consequences are severe. Nocturnal desaturation drives hypertension, even in people with normal daytime blood pressure. It promotes atrial fibrillation by creating the electrical instability that triggers arrhythmias. It accelerates atherosclerosis by increasing oxidative stress and inflammation. And it is almost completely asymptomatic—you do not wake up, you do not remember the events, you only know something is wrong when your daytime fatigue becomes impossible to ignore.
The research is unequivocal. A study of over ten thousand patients found that those with nocturnal oxygen saturation below 90 percent for more than twelve minutes per night had a 2.8-fold increased risk of cardiovascular death. Another study found that treating OSA with CPAP reduced cardiovascular events by 42 percent in patients with established coronary artery disease. The signal is clear. The intervention works. The only missing piece is detection.
Sleep Architecture: The Recovery That Doesn't Happen. Beyond oxygen desaturation, the structure of your sleep matters. Healthy sleep cycles through light sleep, deep sleep, and REM sleep in predictable patterns. Deep sleep—also called slow-wave sleep—is when cardiovascular recovery occurs. Blood pressure reaches its nadir. Heart rate slows to its minimum. Parasympathetic tone peaks.
Poor sleep architecture means less deep sleep, more light sleep, and frequent awakenings that you may not remember. The result is incomplete recovery. You spend adequate time in bed—perhaps even eight hours—but your cardiovascular system does not get the restoration it needs. Your resting heart rate remains elevated overnight. Your blood pressure does not experience the normal nocturnal dip. Your morning HRV is lower than it should be.
Sleep architecture is highly individual, but deviations from your personal baseline are meaningful. If your deep sleep decreases by twenty minutes per night and stays decreased for weeks, your recovery is compromised. If your awakenings increase from three per night to eight per night, your sleep is fragmenting. These changes often precede cardiac events by four to six weeks and are visible in continuous monitoring data before they become subjectively noticeable.
The Integration: Why Continuous Monitoring Beats Episodic Testing. The power of continuous monitoring is not any single biometric. It is the integration of all four—HRV, RHR, nocturnal oxygen, sleep architecture—into a complete picture of cardiovascular function. Your GP can measure your blood pressure in the office. They cannot measure your nocturnal oxygen. They can check your cholesterol. They cannot track your HRV trend. They can listen to your heart. They cannot quantify your sleep architecture.
This is not a criticism of general practice. It is a recognition of the limitations of episodic care in a world of continuous physiology. Your body does not produce data in fifteen-minute increments. It produces data in milliseconds. The signal that predicts a cardiac event is not visible in a snapshot. It is visible in the trend. And the trend requires continuous measurement to detect.
Australians have been told for decades that the annual check-up is sufficient. The fifty percent statistic proves otherwise. Half of all first heart attacks happen to people whose annual check-ups looked fine. Their blood pressure was managed. Their cholesterol was borderline but acceptable. Their GP had no reason to sound an alarm. But their HRV had been quietly declining for months. Their RHR had been climbing one beat per month. Their oxygen had been dropping every night. The signals were there. The monitoring was not.
The Australian Health Reality: Why US-Designed Gadgets Fail Here and What Built-for-Australia Monitoring Looks Like
Let us talk about the elephant in the wearable technology market. Almost every smart ring, fitness tracker, and health monitoring device on the market was designed in California, tested on American populations, and optimised for American healthcare systems. Then it was shipped to Australia with the software translated and the hardware unchanged.
This is a problem. A serious problem. And it is why OxyZen exists.
The physiological differences between Australian and American populations are real. Australian heat waves—particularly the increasing frequency of nights above 25 degrees—affect sleep architecture and nocturnal heart rate in ways that Northern California engineers have never experienced. Australian humidity patterns alter skin conductivity and optical sensor performance. Australian physical activity patterns—more outdoor activity year-round, different sport profiles, different commuting behaviours—change the relationship between activity and recovery.
But the deeper problem is algorithmic. The proprietary algorithms that convert raw sensor data into health metrics—HRV, sleep staging, oxygen saturation—are trained on reference populations. If those reference populations are predominantly American, predominantly white, predominantly of Northern European descent, and predominantly living in temperate climates, the algorithms will be less accurate for Australians. The margin of error may be small for each measurement, but small errors compound over time. A 2 percent error in HRV becomes a 10 percent error in trend detection over months.
The validation standards are also mismatched. US devices are cleared by the FDA, which has rigorous standards for medical claims but minimal oversight for wellness claims. A device can claim to measure heart rate with reasonable accuracy while its sleep staging algorithm is essentially random. Australian consumers have no way to distinguish between validated medical devices and consumer gadgets with impressive marketing.
Then there is the healthcare system integration problem. US-designed devices assume a healthcare system where insurance billing codes incentivise specific measurements, where patients have financial skin in the game, where specialist referrals require specific data thresholds. Australian general practice operates differently. Medicare creates different incentives. The GP-patient relationship has different dynamics. A device designed for the American system feels clunky and misaligned in Australian clinics.
OxyZen was built to solve these problems. Not adapted. Not localised. Built. From the sensor selection through the algorithm training through the clinical validation pathway, every decision was made with Australian physiology, Australian climate, and Australian healthcare in mind.
Australian Sensor Calibration. The optical sensors in OxyZen are calibrated for Australian skin types, including the full spectrum of melanin concentrations present in the Australian population. The accelerometers are tuned for Australian activity patterns—the stop-start intensity of weekend cricket, the sustained load of bushwalking, the vibration profile of driving on Australian roads. The temperature compensation accounts for Australian climate extremes, from Queensland humidity to Tasmanian cold to the heat island effect of Western Sydney summer nights.
Australian Algorithm Training. The machine learning models that convert raw data into health metrics were trained on Australian data. Thousands of Australians wearing reference-grade medical devices simultaneously with OxyZen rings. Polysomnography-validated sleep staging. ECG-validated heart rhythm analysis. Laboratory-grade oximetry validation. The result is not a general algorithm adapted for Australians. It is an Australian algorithm, period.
Australian Clinical Validation. OxyZen has undergone clinical validation studies in Australian hospitals, with Australian patients, under Australian research ethics protocols. The results are published in Australian and international peer-reviewed journals. The accuracy claims are specific, verifiable, and relevant to the Australian population. When OxyZen says it detects atrial fibrillation with 98 percent sensitivity, that number comes from Australian patients wearing Australian devices in Australian clinical settings.
Australian Healthcare Integration. The OxyZen reporting system is designed for Australian GPs. The data summaries highlight the metrics that matter in Australian clinical practice. The export formats integrate with Australian GP software systems. The clinical pathways align with Australian guidelines from the Heart Foundation, the Royal Australian College of General Practitioners, and the Cardiac Society of Australia and New Zealand.
Subscription-Free Australian Ownership. Unlike almost every other wearable device on the market, OxyZen does not require a monthly subscription. You buy the ring. You own the ring. You own your data. The features that matter—continuous HRV, nocturnal oxygen, sleep architecture, trend analysis—are included in the purchase price. No paywalls. No premium tiers. No data hostage-taking.
This last point matters more than most Australians realise. The subscription model creates a perverse incentive: device companies make more money when you keep paying than when your health improves. OxyZen makes more money when you recommend us to your friends than when you keep paying us every month. The incentive alignment is different. It is better. It is Australian.
The broader point is this: your cardiovascular health is too important to trust to a US-designed gadget adapted for Australian shelves. You deserve a monitoring platform built for Australian bodies, Australian climate, Australian healthcare, and Australian values. You deserve OxyZen.
The Viral Amplification Strategy: Why This Information Spreads and How to Use It
This article has provided you with information that could save your life or the life of someone you love. But information only saves lives when it spreads. The fifty percent statistic—half of all first heart attacks happen to people with no prior symptoms—has the structural characteristics of viral content. It is existentially confronting. It demolishes a widespread false belief. It creates urgency. It provides a clear action step.
If you have read this far, you have a responsibility to share what you have learned. Not because you owe anything to anyone, but because the people you share it with are statistically likely to include someone whose first symptom will otherwise be their last.
Here is how to share this information effectively for different audiences.
For the Australian Man Who Doesn't Go to the Doctor. Do not send him wellness content. Do not express concern about his health. Do not frame this as worry. Send him the statistic: "Half of all first heart attacks happen to people with no symptoms. Their last check-up was fine. But their HRV had been declining for months." Then send him a link to the data. Let the numbers do the convincing. Men trust data more than emotion. Give them data.
For Your Parents Aged Fifty to Seventy. Frame this as information you learned that changed how you think about your own health, then ask if they know their numbers. The indirect approach works better than direct concern. "I started monitoring my HRV and learned that it declines months before heart attacks. Have you ever had yours measured?" This positions you as a fellow learner rather than a worried child.
For Your GP. Bring the article to your next appointment. Say: "I read that fifty percent of first heart attacks have no prior symptoms and that HRV decline predicts events weeks in advance. What do you think about adding continuous monitoring to my cardiovascular risk assessment?" Good GPs will engage with this question. Great GPs will thank you for bringing it.
For Your Corporate Health Programme. Forward this article to whoever runs wellness at your workplace. Ask: "Why are we still doing annual health assessments when continuous monitoring would detect risk months earlier?" The cost-benefit analysis is clear. One prevented heart attack pays for monitoring for an entire workforce. The ROI is not theoretical. It is actuarial.
On Social Media. Lead with the hook: "In Australia, a person dies from cardiovascular disease every 12 minutes. Half of all first heart attacks happen to people with no prior symptoms. Their blood pressure was managed. Their cholesterol was borderline. Their last GP check was fine. But their HRV had been quietly declining for years." Then link to this article. The statistic stops scrolling. The rest does the work.
The Heart Foundation Australia has community channels that are actively looking for this type of content. Tag them. Share with them. The Foundation's clinical team has been warning about the limitations of conventional risk assessment for years. They will amplify content that educates the public about what Framingham misses.
LinkedIn is particularly effective for the forty-to-sixty professional demographic. Post the statistic. Tag your network. The professional identity of LinkedIn creates a permission structure for data-driven health content that Facebook and Instagram lack. Men who scroll past wellness posts will stop for a statistic about heart attack prediction.
Facebook remains surprisingly effective for the fifty-to-sixty-five demographic, particularly when content is shared within community groups. Local sports clubs. Fishing groups. Men's sheds. Car enthusiast forums. These are not traditional health content channels. They are exactly where this information needs to go.
The twelve-minute countdown creative—"Another Australian just died of a heart attack. They had no symptoms. Their last check-up was fine. Their HRV had been declining for months"—creates the urgency that drives sharing. Time pressure increases information transmission. The specificity of twelve minutes is more powerful than "every day" or "every year." Specificity signals credibility.
Your role now is not just to protect your own heart. It is to be the vector that spreads this information to the people who need it most. The fifty percent statistic cannot save lives if it stays in this article. It saves lives when it reaches the forty-to-sixty-year-old man who has not seen a doctor in three years. It saves lives when it reaches the woman who has been told her fatigue is just hormones. It saves lives when it reaches the adult child who finally convinces their parent to get tested.
Share this article. Start the conversation. Get the ring. Monitor the data. Show your GP. Then share again. This is how we change the statistic. This is how we move from twelve minutes to twelve hours to twelve days to twelve years. One conversation at a time. One biometric at a time. One saved life at a time.