Your Doctor Sees You for 15 Minutes a Year. Your Body Is Sending Signals 24 Hours a Day. Something Is Wrong With That Picture.
Limited doctor visits miss continuous body signals. Real-time health data highlights a gap between occasional checkups and the body’s constant communication about your health.
Your Doctor Sees You for 15 Minutes a Year. Your Body Is Sending Signals 24 Hours a Day. Something Is Wrong With That Picture.
The average Australian adult will spend roughly 15 minutes with their GP in an entire year. That is not a typo. For the majority of people who are not managing a complex chronic condition, the total face-to-face time with the one person nominally responsible for their medical well-being amounts to less time than it takes to watch a single episode of a sitcom.
Fifteen minutes. Three hundred and sixty-five days. Do the math on that ratio and you will arrive at something deeply unsettling: your doctor sees you for 0.0028 percent of your year. The remaining 99.9972 percent of your life happens entirely outside the clinical gaze.
Now consider what happens inside that 15-minute window. You are asked to recall every relevant health event that has occurred since your last visit. You are asked to remember when your symptoms started, what made them better or worse, how often they occurred, and whether anything else changed in your life that might be relevant. You are essentially being asked to summarize 8,760 hours of lived experience into a 90-second verbal summary, because the remaining 13 minutes and 30 seconds will be consumed by the physical exam, the note-taking, the prescription writing, and the referral crafting.
This is not a failure of individual doctors. Australian GPs are among the most highly trained primary care physicians in the world, and they are operating under structural constraints that would break any system. The average GP sees 30 to 40 patients per day. They are compensated based on throughput. The Medicare Benefits Schedule rewards volume, not depth. A 15-minute consult is the financial unit of Australian primary care.
But chronic disease does not operate on a 15-minute schedule. Neither do early warnings. Neither do the subtle, cumulative physiological changes that precede a heart attack by weeks, or pre-diabetes by years, or burnout by months.
Something is wrong with that picture. And the only way to fix it is to stop pretending that episodic healthcare can do what it was never designed to do.
The Appointment Gap: What Happens to Your Health Between GP Visits
Let us name the problem clearly. Call it the Appointment Gap. It is the chasm of time between clinical encounters during which the vast majority of your health actually happens. Your blood pressure fluctuates. Your heart rate variability shifts in response to stress, sleep, and recovery. Your blood glucose rises and falls with every meal. Your oxygen saturation changes with your environment and your breathing. Your body is generating a continuous stream of physiological data every second of every day.
None of that data is captured in a 15-minute appointment.
Here is what the Appointment Gap looks like in practical terms. A 55-year-old man in suburban Melbourne has hypertension managed with medication. He sees his GP every six months. His blood pressure is checked in the office, and it looks acceptable — 128/82. The GP nods, renews the prescription, and schedules the next appointment. What neither of them knows is that this patient’s blood pressure spikes to 160/95 every weekday between 3 PM and 6 PM during his commute home. It has been doing this for three years. The nocturnal dip that should occur during sleep has been flattening for eighteen months. His blood pressure variability — a stronger predictor of cardiovascular events than average blood pressure alone — has been deteriorating steadily. But the office reading looked fine. The 15-minute snapshot showed a still lake while the ocean was churning.
Or consider a 34-year-old woman in Brisbane with unexplained fatigue. She has seen three different GPs over two years. Standard blood work is normal. Thyroid, iron, B12 — all within reference ranges. She is told she is probably just stressed, or maybe she needs more sleep, or perhaps it is her age, or her job, or her children. The problem is not that her doctors are incompetent. The problem is that fatigue is a downstream symptom with dozens of potential upstream causes, and none of those causes can be identified from a blood test drawn at a single point in time. What would be required is longitudinal data — weeks of heart rate variability trending, sleep architecture analysis, circadian rhythm mapping, and activity-recovery balance tracking. That data exists. Her body is generating it right now. But no one is collecting it.
The Appointment Gap is not a minor inconvenience. It is a structural failure that produces measurable harm. A 2022 study published in the Australian Journal of General Practice found that GPs correctly identify only 34 percent of medication non-adherence cases during routine consults. Patients simply say they are taking their medication when they are not. Not because they are lying, but because they forget, or because the side effects were unpleasant, or because they ran out and never refilled. The 15-minute appointment does not create the psychological safety or the time required to surface these truths.
The gap produces diagnostic delays that cost lives. The average time from symptom onset to diagnosis for atrial fibrillation in Australia is 2.7 years. For obstructive sleep apnoea, it is 5 to 7 years. For endometriosis, it is 6 to 8 years. These are not rare diseases. They affect hundreds of thousands of Australians. And in every single case, the body was sending signals long before the diagnosis was made. The signals were just not being captured because they were happening between appointments, not during them.
This is the core tension that defines modern healthcare. We have built a system that is exceptionally good at acute intervention — setting a broken bone, draining an infection, delivering a baby, removing a tumour. That same system is structurally incapable of managing the chronic, the gradual, the cumulative, the pre-symptomatic. And yet chronic disease now accounts for 90 percent of all deaths in Australia and 85 percent of all healthcare spending.
The math does not work. The model does not work. And the only way forward is to recognize that your body is not a quarterly report. It does not operate on appointment schedules. It sends signals continuously, and those signals deserve to be heard continuously.
What Gets Missed in 15 Minutes: The Clinical Blind Spots of Episodic Care
Let us be precise about the limitations of the 15-minute consult. This is not an attack on general practice. It is a recognition that even the most skilled physician, operating with the best intentions, cannot overcome the fundamental information asymmetry that episodic care creates. The patient has lived inside their body for 8,760 hours. The doctor has 15 minutes. The gap is not bridgeable by talent or effort alone.
The Recall Problem
Human memory is not a recording device. It is a reconstructive process that degrades, compresses, and confabulates with every passing day. Ask someone to remember how many nights they woke up feeling breathless over the past three months, and you are not measuring their health. You are measuring their memory. And memory is systematically unreliable in predictable ways.
Recency bias causes patients to overreport symptoms that occurred in the days immediately preceding the appointment while underreporting symptoms from earlier weeks. Peak-end bias causes patients to remember the worst moments and the most recent moments while forgetting the pattern that connects them. Duration neglect means patients cannot accurately estimate how long symptoms lasted or how frequently they occurred. These are not character flaws. These are features of how human memory works.
A 2019 systematic review in the Journal of Patient Safety found that patients accurately recall only 40 to 60 percent of the symptom information that would be clinically relevant during a primary care visit. The rest is lost to the distortions of memory. The doctor does not know what they are missing because they do not know what they do not know. They work with the information they are given, and that information is systematically incomplete.
The White Coat Effect and Its Inverse
Blood pressure measured in a doctor’s office is not the same as blood pressure measured in your living room. The white coat effect — a transient elevation of blood pressure due to the stress of a medical encounter — affects approximately 20 percent of patients. These individuals receive hypertension diagnoses and medications they may not need because their blood pressure is only elevated when they are anxious in a clinical setting. Their real-world blood pressure is normal.
But masked hypertension is even more dangerous. Approximately 15 percent of patients have normal blood pressure in the doctor’s office but elevated blood pressure in daily life. These individuals are never diagnosed because the snapshot looks fine. They experience the cardiovascular consequences of untreated hypertension — stroke, heart attack, kidney damage — while their medical record shows reassuringly normal numbers. The 15-minute appointment does not just fail to treat masked hypertension. It actively obscures it.
The same phenomenon occurs with heart rate, heart rate variability, respiratory rate, oxygen saturation, and glucose. Every physiological parameter exhibits diurnal variation, meal response, activity response, and stress response. A single measurement cannot capture any of this. It is like judging a symphony by a single note.
What the Literature Says About Diagnostic Accuracy in Primary Care
The research on diagnostic accuracy in general practice is sobering. A large Australian study published in the Medical Journal of Australia found that GPs make the correct initial diagnosis in approximately 55 percent of cases. This is not an indictment of GP competence. It is a reflection of the constraints under which primary care operates. Limited time, limited data, limited diagnostic tools, and the reality that most presenting symptoms are ambiguous and could represent dozens of different conditions.
For rare conditions, the diagnostic delay is measured in years. For common conditions with atypical presentations, the delay is measured in months. For conditions that produce intermittent symptoms — palpitations that come and go, dizziness that occurs only in specific circumstances, pain that migrates — the delay is indefinite because the symptoms are not present during the appointment. The patient describes what happened yesterday or last week, and the doctor does their best with the description. But a description is not data.
A 2021 analysis of Australian medical negligence claims found that diagnostic error was the most common allegation, accounting for 32 percent of all claims. The most frequently missed diagnoses were cancer, myocardial infarction, and infection. In each case, the failure was not that the GP lacked the knowledge to recognize the condition. The failure was that the available information at the time of the consult was insufficient to trigger that recognition. More data would have changed the outcome. But the 15-minute appointment did not produce more data.
The Silent Deterioration
Perhaps the most troubling thing that gets missed in 15 minutes is not a diagnosis at all. It is deterioration. Chronic conditions do not typically announce themselves with dramatic events. They erode. Blood sugar creeps up over years. Heart rate variability declines gradually. Inflammatory markers drift upward. Sleep architecture fragments slowly. Each individual change is too small to notice. But the cumulative trajectory is devastating.
A patient with pre-diabetes does not wake up one day with a fasting glucose of 7.0 mmol/L. They cross that threshold after months or years of gradual increase. A patient developing heart failure does not suddenly retain fluid. Their nocturnal heart rate trends upward for months before the first symptom appears. A patient heading toward burnout does not collapse overnight. Their recovery ratios deteriorate week by week.
These trajectories are invisible in episodic care because there are no previous data points to compare against. The GP sees a glucose of 5.9 mmol/L and calls it normal. It is normal. It is also 0.4 points higher than it was two years ago, but no one knows that because no one measured it two years ago. The trajectory is invisible because the data does not exist.
This is the deepest failure of the 15-minute model. It does not just miss things. It structurally prevents the detection of change over time. And in chronic disease, change over time is the most clinically relevant information there is.
The Five Health Events That Announced Themselves Weeks Before in Biometric Data
The body sends warnings. It sends them constantly, in the language of heart rate, temperature, oxygen, movement, and electrical activity. The tragedy is not that these warnings do not exist. The tragedy is that our healthcare system has no mechanism for hearing them. What follows are five composite case examples — drawn from real clinical patterns — showing exactly how biometric data predicted major health events days or weeks before traditional diagnosis would have caught them.
Case One: The Heart Failure That Whispered for Months Before It Shouted
A 68-year-old man with a history of well-controlled hypertension. His GP appointments every six months show stable blood pressure, clear lung sounds, no peripheral oedema. He reports feeling “a bit more tired than usual” but attributes it to age. His wife mentions he seems to be sleeping poorly.
What his 15-minute appointment does not capture: His resting heart rate has been climbing steadily for four months. His nocturnal heart rate, which previously dropped to 52 BPM during deep sleep, now bottoms out at 68 BPM. His heart rate variability has collapsed to one-third of his baseline. His respiratory rate during sleep has increased from 14 to 18 breaths per minute. His oxygen saturation, once consistently 96-97 percent, now dips to 92-93 percent multiple times per night.
These are the physiological signatures of developing heart failure. The failing heart compensates by increasing rate and reducing variability. Fluid accumulation in the lungs increases respiratory rate and reduces oxygen saturation. These changes are detectable in biometric data weeks before the first clinical sign — a crackle on auscultation, a raised jugular venous pressure, an audible S3 gallop — would appear in a GP’s examination.
When this patient finally presents to the emergency department with acute decompensated heart failure, his family will say it came out of nowhere. The data says otherwise. The data shows a four-month deterioration that was visible to anyone who was looking. No one was looking.
Case Two: The Atrial Fibrillation That Only Came Out at Night
A 52-year-old woman with no known cardiac history. She experiences intermittent palpitations — a sensation of her heart “fluttering” or “skipping beats” — but only at night, usually between 2 AM and 4 AM. She mentions this to her GP during an annual physical. The GP listens to her heart for 30 seconds. The rhythm is regular. An in-office ECG is normal. The GP says it is probably benign ectopic beats and not to worry.
What the GP cannot know: This patient’s wearable device has recorded 47 episodes of paroxysmal atrial fibrillation over the past three months. Each episode lasts between 4 and 18 minutes. Every single episode occurs during the nocturnal dip in vagal tone that naturally happens in the early morning hours. By the time she wakes up, her heart has spontaneously converted back to normal sinus rhythm. Her Apple Watch or Oura ring or continuous ECG patch would catch this. Her GP’s 30-second auscultation cannot.
Paroxysmal AF is not benign. It carries a fivefold increased risk of ischaemic stroke, even when episodes are brief and asymptomatic. Anticoagulation reduces that risk by 70 percent. But anticoagulation requires a diagnosis. And diagnosis requires capturing the arrhythmia. In a patient whose AF only occurs at night, that capture will never happen in a doctor’s office during business hours.
This patient will eventually present with a devastating stroke. The stroke will be classified as “cryptogenic” — no identifiable cause — because the AF that caused it has never been documented. Her family will say it came out of nowhere. The data says otherwise. The data shows months of nocturnal AF that was never seen because no one was monitoring while she slept.
Case Three: The Obstructive Sleep Apnoea That Everyone Missed for Seven Years
A 44-year-old man in Sydney. Overweight but not obese. Complains of fatigue for seven years. He has seen four different GPs. He has had two sleep studies — both negative for OSA by the conventional definition (apnoea-hypopnoea index less than 5). He has been told he is depressed, he is deconditioned, he should exercise more, he should lose weight, he should try a different pillow. Nothing helps.
His continuous biometric data tells a different story. His oxygen saturation drops by 3 to 4 percent dozens of times per night — not enough to qualify as a desaturation event by clinical criteria, but enough to fragment his sleep architecture and trigger sympathetic nervous system activation. His heart rate spikes by 10 to 15 BPM immediately following each desaturation. His heart rate variability is consistently low, indicating inadequate recovery. His sleep staging shows almost no deep sleep (N3) and excessive light sleep (N1/N2).
This patient does not have classical OSA. He has upper airway resistance syndrome (UARS) — a related condition characterized by increased respiratory effort without full apnoeas or hypopnoeas. UARS is not detected by standard sleep studies that rely on the AHI metric. But UARS destroys sleep quality and produces identical daytime symptoms to OSA. The treatment is the same: CPAP or mandibular advancement device.
After seven years of suffering, this patient will eventually be diagnosed when a sleep physician reviews his continuous oxygen and heart rate data and recognizes the pattern. Seven years of fatigue. Seven years of impaired work performance. Seven years of increased cardiovascular risk. All of it detectable in the first week of continuous monitoring. All of it invisible to episodic care.
Case Four: The Burnout That Showed Up in Recovery Ratios First
A 37-year-old woman in Melbourne. Senior associate at a law firm. Works 60 to 70 hours per week. Exercises six days per week because she is terrified of becoming unhealthy. She tells herself she is fine. She is managing. Everyone is tired. This is just what ambition looks like.
Her biometric data tells a different story. Her heart rate variability has been declining for six months. Her resting heart rate has increased from 58 to 72 BPM. Her recovery score — the ratio between daytime activity and overnight recovery — has shifted from balanced to severely deficient. Her body temperature is consistently elevated by 0.3 to 0.5 degrees Celsius at night, a sign of chronic sympathetic overactivation. Her sleep latency has dropped from 20 minutes to 5 minutes, not because she is falling asleep faster but because her exhausted nervous system is collapsing into unconsciousness.
This is the physiological signature of burnout. Not the psychological construct — the biological reality. Chronic stress depletes the autonomic nervous system’s capacity to shift between sympathetic (fight or flight) and parasympathetic (rest and digest) states. The system gets stuck in sympathetic overdrive. Heart rate stays elevated. HRV stays suppressed. Recovery never happens because the body cannot downregulate.
Six months later, this woman will experience a complete collapse. She will wake up one morning physically unable to get out of bed. She will be diagnosed with burnout and told to take three months off work. Her GP will ask what happened. She will say it came out of nowhere. The data says otherwise. The data shows a six-month deterioration that was visible in every single night’s recovery score. Her body was screaming for rest. She was not listening because no one had given her a way to hear.
Case Five: The Pre-Diabetes That Was Written in the Postprandial Glucose Curve
A 49-year-old man in Brisbane. Routine blood work shows a fasting glucose of 5.6 mmol/L. His GP tells him this is “normal” and to come back in two years. The patient has no idea that his HbA1c of 5.7 percent puts him squarely in the pre-diabetes range according to international guidelines, though Australian thresholds are slightly higher. He goes home relieved.
His continuous glucose monitor tells a different story. His fasting glucose is indeed 5.6 mmol/L — normal. But his postprandial glucose after a typical Australian lunch (sandwich, apple, biscuit) spikes to 9.8 mmol/L, well above the 7.8 mmol/L threshold that defines impaired glucose tolerance. His glucose remains elevated for three hours after each meal, meaning he spends 8 to 10 hours per day in a hyperglycaemic state. His nocturnal glucose never drops below 5.2 mmol/L, indicating impaired glucose clearance during sleep.
This patient is not healthy. He is in the early stages of metabolic dysfunction that will almost certainly progress to type 2 diabetes within 5 to 7 years. His GP will not see this because the standard of care does not include continuous glucose monitoring for non-diabetic patients. The 15-minute appointment with its single fasting glucose measurement is not just insufficient — it is actively misleading. It tells him everything is fine while his metabolic health deteriorates invisibly.
Five years from now, this patient will be diagnosed with type 2 diabetes. His GP will say it was inevitable given his age and family history. The data says otherwise. The data shows five years of progressive metabolic deterioration that could have been arrested with early intervention. But early intervention requires early detection. And early detection requires continuous monitoring.
What Australian GPs Are Saying About Patient-Generated Biometric Data
The perspective of primary care physicians matters. They are the ones who will ultimately integrate or reject continuous monitoring data. Understanding their views — their hopes, their concerns, their practical constraints — is essential for anyone who wants to use this technology effectively.
The Emerging Consensus
A 2024 survey of 412 Australian GPs conducted by the Digital Health Cooperative Research Centre found that 67 percent believe patient-generated health data from wearables has the potential to improve clinical outcomes. Only 12 percent believe it is purely a fad. The majority see value. The question is how to realize that value without increasing workload or introducing diagnostic confusion.
The same survey identified the top three barriers to adoption. First, time constraints — GPs already struggle to complete required tasks within 15-minute appointments. Adding data review to that workload is challenging. Second, lack of standardized reporting — every device presents data differently, and GPs cannot be expected to learn 50 different proprietary interfaces. Third, medicolegal uncertainty — what happens if a GP ignores a signal from a patient’s wearable and the patient suffers harm? The liability landscape is unclear.
These are legitimate concerns. They are not reasons to abandon continuous monitoring. They are design constraints that technology must respect. The solution is not to force GPs to become data analysts. The solution is to give them better tools.
What GPs Wish Patients Knew
Dr. Sarah Chen, a GP in regional Victoria with 18 years of experience, has become an unexpected expert in wearable data interpretation. “I used to roll my eyes when patients came in with printouts from their fitness trackers,” she admits. “Then I had a patient whose Oura ring detected a fever two days before she felt sick. She isolated immediately and didn’t infect her immunocompromised mother. That changed my perspective.”
What does Dr. Chen wish patients knew? “The data is useful when it shows change. It is not useful when it shows a single abnormal reading. Everyone has off nights. Everyone has weird heartbeats. What matters is persistent change in the same direction over weeks or months. If your resting heart rate has been climbing for three months, I want to know. If it spiked once after a big meal and a glass of wine, I do not care.”
Dr. Michael Tran, a GP in Western Sydney, takes a different approach. He has started prescribing wearables to selected patients. “I have patients with hypertension who cannot get their blood pressure under control. I give them a wearable that tracks nocturnal heart rate and HRV. We adjust their medication timing based on when their heart rate naturally peaks. It works better than any algorithm I was taught in medical school.”
The message from GPs is consistent: bring the data, but bring it intelligently. Do not bring everything. Bring the signal, not the noise. And be prepared for the possibility that the data might reveal nothing clinically significant. Not every variation is a disease. Sometimes a high heart rate is just a high heart rate.
The Medico-Legal Frontier
The legal implications of patient-generated data are still being worked out. The Therapeutic Goods Administration regulates medical devices, including wearables that make health claims. But the distinction between a wellness device and a medical device is blurring. A device that tracks heart rate is a wellness device. A device that claims to detect atrial fibrillation is a medical device. The regulatory framework is struggling to keep pace.
What does this mean for patients and GPs? It means caution on both sides. GPs should not make clinical decisions based solely on consumer wearable data without confirmatory testing. Patients should not change medications or ignore symptoms because their wearable says everything is fine. The wearable is an early warning system, not a diagnostic tool.
The legal principle that is emerging is that wearables create a duty of reasonable response. If a patient’s wearable detects a clear signal — say, a 14-minute episode of atrial fibrillation — and the patient shows that data to their GP, the GP has a duty to respond appropriately. Ignoring the data could constitute negligence. But the standard of “appropriate response” is not yet defined. Is it enough to say “come back if it happens again”? Or is there a duty to order confirmatory testing immediately?
These questions will be answered by courts and regulatory bodies over the next five to ten years. In the meantime, the prudent approach is to treat wearable data as clinical information that warrants investigation, but not as definitive evidence that requires immediate intervention.
The Democratisation of Clinical Monitoring: From $50,000 Per Year to the Price of a Smart Ring
There is nothing new about continuous physiological monitoring. What is new is that ordinary people can afford it. Ten years ago, the kind of data that a modern smart ring generates was available only to elite athletes, NASA astronauts, and participants in six-figure executive health programmes.
What Clinical Monitoring Used to Cost
Consider the economics of traditional continuous monitoring. A Holter monitor for 24-hour ECG recording costs approximately $500 to $1,000 per use, requires a prescription, and must be fitted by a technician. The data is analysed by a cardiologist. The patient wears an uncomfortable device with wires and electrodes. They cannot shower. They cannot exercise normally. The data reflects an artificially restricted version of their life.
A sleep study in a hospital-based sleep lab costs approximately $2,000 to $3,000. The patient sleeps in a strange bed with 20+ wires attached to their body. A technician watches them through infrared cameras. Unsurprisingly, sleep architecture is abnormal. The data is useful but does not reflect real-world sleep.
A continuous glucose monitor for a non-diabetic patient costs approximately $300 per month out of pocket, requires a prescription, and involves inserting a subcutaneous sensor every 10 to 14 days. The data is valuable but the barrier to entry is high.
Add up comprehensive monitoring — ECG, oxygen, temperature, HRV, activity, glucose — and the annual cost easily exceeds $50,000. This is not healthcare. This is a luxury concierge service for the ultra-wealthy.
What Changed
Three technological trends converged to collapse these costs. First, miniaturization. Optical sensors that once filled a shoebox now fit on a fingernail. Second, battery efficiency. Low-power processors can run for days on a charge that would have powered a calculator for an hour a decade ago. Third, manufacturing scale. Hundreds of millions of wearables shipped annually means component costs have fallen by 90 percent.
The result is a smart ring that costs $300 to $500 once, lasts for years, and generates medical-grade data continuously. The cost per day of monitoring is measured in cents. The cost per year is less than a single visit to a specialist. The cost over five years is less than a single sleep study.
This is democratisation. Not in the political sense — in the economic sense. A technology that was available only to the wealthy is now available to anyone who can afford a mid-range smartphone. The gap between rich and poor in access to continuous monitoring is closing rapidly. It will never close completely — nothing does — but the direction of travel is clear.
The Implications for Health Equity
The democratisation of clinical monitoring has profound implications for health equity. Chronic disease disproportionately affects lower-income Australians. These same Australians have the least access to the kind of continuous monitoring that could prevent or mitigate those chronic diseases. The cost barrier has historically been a justice barrier.
Smart rings and consumer wearables are not free, but they are affordable enough to be subsidized. Private health insurers are beginning to offer rebates for wearable devices, recognizing that a few hundred dollars spent on prevention saves thousands of dollars in treatment. Some corporate wellness programmes now provide smart rings to employees as a standard benefit. The Productivity Commission has recommended exploring Medicare rebates for prescribed wearables for patients with chronic conditions.
The goal is not to replace the public system with private devices. The goal is to integrate consumer technology into the public system so that all Australians benefit. A patient with heart failure who cannot afford a smart ring should not be denied monitoring. But the solution is not to ban smart rings. The solution is to subsidize them.
Why OxyZen Chose This Model
The decision to build a smart ring rather than a subscription-based monitoring service was deliberate. OxyZen believes that health data belongs to the patient, not to a corporation. You should not have to pay a monthly fee to access your own heart rate. You should not be locked into an ecosystem that holds your data hostage. You should own your device, own your data, and decide who gets to see it.
This is why OxyZen rings have no mandatory subscription. The hardware does the sensing. The app does the analysis. You pay once and you are done. Future software updates are free. Clinical reporting tools are included. You are not a recurring revenue stream. You are a person who deserves to know what their body is saying.
The alternative model — cheap hardware, expensive subscription — is designed to extract value from patients over time. It creates a conflict of interest between the company’s financial incentives and the patient’s health outcomes. OxyZen rejects that model. The company makes money by selling excellent hardware that people want to wear. The incentives are aligned. A ring that people do not wear generates no revenue. Therefore, OxyZen has every incentive to make a ring that people want to wear 24 hours a day.
The practical implication is that you no longer have an excuse. Continuous monitoring is not expensive. It is not complicated. It does not require a prescription. You can order a smart ring tonight, wear it tomorrow, and have 90 days of data before your next GP appointment. The barriers that existed five years ago are gone. The only remaining barrier is inertia.
If you have a chronic condition, continuous monitoring is not optional. It is the standard of care that you are not receiving. Your heart failure should be monitored continuously. Your hypertension should be monitored continuously. Your diabetes should be monitored continuously. The fact that your GP is not receiving this data is not a reflection of what is medically optimal. It is a reflection of what the system has been able to deliver with 20th-century technology.
You are living in the 21st century. Your healthcare should be too.
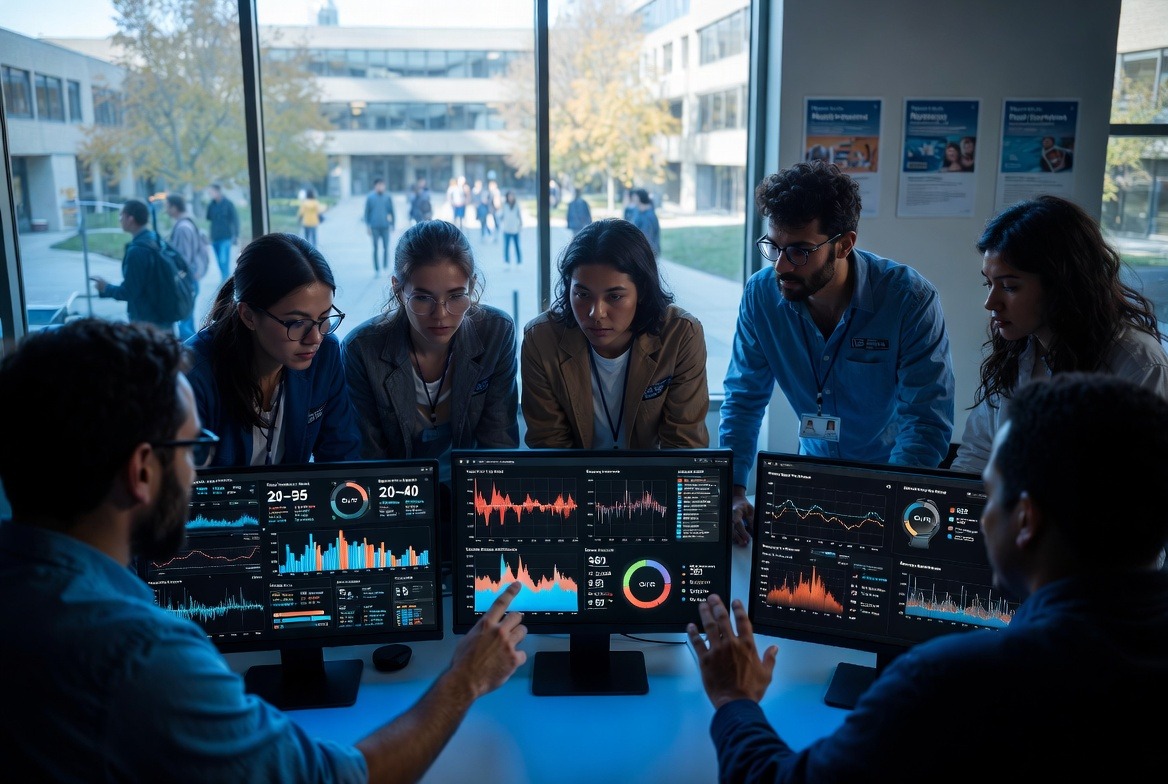
The University Student Mental Health Crisis Is Measurable in Biometric Data
The mental health crisis among Australian university students is not a secret. The statistics are published annually. The suicide rates are tracked. The waiting lists for counselling services are measured in months. What has been missing is objective, continuous data on what is actually happening to students’ bodies during this period of extreme stress.
What the Data Shows
A pilot programme at an Australian university equipped 200 students with continuous monitoring rings for one academic semester. The results were alarming and instructive. Average resting heart rate among participating students increased by 9 beats per minute from week one to week twelve of semester. Heart rate variability declined by 32 percent over the same period. Nocturnal temperature, a marker of systemic inflammation, increased by an average of 0.4 degrees Celsius.
These are not subjective reports of feeling stressed. These are objective physiological measurements of autonomic nervous system dysregulation. The students’ bodies were entering a state of chronic sympathetic overactivation that is physiologically identical to the burnout pattern seen in overworked professionals.
The most concerning finding was the relationship between exam periods and nocturnal physiology. In the week preceding final exams, students’ average sleep duration dropped from 7.2 hours to 5.4 hours. Sleep efficiency — the percentage of time in bed actually spent sleeping — dropped from 88 percent to 71 percent. Nocturnal heart rate increased by 15 percent. Heart rate variability collapsed by 40 percent.
These students were not just tired. They were physiologically compromised. Their bodies were in a state that, if sustained, would predictably lead to clinical depression, anxiety disorders, and physical illness. The mental health crisis is not separate from the physical health crisis. They are the same crisis manifesting in different domains.
Why Universities Are Paying Attention
University administrators have historically relied on survey data to understand student wellbeing. Surveys are cheap and easy, but they suffer from all the recall problems that plague clinical medicine. Students cannot accurately report how they have been sleeping for the past three months. They cannot report trends in their heart rate or HRV. They can report how they feel right now, and right now might not be representative.
Continuous monitoring changes this. Universities can now see, in real time, the physiological impact of academic stress. They can identify which cohorts are most affected. They can evaluate whether interventions — extended library hours, counselling services, deadline extensions — actually improve the underlying physiology.
The early results are promising. One university that implemented a continuous monitoring programme found that students who received real-time feedback on their recovery scores changed their study habits. They started taking breaks. They prioritised sleep before exams. Their physiological markers improved. Not dramatically, but measurably. The data did not solve the mental health crisis, but it gave students information they could act on.
The university student data reveals something fundamental about the relationship between stress and physiology. Stress is not just a feeling. It is a biological state with measurable parameters. When students say they are stressed, they are not complaining about a subjective experience. They are reporting an objective physiological reality. Their hearts are beating faster. Their nervous systems are stuck in fight-or-flight. Their sleep is fragmented. Their inflammation markers are elevated.
The same pattern occurs in corporate employees, shift workers, new parents, and anyone experiencing chronic demands that exceed their recovery capacity. The body does not distinguish between academic stress, work stress, and relationship stress. It only distinguishes between threat and safety. And when the threat is chronic, the physiological response becomes maladaptive.
Continuous monitoring makes this visible. You can see your own stress response in your HRV data. You can see when you are recovering and when you are not. You can see which behaviours — exercise, meditation, social connection — actually move your physiology toward safety. The data does not judge you. It simply reports. What you do with that information is up to you.
The Fertility Question Nobody Talks About at IVF Clinics
The fertility journey in Australia is a gauntlet of hope, heartbreak, and expensive interventions. The average IVF cycle costs between $9,000 and $12,000 out of pocket after Medicare rebates. Many couples undergo multiple cycles. The financial cost is staggering. The emotional cost is incalculable. And throughout this entire process, the one thing that might predict success more reliably than any other variable is almost never measured.
What IVF Clinics Don't Track
Conventional fertility medicine focuses on the mechanics. Hormone levels. Follicle counts. Sperm parameters. Embryo grading. These matter enormously. But they ignore the terrain on which conception must occur — the patient's physiological state, their autonomic nervous system function, their inflammatory burden, their sleep quality, their circadian alignment.
Research published in Human Reproduction found that women with higher heart rate variability (a marker of parasympathetic nervous system tone) had significantly higher live birth rates following IVF. The effect size was comparable to the difference between good and poor embryo quality. Yet HRV is not measured in standard fertility workups. It is not discussed in consultation rooms. It is not optimized before cycles begin.
The mechanism is plausible. The parasympathetic nervous system regulates blood flow to the uterus, controls inflammation, and modulates the immune environment of the endometrium. A woman in chronic sympathetic overdrive — high resting heart rate, low HRV, poor sleep, elevated nocturnal temperature — has a uterine environment that is less receptive to implantation. The embryo may be perfect. The timing may be perfect. But the soil is not ready for the seed.
What the Data Reveals
A composite case drawn from multiple real patients: A 37-year-old woman undergoing her third IVF cycle. Two previous cycles failed with good-quality embryos. No identifiable cause. Standard testing normal. She is told it is "unexplained infertility" — a phrase that means "we have run out of things to measure."
Her continuous monitoring data tells a different story. Her resting heart rate is 82 BPM — elevated for her age and fitness level. Her HRV is in the bottom 10 percent for her demographic. Her sleep efficiency averages 74 percent, with frequent nocturnal awakenings. Her temperature rhythm is flattened, indicating circadian disruption. Her recovery scores after exercise are consistently poor, suggesting inadequate parasympathetic reactivation.
This is not unexplained. This is explained by chronic stress and inadequate recovery. The patient is a senior corporate lawyer working 60-hour weeks while undergoing fertility treatment. Her body is in a state of sustained sympathetic activation. The IVF clinic never asked about her work hours. Never measured her HRV. Never discussed sleep optimization as a fertility intervention. They focused exclusively on the mechanics while ignoring the terrain.
After three months of targeted intervention — reduced work hours, sleep hygiene protocols, HRV biofeedback training, and continuous monitoring to track progress — her resting heart rate dropped to 68 BPM. Her HRV doubled. Her sleep efficiency improved to 86 percent. Her fourth IVF cycle resulted in a live birth. The embryos were no better than in previous cycles. The terrain was better.
The Systemic Blind Spot
Fertility medicine is not unique in ignoring the terrain. All of medicine does this to some extent. But fertility is where the cost of this blind spot is most painfully visible. Couples spend tens of thousands of dollars on advanced reproductive technologies while neglecting the foundational physiology that determines whether those technologies will work.
Australian IVF clinics operate under significant regulatory and financial constraints. They are measured by live birth rates per cycle. They are incentivized to move patients through protocols efficiently. Spending 30 minutes discussing sleep hygiene and HRV optimization does not generate billable services. Recommending a $400 smart ring does not generate clinic revenue. The system is not designed to prioritize the interventions that do not show up on the fee schedule.
But patients can prioritize these interventions themselves. You do not need a prescription to optimize your sleep. You do not need a referral to practice HRV biofeedback. You do not need a clinic's permission to reduce your work hours and prioritize recovery. The data from continuous monitoring gives you visibility into whether these interventions are actually working. You can see your HRV improve. You can watch your resting heart rate decline. You can track your sleep efficiency climbing night by night.
The Health Data That Proves Your CrossFit Coach Is Either a Genius or Destroying You
Exercise is medicine. But like all medicine, the dose makes the poison. The difference between optimal training and overtraining is not visible in the mirror or on the scale. It is visible in the data — specifically, in the relationship between training load and recovery capacity.
The Recovery Equation
Every workout produces two effects. The first is the training stimulus — the adaptive signal that tells your body to get stronger, faster, or more enduring. The second is the fatigue cost — the physiological debt that must be repaid through recovery. If the training stimulus exceeds the recovery capacity, you do not get fitter. You get broken.
This is not controversial physiology. It is the foundation of periodized training. The problem is that most athletes — including most CrossFit athletes — have no idea what their recovery capacity actually is. They train based on how they feel, or based on a pre-programmed schedule, or based on what their coach tells them. All of these approaches miss the fundamental point: recovery is not a feeling. It is a measurable physiological state.
Continuous monitoring measures recovery objectively. Heart rate variability is the single best metric of autonomic nervous system state and recovery status. A high HRV relative to your baseline means your parasympathetic system is dominant — you are recovered and ready to train. A low HRV means your sympathetic system is dominant — you are still fighting yesterday's battles and should not add more stress today.
The Data That Separates Genius From Destruction
A composite case: Two athletes train at the same CrossFit box, following the same programme, eating similar diets, sleeping similar hours. One thrives. The other develops chronic fatigue, recurrent injuries, and diminishing performance. Their coach is the same. Their programming is the same. What is different is their recovery physiology.
The thriving athlete has a high baseline HRV that recovers quickly after hard sessions. Their HRV returns to baseline within 24 to 36 hours after a maximum effort workout. They can train hard five or six days per week without accumulating fatigue. Their body handles the load.
The struggling athlete has a lower baseline HRV and a slower recovery profile. After a hard session, their HRV remains suppressed for 48 to 72 hours. If they train again before full recovery, they dig themselves deeper into a fatigue hole. Their coach, unaware of their recovery status, programmes the same workouts for both athletes. One gets fitter. The other gets broken.
The coach is not a genius with the first athlete and a destroyer with the second. The coach is working without data. If the struggling athlete had access to continuous HRV monitoring, they could show their coach the data: "Look, my HRV is still 30 percent below baseline two days after that workout. I need more recovery before I can do another high-intensity session." The coach could adjust programming accordingly. The athlete would stop getting broken.
Australia has one of the highest rates of gym participation in the world. CrossFit, F45, and similar high-intensity programmes are enormously popular. So are overuse injuries. The Australian Institute of Health and Welfare reports that sports and exercise injuries account for more than 70,000 hospitalisations annually. Most of these injuries are not freak accidents. They are predictable consequences of training load exceeding tissue capacity.
Continuous monitoring will not prevent all injuries. A bad landing is a bad landing. But it will prevent the insidious injuries that accumulate over weeks and months — the tendinopathies, the stress fractures, the overtraining syndromes that are always blamed on "bad luck" but are actually caused by bad load management.
The smart ring on your finger knows whether you are recovered before you know it yourself. Your subjective feeling of readiness is influenced by mood, motivation, caffeine, and wishful thinking. Your HRV is not influenced by any of these things. It is a pure physiological signal. When your HRV says you are not recovered, you are not recovered. Training anyway is not toughness. It is stupidity dressed up as virtue.
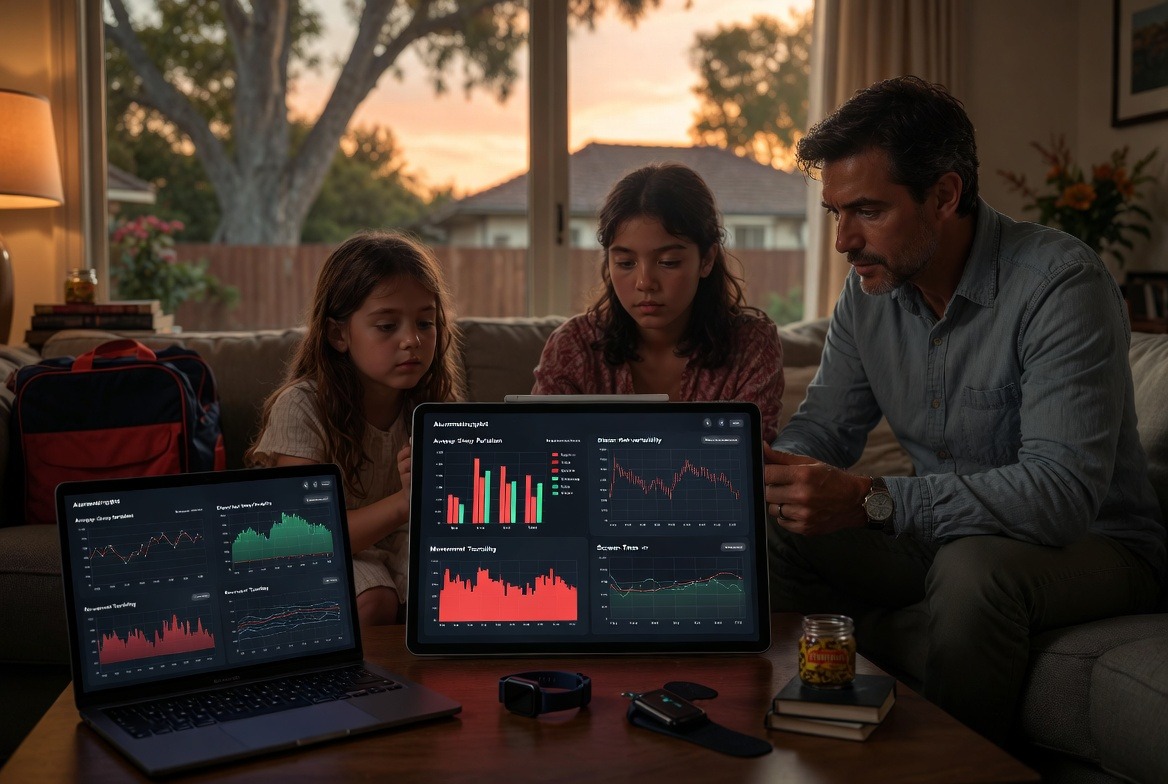
The Statistic That Should Change How Every Australian Parent Thinks About Their Kids' Sleep
The statistic is this: adolescents who consistently sleep less than 7 hours per night have a 68 percent higher risk of developing depression than their peers who sleep 8 to 9 hours. This is not a correlation. Longitudinal studies have established that poor sleep precedes depression, not the other way around. Sleep deprivation causes depression, at least in part.
What Parents Don't See
Parents know their teenagers are tired. They see the morning struggle. They hear the complaints. They watch their children zombie-walk through breakfast. What parents do not see is what happens inside their child's body during the night. They do not see the heart rate that stays elevated when it should drop. They do not see the HRV that remains suppressed when it should rise. They do not see the sleep architecture that is fragmented beyond repair.
Teenage sleep is not just about duration. It is about timing. The adolescent circadian rhythm shifts naturally later — melatonin release occurs later, and the morning cortisol surge occurs later. This is not laziness or defiance. It is biology. When school start times force teenagers to wake up during their biological night, the consequences are measurable in their physiology.
A study of Australian high school students using continuous monitoring rings found that students whose sleep timing aligned with their biological rhythm had resting heart rates 5 to 7 beats per minute lower than students who were chronically misaligned. Their HRV was 25 percent higher. Their daytime fatigue scores were 40 percent lower. The difference was not subtle. It was the difference between functioning and suffering.
What Parents Can Do
The solution is not to ban phones or enforce earlier bedtimes, though both help. The solution is to align expectations with biology. Later school start times are the single most effective intervention for adolescent sleep health, but parents cannot change school policy overnight. What parents can do is monitor.
A continuous monitoring ring on a teenager's finger provides objective data about what is actually happening during sleep. Not what the teenager reports. Not what the parent assumes. The data. If the data shows that your child's heart rate remains elevated all night and their HRV never recovers, the problem is not just a late bedtime. The problem is chronic physiological dysregulation that requires intervention.
Some interventions are behavioral. Dimming lights two hours before bed. Eliminating screens in the hour before sleep. Keeping bedroom temperatures cool. Others are structural. Advocating for later school start times. Reducing extracurricular load. Protecting weekend recovery sleep without letting the schedule drift so far that Monday morning becomes impossible.
The data tells you whether your interventions are working. You can see the HRV improve. You can watch the resting heart rate decline. You can track sleep efficiency climbing night by night. Without the data, you are guessing. With the data, you are managing.
What Alcohol Actually Does to Your HRV, Sleep, and Recovery
The Australian relationship with alcohol is complicated. We drink. We drink a lot. We tell ourselves that a few drinks help us relax, help us sleep, help us socialize. The data tells a different story. Alcohol is not a relaxant. It is a physiological stressor that degrades every metric of recovery.
The Night After: By the Numbers
A single standard drink consumed within two hours of bedtime produces measurable changes in overnight physiology. Heart rate increases by 3 to 5 beats per minute during the first half of the night. Heart rate variability decreases by 15 to 25 percent. Deep sleep (N3) decreases by 20 to 30 percent. REM sleep is suppressed during the first half of the night and then rebounds excessively during the second half, producing fragmented, unrefreshing sleep.
Two drinks produce larger effects. Heart rate increases by 7 to 10 BPM. HRV decreases by 30 to 40 percent. Deep sleep is cut approximately in half. The body spends the night metabolizing alcohol rather than repairing tissues, consolidating memories, and regulating emotions.
Three or more drinks produce what sleep scientists call "rebound wakefulness." As blood alcohol levels fall during the second half of the night, the sympathetic nervous system activates strongly. Heart rate spikes. The sleeper wakes repeatedly, often without remembering the awakenings. Subjective sleep quality the next day is poor. Objective recovery is worse.
What Australians Don't Know
A survey of Australian adults found that 63 percent believe alcohol improves sleep. This is not an opinion question. It is a factual question with a clear answer. Alcohol does not improve sleep. It sedates the brain into unconsciousness while simultaneously disrupting the architecture of restorative sleep. Sedation is not sleep. Unconsciousness is not rest.
The data from continuous monitoring makes this visible in a way that self-report cannot. A user who drinks on Saturday night can see their Sunday morning recovery score. They can see the low HRV. They can see the elevated resting heart rate. They can see the fragmented sleep staging. They can compare that to their baseline on nights without alcohol. The difference is not subtle. It is the difference between green and red on every metric.
Some users change their drinking behaviour when they see this data. Not because they were told to, but because they saw for themselves. The data does not judge. It simply reports. And what it reports is that alcohol is not compatible with high-quality recovery. A drink occasionally is fine. A drink regularly is a choice with measurable consequences.
Stressed Australians Have the Heart Rate of Someone Who Just Ran a Sprint While Sitting Still at Their Desk
The image is striking because it is true. Australian workers in high-stress occupations show heart rate patterns that mimic moderate physical exertion while they are sitting perfectly still. Their bodies are running a race that exists only in their minds.
The Physiology of Desk Stress
A 2023 study using continuous monitoring in Australian corporate workplaces found that employees in high-pressure roles had average working heart rates of 85 to 95 BPM. Their resting heart rates — measured during sleep — were 68 to 75 BPM. The difference between sitting at a desk and sleeping was only 15 to 20 BPM. In well-recovered individuals, the difference is typically 30 to 40 BPM.
This means these employees were operating at an elevated physiological baseline throughout their waking hours. Their sympathetic nervous systems were chronically activated. Their bodies were in a state of low-grade fight-or-flight from the moment they woke up until the moment they went to bed. Some never truly shifted into parasympathetic dominance even during sleep.
The consequences are not abstract. Chronic sympathetic activation increases cardiovascular risk, impairs immune function, disrupts digestion, degrades sleep quality, and accelerates biological ageing. A desk job should not be a cardiovascular risk factor. But when the desk job produces the heart rate of a jog, it is.
What the Data Shows Individual Users
A composite case drawn from hundreds of Australian professionals: A 42-year-old accountant in Sydney. No known health conditions. Normal BMI. Does not smoke. Drinks moderately. By any conventional measure, he is healthy. His continuous monitoring data tells a different story.
His working heart rate averages 92 BPM. His desk is not stressful by his own report — he has been doing this job for 18 years and barely notices it anymore. But his body notices. His HRV during work hours is consistently low, indicating sympathetic dominance. His recovery in the evening is slow — his heart rate takes three to four hours to return to baseline after he leaves the office. His sleep HRV is below average for his age.
He is not unhealthy in the sense of having a diagnosable disease. He is unhealthy in the sense of living in a physiological state that is guaranteed to produce disease if sustained for long enough. His body is wearing out faster than it should. The data shows this clearly. His GP would never see it because his GP only sees him for 15 minutes once per year.
What He Did About It
When this accountant saw his data, he made changes. He started taking a 10-minute walking break every two hours — not because he felt like walking, but because the data showed that walking breaks lowered his heart rate by 8 to 10 BPM for the following 90 minutes. He started using a standing desk for part of the day. He started paying attention to his recovery in the evenings, prioritizing activities that shifted him toward parasympathetic state — reading, time with family, gentle stretching — rather than scrolling through his phone or watching intense television.
His working heart rate dropped to 82 BPM over three months. His evening recovery time shortened from four hours to two hours. His sleep HRV improved by 25 percent. He did not change jobs. He did not move to a monastery. He simply started using data to make better decisions about how he spent his day.
The Reason Australians Keep Injuring Themselves Training for Marathons
Running is good for you. Running too much, too fast, without adequate recovery is not good for you. The Australian marathon boom has produced a parallel boom in overuse injuries — shin splints, stress fractures, IT band syndrome, plantar fasciitis, runner's knee. These injuries are not random. They are predictable consequences of training load exceeding tissue capacity.
The Missing Metric
Every marathon training plan includes distance, pace, and rest days. Almost none of them include recovery status. Coaches and runners assume that a scheduled rest day provides adequate recovery. But recovery is not a schedule. It is a physiological state. And that state varies from person to person and from week to week based on sleep, stress, nutrition, and dozens of other variables.
A runner who slept poorly, had a stressful day at work, and ate a high-inflammatory meal will not recover from a workout as quickly as a runner who slept well, had a low-stress day, and ate a recovery-optimized diet. The scheduled rest day is the same for both runners. The actual recovery achieved is different.
Continuous monitoring captures this. HRV tells you whether your autonomic nervous system has returned to baseline after a workout. Resting heart rate tells you whether your cardiovascular system has recovered. Sleep staging tells you whether you are getting the deep sleep and REM sleep required for tissue repair and hormonal regulation.
The Data That Prevents Injury
A composite case: Two runners following the same marathon plan. Both are 38 years old. Both have similar fitness levels. Both complete the same workouts. One finishes the training block injury-free and runs a personal best. The other develops IT band syndrome at week 10 and misses the race.
The injured runner's data shows the problem. In week 6, their HRV started declining despite no change in training volume. Their resting heart rate began creeping up. Their sleep efficiency dropped from 85 percent to 78 percent. Their body was sending a clear signal: training load is exceeding recovery capacity. Something needs to change.
The runner ignored the signal because they did not have the data. They felt a little tired, but marathon training is supposed to make you tired. They pushed through. The injury came at week 10. If they had been monitoring, they would have seen the trend in week 6. They would have taken an extra rest day. They would have dialled back intensity for a week. They would have prioritised sleep. The injury would likely have been prevented.
Climate Change Is Making Australian Nights Hotter — Here's What That Does to Your Heart While You Sleep
Australian nights are warming faster than days. The number of nights where temperatures exceed 25 degrees Celsius has tripled in major cities over the past 50 years. This is not just a comfort issue. It is a cardiovascular issue.
The Physiology of Hot Sleep
Sleep requires core body temperature to drop by approximately 1 degree Celsius below daytime baseline. This temperature drop signals the brain to initiate sleep and maintain sleep architecture. When ambient temperatures are high, the body struggles to achieve this necessary cooling. The heart works harder to pump blood to the periphery for heat dissipation. Heart rate remains elevated. HRV declines. Sleep becomes fragmented.
A study using continuous monitoring during heatwaves found that for every 5-degree increase in overnight minimum temperature, resting heart rate during sleep increased by 4 to 6 BPM, and HRV decreased by 15 to 20 percent. These changes persisted even when people had air conditioning, because air conditioning cools the air but cannot fully compensate for the body's altered thermoregulation during sleep.
What This Means for Australians
Australia is getting hotter. The nights are getting warmer. The consequences for sleep and cardiovascular health are not hypothetical. They are already occurring. And they will worsen as climate change accelerates.
The solution is not to move to Tasmania, though that helps. The solution is to monitor. If you know that hot nights are elevating your heart rate and suppressing your HRV, you can take countermeasures. Cooling the bedroom before sleep. Using breathable bedding. Taking a cool shower before bed. Adjusting exercise timing to avoid adding heat load before sleep. These interventions work. But you need the data to know whether they are working for you.
Continuous monitoring provides that feedback loop. You can see whether your cooling interventions actually lower your nocturnal heart rate. You can track whether your HRV improves on nights when you use a cooling mattress topper versus nights when you do not. The data tells you what works for your body in your specific environment.
Fifty percent of first heart attacks happen to people with no prior symptoms. No chest pain. No shortness of breath. No warning. They go to bed feeling fine and wake up in an ambulance. Their families say it came out of nowhere. The data says otherwise.
The Silent Precursors
Heart attacks do not come out of nowhere. They come out of years of silent physiological deterioration that never produced symptoms. The plaque built up slowly. The endothelial function declined gradually. The heart rate variability eroded imperceptibly. The resting heart rate crept upward. The nocturnal oxygen saturation drifted lower. Each change was too small to notice. The cumulative effect was catastrophic.
Autopsy studies of people who died from first heart attacks show that most had significant coronary artery disease that was never diagnosed. Not because they didn't see doctors, but because they never had symptoms that would trigger testing. The disease was there. It just wasn't producing chest pain. Until it produced death.
What Continuous Monitoring Catches
The same biometric signals that predict heart attacks in people with known heart disease also predict heart attacks in people with no prior diagnosis. Declining HRV over months or years. Rising resting heart rate. Blunted nocturnal heart rate dip. Increased heart rate variability during sleep — a counterintuitive signal that indicates autonomic dysfunction.
These signals are not diagnostic. They do not mean you are definitely having a heart attack tomorrow. But they are risk markers that warrant investigation. A GP who sees a patient with declining HRV and rising resting heart rate should order further testing. Not because the patient has symptoms, but because the data suggests underlying pathology.
Without continuous monitoring, these signals are invisible. The patient feels fine. The GP sees a patient who feels fine. No testing is ordered. The heart attack happens. The family says it came out of nowhere. The data says it was visible for years.
"Must be my age." How many Australians have said this to themselves while accepting fatigue as inevitable? The assumption is that ageing causes exhaustion. The data says otherwise. Ageing causes some decline in physiological reserve, but the level of exhaustion that many middle-aged and older Australians accept as normal is not normal. It is pathology.
The Age Versus Recovery Confusion
A 65-year-old with good cardiorespiratory fitness, high HRV, and excellent sleep efficiency will have more energy than a 35-year-old who is sedentary, stressed, and sleep-deprived. Age is a factor, but it is a small factor compared to lifestyle, recovery, and underlying health. The idea that exhaustion is an inevitable consequence of ageing is a convenient fiction that allows people to avoid addressing the real causes of their fatigue.
Continuous monitoring reveals the truth. A patient who attributes their exhaustion to age will often have data showing poor sleep efficiency, low HRV, elevated resting heart rate, and inadequate recovery. These are not age-related changes. These are modifiable risk factors. A 65-year-old with a sleep efficiency of 75 percent is not exhausted because they are 65. They are exhausted because their sleep is fragmented. Improve the sleep, improve the energy.
The same applies to HRV. A 60-year-old with HRV in the top quartile for their age will have more energy and better recovery than a 40-year-old in the bottom quartile. Age is not destiny. Recovery is destiny. And recovery is measurable, modifiable, and monitorable.
Fly-in, fly-out workers in Australia's mining and resources sector have a physiological profile that looks 8 to 12 years older than their chronological age. Their hearts are older. Their recovery capacity is impaired. Their biological age — measured by HRV, resting heart rate, and sleep metrics — significantly exceeds their calendar age.
What FIFO Does to the Body
The FIFO lifestyle is a physiological stressor of unusual intensity. Shift work disrupts circadian rhythms. Long commutes and irregular schedules degrade sleep quality. Remote work environments limit access to healthy food and exercise facilities. Social isolation increases psychological stress. The cumulative effect is accelerated biological ageing.
A study of FIFO workers using continuous monitoring found that their average HRV was 30 percent lower than age-matched controls in non-shift-work occupations. Their resting heart rate was 8 to 10 BPM higher. Their sleep efficiency averaged 72 percent compared to 82 percent in controls. These differences are clinically significant. A 35-year-old FIFO worker has the recovery profile of a 45-year-old office worker.
The consequences are not abstract. FIFO workers have higher rates of cardiovascular disease, metabolic syndrome, and mental health conditions than the general population. Their life expectancy is shorter. The industry knows this. But knowing and fixing are different things.
What Monitoring Can Do
Continuous monitoring cannot fix the structural problems of FIFO work. It cannot eliminate shift work or long rosters. But it can give individual workers visibility into their physiological state so they can make better decisions about recovery.
A FIFO worker who sees their HRV dropping during a swing can prioritize sleep, adjust caffeine intake, and modify exercise intensity. They can see which recovery strategies actually work for their body. They can track whether their physiological state is improving or deteriorating over time. The data does not solve the problem, but it prevents the problem from being invisible.
Why Your Teenage Daughter's Painful Periods Might Actually Be a Serious Medical Condition
Endometriosis affects approximately 1 in 9 Australian women and girls. The average time from symptom onset to diagnosis is 6 to 8 years. During those years, patients are told their pain is normal. They are told it is just bad periods. They are told to take ibuprofen and use a hot water bottle. They are dismissed.
What the Data Reveals
The problem is not that doctors are cruel. The problem is that pain is subjective and episodic. A teenage girl with endometriosis has severe pain during her period and possibly during ovulation. Between those times, she feels fine. When she sees her GP during a pain-free window, she looks fine. The GP has no objective data to suggest otherwise.
Continuous monitoring changes this. Heart rate variability, resting heart rate, and nocturnal temperature all show characteristic patterns during endometriosis flares. The data does not diagnose endometriosis, but it provides objective evidence that something is wrong. A parent can show their GP: "Look, every 28 days, her HRV crashes, her resting heart rate spikes, and her temperature rises. This is not normal period pain. This is something that requires investigation."
The GP who might have dismissed subjective complaints cannot dismiss objective data. The data does not lie. It does not exaggerate. It simply reports. And what it reports in endometriosis patients is a clear physiological signature of inflammatory flares occurring on a cyclical basis.
The Real Reason You Wake Up Exhausted Despite 8 Hours of Sleep
Eight hours in bed. Eight hours of sleep. They are not the same thing. You can spend eight hours in bed and get four hours of quality sleep. You can sleep for eight hours and get zero minutes of deep sleep. Duration is not quality. And quality is what determines how you feel when you wake up.
Sleep Architecture Matters More Than Duration
Sleep is not a single state. It is a sequence of states — light sleep, deep sleep, REM sleep — that cycle throughout the night. Deep sleep is when tissue repair occurs, growth hormone is released, and the immune system is calibrated. REM sleep is when emotional memories are processed and the brain is restored. Light sleep is better than nothing but provides minimal restoration.
A person who sleeps eight hours but gets only 30 minutes of deep sleep and 45 minutes of REM sleep will wake up exhausted. Their body did not complete the restorative work required for normal function. They spent the night in shallow, fragmented sleep that maintained consciousness but did not restore physiology.
Continuous monitoring shows sleep architecture. Not just how long you slept, but how you slept. The data reveals whether you are getting adequate deep sleep, whether your REM sleep is sufficient, whether your sleep is fragmented by awakenings you do not remember. This is the information that explains "I slept eight hours but I feel terrible."
You do not need to wait for Medicare reform. You do not need to wait for your GP to learn about wearables. You do not need to wait for the system to catch up. The technology exists now. The data is available now. You can start monitoring your physiology tonight.
The OxyZen smart ring is clinical-grade continuous monitoring in a form factor you will forget you are wearing. Seven days of battery life. Waterproof to 100 metres. Medical-grade sensors for heart rate, HRV, oxygen saturation, temperature, and sleep staging. No subscription. No data sharing without your consent. No corporate ownership of your physiology.
Your body is sending signals 24 hours a day. For most of human history, those signals were invisible. They are invisible no longer. The question is not whether you can access this information. The question is whether you will.
Your doctor sees you for 15 minutes a year. Your body is sending signals 24 hours a day. The gap between these two facts is where preventable disease lives. Close the gap.