Health Tracking Basics: Understanding Your Body's Daily Patterns
Teaches you to understand your body's natural daily rhythms.
Health Tracking Basics: Understanding Your Body's Daily Patterns
In the quiet pulse of your wrist and the steady rhythm of your breath lies a universe of data—a living, breathing story of you. For centuries, understanding our body's inner workings was an exercise in guesswork and intuition. We listened for whispers of fatigue, heeded the shouts of pain, and tried to interpret the subtle language of our physiology. Today, that language is being translated. We are no longer passive inhabitants of our bodies; we have become active observers, equipped with the tools to read the continuous narrative of our health. This is the promise of modern health tracking: moving from reactive care to proactive understanding, from feeling "off" to knowing precisely why.
Welcome to the foundational journey of decoding your body's daily patterns. This isn't about obsessive data collection or chasing arbitrary scores. It’s about cultivating a deep, empathetic relationship with your most fundamental asset—your well-being. By learning to observe the rhythms of your heart, the patterns of your sleep, the tides of your energy, and the whispers of your stress, you gain an unprecedented map of your personal health landscape. This knowledge is power: the power to optimize, to prevent, to perform, and to truly thrive.
This guide will serve as your comprehensive manual. We will begin by exploring why understanding your baseline is the single most important step in any health journey. We’ll demystify the core metrics—heart rate, heart rate variability, sleep architecture, activity levels, and stress signals—explaining not just what they are, but what they mean for you. We’ll then delve into the practicalities of collecting this data accurately and consistently, transforming raw numbers into actionable insights. Whether you’re a wellness novice curious about your nightly rest or a fitness enthusiast fine-tuning recovery, mastering these basics is the first step toward a more intentional and informed life. So, let’s begin by turning inward, learning to listen, and discovering the profound story your body is telling you every single day.
What Are Body Patterns and Why Should You Care?
Imagine trying to navigate a new city without a map, landmarks, or street signs. You might eventually stumble upon your destination, but the journey would be fraught with wrong turns, confusion, and wasted energy. Now, consider your body as that city—a complex, dynamic system of interconnected neighborhoods (organs), traffic flow (blood circulation), energy grids (metabolism), and communication networks (nervous system). Without understanding its inherent patterns and rhythms, navigating your health becomes a similar exercise in guesswork.
Your body’s daily patterns are the consistent, recurring rhythms and trends in your physiological data. They are your personal health signature. This includes the predictable dip in your heart rate during deep sleep, the gentle rise of your core temperature in the morning, the ebb and flow of your energy levels throughout the day, and the subtle shifts in your heart rate variability that signal how well you’re adapting to stress. These aren’t random fluctuations; they are the direct output of your autonomic nervous system—the unconscious control center regulating everything from digestion to fight-or-flight responses.
Why is understanding this signature so critical? Because there is no universal "normal." Medical textbooks provide population averages, but your optimal heart rate, sleep duration, or activity level is uniquely yours. Your baseline is your personal "normal," and it is only against this baseline that meaningful changes can be detected.
Consider this real-world analogy: Two people might both have a resting heart rate (RHR) of 65 beats per minute. For Person A, whose typical RHR is 58, a reading of 65 could indicate dehydration, poor sleep, or the onset of an illness. For Person B, whose baseline is 68, a reading of 65 might signal improved fitness or excellent recovery. The absolute number is identical, but the deviation from personal baseline tells two completely different stories. This is the cornerstone of personalized health: context is everything.
By establishing and monitoring your patterns, you move from a state of health blindness to health awareness. You can:
Identify Early Warning Signs: A sustained elevation in your resting heart rate or a drop in your heart rate variability is often your body’s first, subtlest alert that it’s fighting something—be it stress, infection, or overtraining—long before you feel symptoms.
Measure True Impact: Did that late-night coffee really affect your sleep? Did the new meditation practice actually calm your nervous system? With pattern tracking, you move from anecdote to evidence.
Personalize Your Routines: Discover your personal prime time for cognitive work, your ideal window for exercise, and the bedtime routine that genuinely leads to restorative sleep.
Enhance Communication with Healthcare Providers: Instead of describing how you’ve felt "vaguely tired for weeks," you can present tangible data on sleep disturbances, elevated nighttime heart rate, or activity trends.
Ultimately, caring about your body’s patterns is an act of self-knowledge. It’s the first step in a journey from simply living in your body to partnering with it. As we explore the evolution of health tracking technology from manual logs to smart rings, you’ll see how accessible this deep self-knowledge has become.
The Core Metrics: Your Body's Vital Signs Explained
To read your body’s story, you must first learn its alphabet. The core biometrics tracked by modern wearables form this fundamental language. Each metric is a vital sign of your overall well-being, offering a distinct lens into your physiological state. Let’s decode these essential signals.
Heart Rate (HR): Your Body's Metronome
Your heart rate, measured in beats per minute (BPM), is the most fundamental rhythm of life. Far more than just a number during exercise, it’s a dynamic indicator of your body’s immediate demands.
Resting Heart Rate (RHR): Measured when you are fully at rest (often during sleep or upon waking), this is a powerful marker of cardiovascular fitness and overall health. A lower RHR typically indicates a stronger, more efficient heart. Tracking its trend over time is key; a creeping elevation can signal fatigue, dehydration, stress, or illness.
Daily Heart Rate: Observing your heart rate throughout the day reveals how your body responds to stimuli—the spike during a stressful meeting, the steady climb during a walk, the gradual decline as you relax with a book. These responses paint a picture of your cardiovascular resilience.
Heart Rate Variability (HRV): The Secret Language of Recovery
If heart rate is the beat of the drum, HRV is the subtle, complex rhythm between the beats. It measures the millisecond variations in the intervals between consecutive heartbeats. Counterintuitively, a higher HRV is generally better.
Why? Your heart doesn’t tick like a metronome; it’s constantly modulated by your autonomic nervous system. The sympathetic ("fight-or-flight") branch accelerates your heart, creating more regularity. The parasympathetic ("rest-and-digest") branch slows it down and introduces healthy variability. A high HRV indicates a strong, adaptive nervous system that can switch fluidly between stress and recovery modes. A low or dropping HRV suggests your body is under strain—from physical overwork, emotional stress, or poor recovery—and is stuck in a more stressed, less resilient state. It is one of the most sensitive metrics for tracking your readiness for the day ahead.
Sleep Architecture: Beyond Just Hours in Bed
Sleep is not a monolithic state. It’s a meticulously choreographed cycle of distinct stages, each with a vital purpose. Understanding sleep architecture means moving beyond duration and assessing quality.
Light Sleep: The gateway to sleep, crucial for memory processing and physical recovery.
Deep Sleep (Slow-Wave Sleep): The physical restoration phase. This is when tissue growth and repair occur, immune function is bolstered, and energy is restored. It’s often the most "refreshing" stage.
REM Sleep: The mental restoration phase. This is where dreaming occurs, memories are consolidated, and learning is integrated. It’s essential for cognitive and emotional health.
Sleep Latency & Awakenings: How long it takes you to fall asleep and how often you wake up during the night are critical indicators of sleep continuity and quality.
A healthy sleep pattern shows sufficient time in each stage, with minimal disruptions. Imbalances—like chronically low deep sleep or fragmented REM—can explain daytime fatigue, brain fog, and poor recovery, even if you’re logging "enough" hours. For a deeper dive into how technology interprets these stages, explore our article on the science behind modern health tracking technology.
Activity & Movement: The Non-Exercise Thermogenesis
While dedicated workouts are vital, they often constitute a small fraction of your day. Non-Exercise Activity Thermogenesis (NEAT)—the energy you burn through all other movement—is a massive component of your metabolic health.
Steps: A simple but effective proxy for general daily movement.
Active Minutes & Calories: More nuanced measures of exertion.
Prolonged Sedentary Alerts: Perhaps most importantly, tracking how long you sit uninterrupted. Research consistently links prolonged sedentary periods with health risks, independent of exercise. The goal is not just to add activity, but to break up inactivity.
Stress & Recovery Signals: Your Body's Barometer
Modern devices often synthesize data from multiple metrics (like HR, HRV, and sleep) to provide inferred measures of stress and recovery.
Body Stress/Strain Scores: These algorithms can detect physiological stress even when you feel mentally calm—such as the strain from an intense workout, an impending cold, or digestive issues.
Recovery/Readiness Scores: A holistic index, often pulled from overnight data, that suggests how prepared your body is to take on physical or mental stress for the coming day. A low score is your body’s recommendation for a lighter day.
By understanding what each of these core metrics represents, you transform a dashboard of numbers into a coherent narrative. This is how health tracking technology enables personalized wellness, moving you from generic advice to insights that are uniquely relevant to your body’s story.
Establishing Your Personal Baseline: The First 30 Days
You’ve learned the language; now it’s time to listen. The single most important action you can take in your health tracking journey is to establish your personal baseline. This is not a one-day snapshot, but a multi-week discovery phase to understand your body’s unique rhythms under your normal, everyday conditions. Think of it as a scientific study where you are both the subject and the researcher.
Why a Full Month?
Our bodies operate on numerous intertwined cycles—daily (circadian), weekly (reflecting work/rest patterns), and even monthly (for many individuals). Capturing data over 30 days allows you to smooth out daily anomalies (a bad night’s sleep, an exceptional workout, a celebratory meal) and reveal your true underlying trends. It provides context for what "normal variation" looks like for you.
The Ground Rules for Baseline Collection
Consistency is King: Wear your tracking device consistently, especially at night. The richest data comes from uninterrupted sleep tracking.
Live Your Normal Life: This is not the time to launch a drastic new diet, fitness regimen, or sleep schedule. The goal is to capture an honest picture of your current reality. If you normally have two cups of coffee, have two cups. If you typically exercise three times a week, keep doing that.
Note the Context: Use a journal or the note function in your app to log simple observations. "Stressed work deadline," "ate late dinner," "drank alcohol," "felt great upon waking." This qualitative data is the key to interpreting your quantitative numbers later.
What to Look For: Calculating Your Averages
After 30 days, you can move from data points to data patterns. Calculate the averages for your key metrics:
Average Resting Heart Rate: What is your typical sleeping or waking RHR?
Average HRV: What is your normal range? (Note: HRV is highly individual; compare only to yourself).
Average Sleep Duration & Breakdown: How much total sleep do you typically get, and what’s your usual percentage of deep and REM sleep?
Average Daily Steps & Activity: What’s your non-exercise movement level?
These averages form your personal health fingerprint. They are the "control" in your ongoing experiment of one. For instance, you’ll learn that a deviation of more than 5-7 BPM from your personal RHR average is significant, or that your HRV tends to dip predictably at a certain point in your cycle or workweek.
Beyond the Numbers: Subjective Feelings
Your baseline isn’t just data. It’s the intersection of that data with your lived experience. On days when your scores were excellent, how did you feel? Energized? Focused? Resilient? Conversely, on low-score days, what were the subjective symptoms—lethargy, irritability, lack of motivation? This correlation between objective metrics and subjective feeling is where true insight ignites.
Establishing this baseline empowers you to move forward with confidence. Every new day’s data can now be viewed through the lens of your personal normal. This process demystifies the numbers and lays the groundwork for meaningful experimentation, which is how wellness rings help build healthy habits from a foundation of self-knowledge. When you understand your starting point, every step toward improvement becomes intentional and measurable.
The Art of Accurate Data Collection
A map is only as good as the surveyor’s tools and techniques. In health tracking, the insights you glean are fundamentally dependent on the quality and consistency of the data you collect. Garbage in, garbage out. Mastering the art of accurate data collection ensures that the story your metrics tell is clear, reliable, and truly reflective of your physiology.
Device Placement & Wear: The Foundation of Signal Quality
This is the most critical, yet often overlooked, factor. A device must maintain consistent skin contact to capture clean physiological signals.
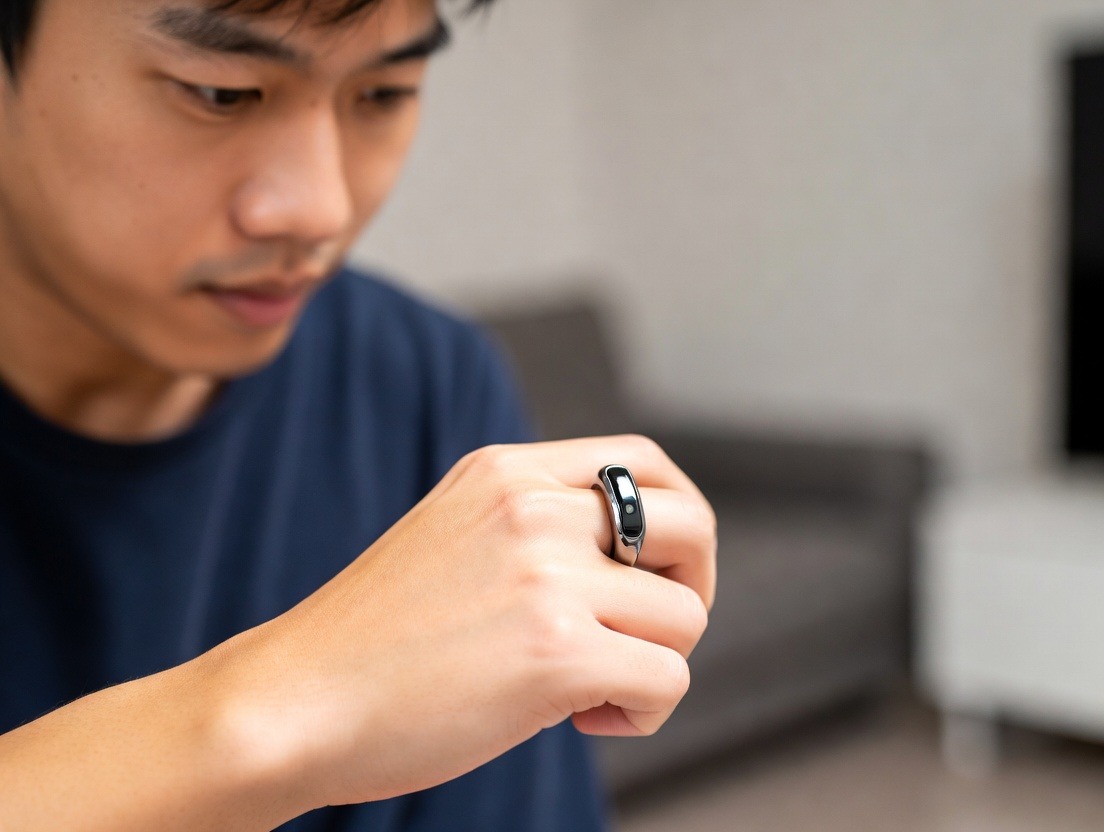
The Smart Ring Advantage: For 24/7 tracking, a well-fitted smart ring like those from Oxyzen offers a unique benefit. The finger hosts a rich network of blood vessels, and a ring naturally maintains consistent contact without the need for tight straps. This can lead to more reliable overnight data, as it’s less prone to movement-induced gaps than a wrist device that may shift during sleep.
The Goldilocks Fit: Whether using a ring or a wrist wearable, fit is paramount. It should be snug enough not to move freely, but not so tight as to cause discomfort or impede circulation. For rings, your size may fluctuate slightly with temperature and time of day, so professional sizing is recommended.
Consistency: Wear your device in the same position. For rings, this typically means on the index, middle, or ring finger, as specified by the manufacturer.
Environmental & Behavioral Factors: Controlling the Variables
Your body’s signals are influenced by countless factors. Being aware of these helps you interpret data accurately and avoid false readings.
Motion Artifact: Intense, jarring movement can confuse optical heart rate sensors. Data during high-impact activities may be less reliable than data at rest.
Extreme Temperatures: Very cold environments can cause vasoconstriction (narrowing of blood vessels), potentially making it harder for sensors to get a clear reading.
Tattoos, Scars, and Skin Tone: Dense tattoos or significant scarring can sometimes interfere with the light-based (PPG) sensors used by many wearables. Modern devices have improved in this area, but it’s a factor to be aware of.
Caffeine, Alcohol, and Large Meals: These significantly affect your heart rate, HRV, and sleep. The data reflecting these impacts is accurate—it’s showing a real physiological response. The key is to recognize these influences in your analysis.
The Role of Calibration and Cross-Validation
No consumer device is a medical-grade diagnostic tool, and that’s okay. Their power lies in tracking trends.
Trust the Trend, Not the Absolute Number: Focus on how your metrics change relative to your own baseline, rather than fixating on whether the absolute HRV number is "correct."
Cross-Validate with Feel: Does the data match your lived experience? If your device says you had a fantastic sleep score but you feel exhausted, investigate further (e.g., were you stressed? dehydrated?). Your subjective feeling is a crucial data point.
Periodic Checks: If you have access to manual methods (like taking your pulse), occasionally cross-check to ensure your device’s readings are in the right ballpark for resting measurements.
By respecting these principles of accurate data collection, you build a robust and trustworthy dataset. This reliability is at the heart of the ongoing accuracy revolution in health tracking technology, turning wearables from novelties into legitimate tools for self-awareness. It ensures that when you observe a pattern or a change, you can have confidence that it’s a true signal from your body, not noise from poor data capture.
From Numbers to Knowledge: Interpreting Daily Trends
Data points in isolation are like single words scattered on a page. The magic—and the meaning—emerges when you connect them into sentences, paragraphs, and chapters. Interpreting daily trends is the process of transforming isolated biometric readings into coherent, actionable knowledge about your body’s state. This is where you become the editor of your own health story.
The Power of the 7-Day Rolling Average
Our lives have weekly rhythms. The weekend often differs from the workweek. To see beyond the daily noise, learn to rely on your 7-day rolling average for core metrics like RHR and HRV. This smooths out single-day outliers (caused by a hard workout, a late night, or a celebratory drink) and reveals the underlying direction of your physiological trend.
Example: Your HRV on Wednesday might be low. Alarming? Not necessarily. Look at the 7-day average. If it’s stable or rising, Wednesday is just a minor dip. If the 7-day average itself is on a steady decline, it suggests a cumulative strain that needs addressing.
Spotting Correlations: The "If This, Then That" of Your Body
This is the most engaging part of self-discovery. Look for cause-and-effect relationships in your data.
Sleep & Next-Day HRV: Do you see a direct correlation between your deep sleep percentage and your morning HRV? Many people do.
Evening Habits & Sleep Score: What happens to your sleep latency (time to fall asleep) and restfulness when you have screens after 10 PM versus reading a book?
Workout Intensity & Next-Day RHR: Does a particularly strenuous strength or HIIT session lead to an elevated resting heart rate the following morning, indicating your body is in repair mode?
Stressful Days & Body Battery/Stress Scores: Does a mentally taxing workday translate into a high physiological stress score, even if you were physically sedentary?
Document these correlations. They become your personal guidebook. You’ll move from wondering, "Why am I so tired?" to knowing, "My data shows I’ve had low deep sleep for three nights, my HRV is down 15%, and my RHR is up—I need to prioritize recovery."
Understanding Lagging vs. Leading Indicators
Not all metrics move on the same timeline.
Lagging Indicators: These reflect outcomes. Resting Heart Rate and Sleep Scores are often lagging. They tell you how well you recovered from yesterday. They are superb for assessing the effect of your choices.
Leading Indicators: These can predict how you might perform today. Heart Rate Variability (HRV) is the premier leading indicator of readiness and resilience. A high, stable, or rising HRV suggests your body is well-recovered and primed to handle stress. A low or dropping HRV suggests you may be less resilient.
By interpreting both, you gain a complete picture: "My sleep was good (lagging indicator = good recovery), but my HRV is still low (leading indicator = low resilience). Maybe I need another easy day despite feeling okay."
The Story of a Single Day: A Narrative Walkthrough
Let’s weave it together with a hypothetical example:
Morning: You wake up and check your app. Your sleep score is 85 (excellent), with ample deep sleep. Your resting heart rate is at your personal baseline of 58. However, your HRV is 10% below your weekly average.
Interpretation: Your body achieved physical restoration (good sleep, low RHR) but your nervous system is still showing signs of residual stress (lower HRV). Maybe yesterday’s mental load was high.
Daytime: You wear your device. Your stress score spikes during your morning commute and a key meeting—this is normal reactivity. It recovers during lunch and a walk.
Evening: You do a moderate workout. Your heart rate reaches and maintains your target zone. Post-workout, your recovery metric suggests a 24-hour window for optimal repair.
Night: You follow your wind-down routine. Your device notes a quick sleep latency and records a normal sleep architecture.
The narrative? "A day of good recovery from prior nights, with some nervous system tension lingering. Managed daytime stress well and completed a beneficial workout. Set myself up for another good night of recovery." This is the shift—from numbers to a nuanced story of your daily capacity and resilience. For more on turning these daily stories into long-term strategy, our blog offers resources on how a wellness ring can support different health goals.
The Circadian Rhythm: Your Body's Master Clock
Underlying every daily pattern we’ve discussed is a profound, ancient biological force: your circadian rhythm. This is not merely a preference for being a "morning person" or a "night owl." It is a 24-hour internal master clock, genetically hardwired into nearly every cell and system in your body. It orchestrates the precise timing of hormone release, body temperature, metabolism, alertness, and sleep-wake cycles. Understanding and aligning with your circadian rhythm is the ultimate lever for optimizing health, performance, and well-being.
What is the Circadian Rhythm?
Governed by a tiny region in your brain called the suprachiasmatic nucleus (SCN), your circadian rhythm is a self-sustaining loop that runs slightly longer than 24 hours. It is reset every day by the most powerful external cue: light, especially the blue-wavelength light of the morning sun. When light hits your eyes, it signals the SCN to suppress melatonin (the sleep hormone) and ramp up cortisol (the wakefulness hormone), starting your biological day. As light fades, the process reverses, priming you for sleep.
How Health Tracking Reveals Your Rhythm
Your wearable device is a brilliant proxy for observing your circadian rhythm in action:
Core Body Temperature: It follows a predictable wave, hitting its lowest point about two hours before you wake and peaking in the late afternoon. While wearables don’t measure core temperature directly, they infer trends from skin temperature, which loosely follows this rhythm. A disrupted temperature rhythm often predicts poor sleep.
Heart Rate & HRV: Both exhibit clear circadian patterns. Your resting heart rate is lowest during sleep, begins to rise before you wake (anticipating activity), peaks in the late afternoon, and declines into the evening. HRV often follows an inverse pattern, typically higher at night during parasympathetic dominance.
Activity & Rest Patterns: Your natural energy peaks and troughs throughout the day are direct outputs of your circadian clock. Tracking when you are most active or when you naturally feel like resting can help you identify your personal chronotype.
The Consequences of Disruption: Jet Lag Without the Travel
When your lifestyle conflicts with your circadian rhythm—a state called "social jet lag"—you pay a health tax. Chronic misalignment is linked to:
Poor sleep quality and insomnia
Impaired glucose metabolism and increased risk of weight gain
Weakened immune function
Mood disturbances and cognitive decline
Increased long-term risk for metabolic and cardiovascular diseases
This happens through shift work, inconsistent sleep schedules, and most commonly, through excessive exposure to artificial light (especially from screens) late into the evening, which tricks your SCN into thinking it’s still daytime.
Harnessing Your Rhythm for Better Health
Health tracking empowers you to find and reinforce your natural rhythm.
Find Your Chronotype: Use your energy and focus data. Do your best workouts or most focused work happen before noon (lion), in the afternoon (bear), or in the evening (wolf)? Honor this tendency where possible.
Anchor with Morning Light: Your single most effective habit. Get bright, outdoor light within 30-60 minutes of waking. This sets your clock with military precision, improving daytime energy and evening sleep pressure.
Respect the Evening Wind-Down: Use your device’s stress or readiness scores to see the impact of evening habits. Dim lights, minimize screens 1-2 hours before bed, and allow your body temperature to drop naturally in a cool room.
Observe Meal Timing: Your metabolism is most efficient earlier in your circadian day. Notice if late-night eating correlates with elevated nighttime heart rate or poorer sleep scores.
By tracking your body’s signals, you can move from fighting your biology to flowing with it. Aligning with your circadian rhythm reduces internal friction, making healthy choices feel more natural and effective. This deep alignment is a core principle of how health tracking technology has changed preventive medicine, shifting focus to the fundamental rhythms that govern health.
The Impact of Lifestyle Choices: Seeing the Direct Feedback
One of the most transformative aspects of consistent health tracking is the immediate, tangible feedback loop it creates between your choices and your body’s response. It turns abstract health advice into a personal, visible cause-and-effect relationship. You are no longer following rules blindly; you are conducting experiments of one, with clear, data-driven results. Let’s explore how common lifestyle choices show up in your biometric data.
Nutrition and Hydration
What and when you eat and drink sends ripples through your entire system.
Late-Night Meals: A large or heavy meal close to bedtime often shows up as an elevated resting heart rate during the first half of the night, as your body prioritizes digestion over full rest. It can also suppress deep sleep.
Alcohol: Perhaps the most dramatic disruptor. While it may help with sleep onset, it reliably:
Suppresses REM sleep (the mental recovery stage), often causing a rebound of intense REM later in the night.
Increases nighttime awakenings and restlessness.
Raises heart rate and lowers HRV throughout the night, impairing recovery. You may sleep for 8 hours but wake with a poor recovery score.
Dehydration: Even mild dehydration can cause a noticeable spike in your resting heart rate and a drop in HRV. Tracking can remind you to drink water before you feel thirsty.
Caffeine: Its long half-life means afternoon coffee can increase sleep latency (time to fall asleep) and reduce sleep quality, visible in your sleep stage breakdown.
Exercise and Movement
Different types of activity leave distinct signatures.
Intense Training (Strength, HIIT): These create beneficial muscle damage and systemic stress. The signal? An elevated resting heart rate and potentially lowered HRV the next morning. This is a normal sign of repair. The trend should reverse within 24-48 hours with good recovery. If it persists, it may signal overreaching.
Moderate Steady-State (Walking, Jogging, Cycling): Often has a more neutral or even positive effect on next-day readiness metrics, especially if balanced with recovery.
Rest & Recovery Days: Actively watch your metrics improve on these days. Seeing your HRV climb and your RHR drop after a day of rest is powerful positive reinforcement for the necessity of downtime.
Non-Exercise Movement: Breaking up prolonged sitting shows up in better stress score recovery during the day and can contribute to more stable energy levels.
Stress and Mental Load
Your mind and body are inseparable. Psychological stress triggers a full physiological cascade.
Anxious Rumination: Even while physically still, a racing mind can elevate your heart rate and stress score, and suppress your HRV.
Work Pressure: A demanding work period often manifests as a creeping rise in your weekly average RHR and a downward trend in your HRV.
Relaxation Practices: The effects of meditation, deep breathing, or a nature walk are quantifiable. Look for a rapid decrease in your live heart rate and stress score during the practice, and a positive influence on your overnight recovery metrics.
Sleep Hygiene
Your pre-bed routine writes the script for your night.
Screen Time Before Bed: The blue light delays melatonin. The engaging content activates the mind. The result? Increased sleep latency and often, reduced REM sleep.
Consistent Bedtime: A regular schedule strengthens your circadian rhythm, leading to faster sleep onset and more robust sleep architecture.
Cool, Dark Environment: This supports the natural drop in core body temperature necessary for sleep, reflected in better sleep efficiency scores.
This direct feedback is empowering. It removes the mystery and builds self-efficacy. You learn that a rest day isn’t "lazy," it’s "strategic recovery." You see that an extra glass of water is a direct intervention for your nervous system. This is the practical essence of enabling preventive health monitoring—using daily feedback to make choices that prevent strain from accumulating into illness or burnout.
Common Tracking Pitfalls and How to Avoid Them
The path to self-knowledge through data is immensely rewarding, but it’s not without its potential stumbling blocks. Without awareness, the very tools designed to empower can become sources of anxiety, obsession, or misinterpretation. Recognizing these common pitfalls will help you maintain a healthy, productive relationship with your health data.
Pitfall 1: Obsessing Over Single-Day Scores
The Trap: Waking up, seeing a "Poor" readiness score or a low HRV, and letting it dictate your mood and self-judgment for the entire day. The Reality: Your body is not a machine. It has good days and bad days. A single data point is a snapshot, not the whole film. Daily fluctuations are normal and expected. The Solution: Adopt a trend-based mindset. Look at the 7-day rolling average. Is one bad day part of a concerning downward trend, or is it just a blip in an otherwise stable or upward pattern? Give yourself permission to have "low score" days—they are vital data points that make the "high score" days meaningful.
Pitfall 2: Chasing Arbitrary "Ideal" Numbers
The Trap: Comparing your absolute HRV of 40 to a friend’s 80 and feeling deficient, or striving for a sleep score of 90 every night. The Reality: Biometrics are profoundly individual. There is no universal "good" HRV number; there is only your higher and your lower. A sleep score is an algorithm’s estimate; your feeling of refreshment is the ultimate metric. The Solution: Use your own baseline as your only meaningful benchmark. Your goal is not to hit a magazine’s ideal number, but to understand what "optimal for you" looks like and what moves you toward it. Focus on personalized insights, not peer comparison.
Pitfall 3: Ignoring Subjective Feelings
The Trap: Slaving to the data even when it contradicts your lived experience. "My score says I’m recovered, but I feel exhausted. The device must be wrong, or I’m just weak." The Reality: Wearables measure physiological states. They cannot measure joy, purpose, emotional pain, or mental fatigue. Your subjective feelings are the most important data point of all. The Solution: Practice data-informed, not data-dominated, decision-making. Use the scores as a guide, but let your body have the final vote. If you feel terrible on a "Green" day, take it easy. The discrepancy itself is a valuable insight—perhaps you’re dealing with a non-physical stressor. This balanced approach is a common theme in real customer reviews and user experiences.
Pitfall 4: Analysis Paralysis
The Trap: Becoming so overwhelmed by charts, graphs, and numbers that you spend more time analyzing than living, leading to inaction. The Reality: The purpose of tracking is to inspire positive action, not to become a full-time data analyst. The Solution: Simplify. Choose 1-2 key metrics that matter most to your current goal (e.g., sleep duration and HRV for recovery). Focus on those. Set simple, habit-based actions (e.g., "I will be in bed by 10:30 PM on weeknights") and watch how those actions affect your chosen metrics over weeks, not days.
Pitfall 5: Forgetting the "Why"
The Trap: The routine of tracking becomes an empty ritual. You check the app out of habit, but no longer connect the numbers to meaningful changes in your life. The Reality: Data without purpose is just noise. The Solution: Regularly reconnect with your intention. Why did you start tracking? Was it to have more energy for your kids? To improve your running performance? To manage stress? Periodically review your data with this "why" in mind. Has your average energy level improved? Has your workout recovery gotten faster? This connects the dots between daily patterns and your overarching life goals.
By navigating these pitfalls, you cultivate a mature, balanced relationship with health tracking. It becomes a supportive tool for self-compassion and growth, not a source of stress or rigid judgment. For more guidance on this journey, our FAQ section addresses many common questions and concerns from new users finding their footing.
Tools of the Trade: An Overview of Modern Tracking Options
To capture the rich tapestry of your body’s patterns, you need the right tools. The market has evolved far beyond the basic pedometer. Today’s devices range from general fitness trackers to sophisticated health monitors, each with strengths and trade-offs. Understanding this landscape helps you choose the tool that best aligns with your goals for understanding your daily patterns.
Smartwatches: The Jack-of-All-Trades
The most recognizable form factor, smartwatches combine health tracking with smartphone notifications, apps, and often, GPS.
Pros: Excellent for daytime activity and workout tracking (especially with built-in GPS). Great screen for interactive feedback. Broad ecosystem of apps.
Cons for 24/7 Pattern Tracking: Can be bulky for sleep. Screens can be distracting, especially at night. Battery life often requires daily charging, which can lead to data gaps if charged overnight. Optical sensors on the wrist can be prone to motion artifact during certain activities.
Fitness Bands: The Streamlined Cousin
A more minimalist and affordable version of the smartwatch, focusing core tracking features.
Pros: Lightweight, comfortable for most, longer battery life than many smartwatches. Good for basic activity and sleep tracking.
Cons: Often have smaller, less advanced sensors. Limited functionality beyond tracking. Similar wrist-based limitations for continuous, clinical-grade data.
Smart Rings: The Discreet Powerhouse
Emerging as a dominant player in 24/7 health monitoring, the smart ring form factor offers unique advantages for understanding holistic body patterns.
Pros for Pattern Tracking:
Unobtrusive & Comfortable: Worn like jewelry, it’s easy to forget you’re wearing it, leading to higher compliance for all-day, all-night tracking.
Ideal for Sleep: No bulky screen or band to adjust. The finger provides a strong, consistent signal from a vascular-rich area, often yielding high-quality sleep and recovery data.
Long Battery Life: Multi-day battery life means you can charge it during a 1-hour break without missing a night’s data.
Focused on Health Metrics: Without a screen for notifications, the focus remains purely on collecting and presenting your health data, reducing digital distraction.
Cons: Limited real-time feedback (you check an app). Less ideal for precise, real-time heart rate monitoring during high-intensity workouts where hand motion is intense (though fine for most exercise). Requires proper sizing.
Dedicated Health Monitors & Patches
These are often medical or clinical-grade devices (like ECG patches) used for short-term, specific diagnostics prescribed by a doctor.
Pros: Extremely accurate for their specific purpose (e.g., atrial fibrillation detection, detailed ECG).
Cons: Not designed for comfortable, long-term, holistic pattern tracking of daily life. Can be expensive and obtrusive.
The Smart Ring Advantage for Daily Patterns
For the specific goal of understanding your body’s daily patterns—the continuous, cyclical rhythms of sleep, recovery, stress, and readiness—the smart ring is increasingly seen as an optimal tool. Its design philosophy aligns with seamless, uninterrupted data collection, which is the bedrock of reliable trend analysis. By being easy to wear 24/7, it
The journey of understanding your body doesn’t end with collecting data; it begins with making that data work for you in real time. This is where the rubber meets the road—where insights transform into daily actions that enhance your energy, performance, and well-being.
How to Use Your Daily Dashboard: A Practical Guide
Your app’s dashboard is your morning briefing from your body. Here’s how to read it effectively:
Start with Your Readiness/Recovery Score: This is your executive summary. Treat it as a guide, not a command.
High Score (e.g., 80-100): Your body is reporting in with high resilience. This is a green light for higher physical or mental load, intense workouts, or tackling demanding projects. It’s an opportunity to push adaptively.
Medium Score (e.g., 50-79): A yellow light. Your body is functioning but not at peak resilience. Opt for moderate activity, strength maintenance workouts, and be mindful of stress management. It’s a day for maintain.
Low Score (e.g., Below 50): A red light suggesting strain. This is a day to prioritize recovery. Choose gentle movement like walking or yoga, focus on hydration, nutrition, sleep hygiene, and stress reduction. A low score is valuable intel, not a failure.
Drill Down into the Contributors: Don’t just glance at the score. Click into it. Why is your score what it is?
Was your sleep poor? (Look at duration, deep/REM percentages, and restlessness).
Is your HRV significantly low? (This points to nervous system strain).
Is your resting heart rate elevated? (Suggests physical fatigue, dehydration, or illness onset).
Did you have a high stress load yesterday? Understanding the "why" behind the score tells you what to focus on for the day.
Check Live Stress/Energy Metrics Throughout the Day: Use these as a biofeedback tool. Notice when your stress score spikes during a long meeting or when your energy dips mid-afternoon. This awareness allows for micro-interventions: a two-minute breathing exercise, a short walk, or a glass of water.
Case Studies: From Insight to Action
Let’s see how this plays out in real life:
Scenario 1: The "Surprising" Low Score
Data: You feel fine, but your readiness score is low, driven by a 20% drop in HRV and a slightly elevated RHR. Sleep data looks normal.
Interpretation: Your body is signaling internal strain you haven’t subjectively felt yet. This is classic "silent stress"—perhaps from a hard workout two days ago, a lingering immune fight, or cumulative work pressure.
Smart Action: Scale back your planned intense workout to a light jog or mobility session. Prioritize a nutrient-dense lunch, hydrate well, and aim for an early bedtime. You’re using the data to prevent burnout or illness.
Scenario 2: The High Score After "Bad" Sleep
Data: You only slept 6 hours (your usual is 7.5) due to a late night, but your readiness score is high, with excellent HRV and a low RHR.
Interpretation: The quality of your shorter sleep was exceptionally efficient. Your nervous system is recovered and resilient.
Smart Action: Proceed with your day as planned, but be extra mindful of energy dips later. You might still feel subjectively tired, but your physiology is primed for performance. This helps you distinguish between habit ("I only slept 6 hours, I’ll be wrecked") and actual physiological state.
Scenario 3: The Mid-Day Energy Crash
Data: You notice a steady decline in your live stress/energy score every day between 2-4 PM.
Interpretation: This is a clear circadian dip, exacerbated perhaps by lunch choices or prolonged sitting.
Smart Action: Proactively schedule a 10-minute walk outside at 1:45 PM. The combination of movement, natural light, and a break from cognitive work can flatten the crash. Track how this intervention changes your score over the next week.
Building Your Personal Protocol
Based on your patterns, create simple "if/then" rules for yourself:
IF my readiness score is low AND HRV is down, THEN I swap my workout for a walk and meditate for 10 minutes.
IF my sleep latency is high for three nights in a row, THEN I implement a strict no-screens-after-9-PM rule for the next week.
IF my stress score stays elevated for over an hour during work, THEN I take a 5-minute break for box breathing.
This dynamic, responsive approach is the essence of living in sync with your body. It turns health from a static goal into an active, intelligent dialogue. For inspiration on specific habits you can build, explore our resource on 50 healthy aging tips a smart ring helps implement daily.
Integrating Data with Medical Insights: A Collaborative Approach
The wealth of data from personal health trackers is not meant to replace professional medical care; it is designed to complement and enrich it. When used thoughtfully, this data can foster a more collaborative, precise, and proactive partnership between you and your healthcare provider. It shifts the conversation from generalized symptoms to specific, longitudinal patterns.
Empowering Your Doctor’s Visits
Walking into an appointment with data transforms the dialogue.
From Subjective to Objective: Instead of saying "I’ve been tired for months," you can say, "My data shows my resting heart rate has trended up by 8 BPM over the last three months, and my average sleep efficiency has dropped to 78%. Here are the graphs." This provides concrete, temporal evidence of a problem.
Identifying Triggers: For conditions like migraines, arrhythmias, or unexplained fatigue, your data can help identify potential triggers. You might show your doctor that your episodes consistently follow nights of poor deep sleep or days with high stress scores, pointing toward sleep or nervous system dysregulation as a contributing factor.
Tracking Treatment Efficacy: "We started this new medication for my blood pressure two months ago. Alongside my clinical readings, my wearable shows a 12% average improvement in my nighttime HRV and a more stable daytime heart rate." This provides real-world, daily-life evidence of a treatment’s physiological impact beyond the clinic snapshot.
What Data is Most Clinically Useful?
While the average doctor may not have time to review 90 days of raw data streams, certain summarized insights are powerful:
Trends in Resting Heart Rate (RHR): A sustained, unexplained elevation can be an early, non-specific sign of various issues, from overtraining and chronic stress to metabolic or thyroid dysfunction.
Sleep Architecture Reports: Evidence of chronically low deep or REM sleep, or highly fragmented sleep, is highly relevant for cardiologists, endocrinologists, neurologists, and psychiatrists alike.
Heart Rate Variability (HRV) Trends: While still emerging in mainstream medicine, a long-term downward trend in HRV is a recognized indicator of autonomic nervous system imbalance and chronic stress load, relevant for managing anxiety, depression, POTS, and cardiovascular health.
Activity & Sedentary Patterns: For weight management, cardiology, and physical therapy, objective data on daily movement and sitting time is far more accurate than patient recall.
Responsible Sharing and Communication
To make this collaboration effective:
Summarize, Don’t Dump: Prepare a one-page summary highlighting key trends, not every daily data point. Use weekly averages and clear graphs.
Ask Informed Questions: "Given this trend of declining HRV alongside my fatigue, could this point to an autonomic nervous system issue we should explore?" or "My sleep data shows very little deep sleep. Could this be contributing to my slow recovery from injury?"
Choose the Right Context: This approach is often most welcomed by functional medicine doctors, cardiologists, sleep specialists, and endocrinologists who are accustomed to thinking in physiological systems. For more on what clinicians find valuable, see our article on what doctors find most useful in wellness ring data.
The Future is Integrative
The goal is a feedback loop: your doctor provides diagnosis and treatment plans based on clinical expertise, and you provide continuous, at-home data that shows how your body is responding in your real-world environment. This enables truly personalized, dynamic care. This collaborative model is at the forefront of how health tracking technology is beginning to integrate with hospitals, paving the way for remote patient monitoring and more preventative care models.
By bringing validated, long-term pattern data to your care team, you become an active, informed participant in your health journey. You provide the missing piece—the story of what happens between the occasional visits—allowing for smarter, faster, and more personalized healthcare decisions.
Building a Sustainable Tracking Habit: Beyond the Novelty
The initial weeks of health tracking are often fueled by curiosity and novelty. The real challenge—and the real reward—lies in integrating it sustainably into your life for the long term. The goal is for tracking to become a seamless, almost unconscious habit that supports your well-being without becoming a chore or an obsession. Here’s how to build a practice that lasts.
Focus on Habit Stacking, Not Perfection
The key to sustainability is ease. Don’t create a new, isolated ritual. "Habit stack" your tracking onto an existing, solid habit.
Morning Check-In: Make reviewing your readiness score part of your existing morning routine—while your coffee brews, after you brush your teeth, or during your first few minutes at your desk.
Evening Wind-Down: Charging your device (if needed) can be stacked with your existing bedtime routine—place it on the charger when you go to brush your teeth.
Weekly Review: Schedule a 10-minute weekly review (e.g., Sunday evening) to look at your 7-day trends. Stack this with another weekly planning habit.
By attaching the new behavior to an established one, you dramatically increase adherence.
Set Process Goals, Not Outcome Goals
Fixating on hitting a specific HRV number or sleep score every day is a recipe for frustration. Instead, set goals around the behaviors that influence those scores.
Outcome Goal (Fragile): "Achieve an average HRV of 60 this month."
Process Goal (Sustainable): "Be in bed with lights out by 10:30 PM on weeknights." or "Take a 5-minute breathing break when my stress score goes above 70." Process goals are fully within your control. As you consistently hit these behavioral goals, the positive outcomes in your data will follow naturally, creating a virtuous cycle.
Embrace Periodic Detachment
Ironically, a sustainable tracking habit requires planned breaks from tracking. Constant vigilance can lead to hypervigilance and anxiety.
The Data Sabbath: Consider taking one day off per month where you don’t check your app at all. Wear the device if you wish (to maintain data continuity), but resist the urge to look. Reconnect with how you feel without the influence of a score.
Vacation Mode: On a true vacation, you might decide to leave the device at home or simply not check it. The goal is to immerse yourself in rest and experience without analysis.
These breaks prevent burnout, reset your relationship with the data, and remind you that the tool is there to serve you, not the other way around.
Evolve with Your Goals
Your tracking focus should evolve as you do. The metrics that matter when you start are not the same ones that will matter a year later.
Phase 1 (Awareness - Months 1-3): Focus on establishing baselines and observing basic correlations (sleep vs. energy, alcohol vs. recovery).
Phase 2 (Experimentation - Months 4-9): Use your stable baseline to test interventions. Systematically change one variable (e.g., caffeine cutoff time, workout timing, meditation practice) and observe the effect on your trends.
Phase 3 (Mastery & Maintenance - Year 1+): Tracking becomes a lightweight monitoring system. You check in periodically to ensure you’re staying within your healthy ranges. You deep-dive only when something feels off or when preparing for a new goal (e.g., training for a race).
Celebrate the "Aha!" Moments
Sustainability is fueled by positive reinforcement. When you have an insight that leads to a positive change—like fixing your afternoon crash by walking, or improving your sleep by adjusting your room temperature—acknowledge it. That moment of understanding is the core value proposition of tracking. It builds intrinsic motivation that lasts far longer than any gamified badge.
By following these principles, health tracking matures from a tech fad into a foundational component of your self-care practice. It becomes like brushing your teeth—a simple, non-negotiable habit that maintains your foundational health. For those just starting this journey, our guide on how to choose the perfect wellness ring for beginners can help set the right foundation for a sustainable habit from day one.
Conclusion of This Portion: Your Foundation for Lifelong Health Awareness
We have now journeyed through the fundamental landscape of understanding your body’s daily patterns. From grasping the profound importance of your unique baseline to decoding the language of your core metrics—heart rate, HRV, sleep, and activity—you’ve built the knowledge framework. You’ve learned how to collect data accurately, interpret the stories within the trends, respect your master circadian clock, and see the direct feedback from your lifestyle choices. You’re equipped to navigate common pitfalls, choose the right tools, and, most importantly, turn daily insights into intelligent actions that enhance your life.
This is more than a collection of tips; it is a paradigm shift. You are no longer a passenger in your body. You have become an observer, a student, and a compassionate curator of your own well-being. The patterns you’ve learned to track are the vital signs of a life in motion—the physiological poetry of your existence. By learning to read this poetry, you gain agency. You move from reacting to illness to cultivating wellness, from guessing to knowing, from generic advice to personalized truth.
The journey does not end here. What you have mastered are the basics—the essential grammar of your body’s language. With this solid foundation, you are now prepared to explore the more advanced, nuanced dialects of your health. In the next portion of this comprehensive guide, we will build upon this foundation. We will delve into advanced biometrics, explore the science of chronobiology and meal timing, investigate the interplay between mental health and physiological data, and provide deep-dive strategies for optimizing specific areas like athletic performance, metabolic health, and longevity. We’ll also look at the horizon, examining the future of this technology and its role in creating a truly integrated, preventive healthcare ecosystem.
You have learned to listen. Now, you will learn to converse. You have mapped your territory. Now, you will learn to navigate it with mastery. Continue to our blog for deeper explorations on each of these topics as you await the next installment of your guide to becoming the expert of your own health.
Ready to begin tracking your unique patterns? Discover the tool designed for seamless, 24/7 awareness at the Oxyzen Shop.
Health Tracking Mastery: From Awareness to Advanced Optimization
You’ve built the map. You’ve learned to read the terrain of your daily rhythms, heartbeats, and sleep cycles. This foundational knowledge is the most critical step, transforming you from a passive inhabitant of your body into an informed observer. But observation is only the beginning. The true power of health tracking lies in what you do with this awareness—the deliberate, nuanced, and personalized optimization it makes possible.
Welcome to the next phase of your journey: mastery. In this portion, we move beyond understanding "what is" and venture into the realm of "what if." What if you could align every meal, workout, and period of rest with your body's precise biological clocks? What if you could decode the subtle signals that differentiate productive stress from detrimental strain? What if your wearable data could provide not just a report card, but a real-time coaching system for peak mental and physical performance?
This section is dedicated to transforming your foundational awareness into advanced, actionable strategy. We will explore the sophisticated interplay between different biometric systems, delve into the emerging science of personalized health timing, and provide frameworks for tackling specific, high-level goals—from shaving minutes off your race time to stabilizing your energy for deep creative work. We'll confront the complexities of mental and emotional well-being as seen through physiological data, and peer into the near future where this technology will seamlessly integrate with professional healthcare.
You have learned the alphabet of your body. Now, let's write a masterpiece.
Advanced Biometrics: Going Deeper Than the Basics
While resting heart rate, HRV, and sleep stages form the core triad of daily tracking, a new wave of advanced biometrics is becoming accessible through modern wearable technology. These metrics provide a finer-grain, more specialized lens into your physiology, offering insights that can fine-tune your optimization strategies for specific goals.
Respiratory Rate: The Window to Autonomic Balance
Often overlooked, your breathing rate—the number of breaths you take per minute—is a direct mirror of your autonomic nervous system state.
What It Is: Typically measured at rest (especially during sleep) or during light activity. A normal adult resting respiratory rate is 12-20 breaths per minute.
What It Tells You:
Recovery & Sleep Quality: During deep sleep, your respiratory rate should be at its lowest and most stable. A persistently high or highly variable nighttime respiratory rate can signal poor sleep quality, underlying stress, or even sleep apnea.
Illness Onset: One of the earliest and most reliable signs of a respiratory infection or systemic illness is an elevated resting respiratory rate, often appearing before a fever or cough.
Stress Response: In moments of acute stress or anxiety, your breathing becomes faster and shallower. Tracking this can help validate subjective feelings of stress with objective data.
Actionable Insight: Use a rising trend in your sleeping respiratory rate as an early warning to prioritize recovery. Practice diaphragmatic breathing exercises to actively lower your daily average and stimulate the parasympathetic nervous system.
Skin Temperature: The Circadian Torchbearer
While not a measure of core temperature, continuous wrist or finger skin temperature tracking reveals powerful circadian and hormonal patterns.
What It Is: The temperature of your skin, which fluctuates in a predictable rhythm influenced by your core temperature, blood flow, and external environment.
What It Tells You:
Circadian Rhythm Phase: Your skin temperature follows a clear 24-hour wave, dipping to its lowest point in the early morning (a key signal to wake up) and peaking in the late afternoon/early evening. A disrupted skin temp rhythm is a strong indicator of circadian misalignment (e.g., from jet lag, shift work).
Ovulatory Cycle Tracking: For women, a sustained rise in basal (waking) skin temperature of about 0.5-1.0°F (0.3-0.6°C) confirms that ovulation has occurred, as progesterone increases body temperature. This is a key data point for natural cycle tracking.
Illness & Inflammation: An unexplained elevation in your nightly skin temperature trend can signal your body is fighting an infection or dealing with inflammation.
Actionable Insight: Use your temperature minimum (the low point) as a cue. Exposure to light after this point helps advance your clock (wake earlier); exposure before it delays your clock (stay up later). This is chronobiology in action. For more on cycle syncing, you can personalize your approach with advanced wellness ring features.
Blood Oxygen Saturation (SpO2): The Cellular Fuel Gauge
This metric, once confined to clinics, now provides ongoing insight into your respiratory efficiency during critical rest periods.
What It Is: The percentage of your hemoglobin that is carrying oxygen. Healthy levels are typically 95-100%.
What It Tells You:
Sleep Apnea Indicator: The primary use in wearables is for spotting potential sleep-disordered breathing. Repeated, significant dips in SpO2 during sleep (below 90%) can be a flag for events where breathing stops or becomes shallow.
Altitude Acclimation: When at high altitude, tracking SpO2 can show how well your body is acclimating to lower oxygen availability.
Respiratory Health: During illness like COVID-19 or flu, monitoring SpO2 trends can provide important information, though it should never replace medical advice.
Actionable Insight: Pay attention to trends, not one-off dips. If your wearable reports frequent or large SpO2 drops at night, especially accompanied by spikes in heart rate or movement, it’s valuable data to share with a sleep specialist.
Time-Restricted Eating (TRE): Syncing Food with Your Clock
Your metabolism has a circadian rhythm too. Eating aligned with your active phase and fasting during your rest phase can improve metabolic health, energy, and sleep.
The Principle: Compress your daily eating window. A common pattern is an 8-hour feeding window (e.g., 12:00 PM - 8:00 PM) and a 16-hour fast. This gives your digestive system and cellular repair processes (autophagy) a defined rest period.
Tracking It: Use your app to note meal times. Correlate late eating with elevated nighttime heart rate, poor sleep scores, or next-morning glucose spikes (if you have a continuous glucose monitor). Notice if an earlier, consistent eating window improves your sleep and recovery metrics.
Personalization: Lions may thrive on an earlier window (7 AM - 3 PM), while Wolves may do better with a later one (1 PM - 9 PM). Let your energy and hunger data guide you.
By biohacking your schedule based on chronobiology, you reduce internal friction. You’re swimming with the current of your biology, not against it. This advanced synchronization is a prime example of how health tracking enables truly personalized wellness, moving far beyond generic advice.
The Mind-Body Connection: Tracking Stress, Mood, and Mental Fitness
The most profound frontier in personal health tracking is the bridge between measurable physiology and subjective mental experience. Our thoughts, emotions, and stress leave clear fingerprints on our biometric data. Learning to read these fingerprints allows us to manage mental well-being with the same precision we apply to physical training.
Physiological Signatures of Mental States
Your wearable can’t read your mind, but it can read your body’s reaction to your mind.
Acute Stress & Anxiety: Look for a sudden, sharp spike in heart rate alongside a rising stress score, often without physical movement. HRV will plummet in real-time. Breathing rate may increase.
Chronic Stress & Burnout: This appears as a trend. A gradual, sustained elevation in resting heart rate and a suppression of HRV over weeks or months. Sleep becomes fragmented (increased wakefulness, reduced deep sleep). Recovery scores are perpetually low.
Rumination & Mental Load: Even while physically still (sitting at a desk), you may see an elevated and unstable heart rate and a high stress score. This is the physiology of "busy brain."
Focused "Flow" State: Characterized by a lower, stable heart rate despite cognitive engagement, and often a moderate, steady stress score. The body is calm while the mind is active.
Positive Engagement & Joy: Similar to flow, but may be accompanied by a slightly elevated heart rate from positive excitation, yet with good HRV—a sign of healthy, engaged arousal.
Using Data for Emotional Awareness and Regulation
Tracking turns internal states into external objects you can observe and manage.
Identify Your Triggers: Review your data after a tough day. What happened in the hours before your stress score spiked? Was it a specific meeting, a type of interaction, or even hunger? This objective feedback can reveal hidden stressors.
Quantify the Calm: After a meditation session, breathing exercise, or walk in nature, check your metrics. Did your heart rate drop? Did your HRV recover? Did your stress score change from orange to green? This positive reinforcement strengthens the habit. For techniques, see how a wellness ring helps build healthy habits like mindfulness.
Preempt the Crash: If you see your stress score climbing into the red during a work marathon, that’s your cue for a proactive 5-minute intervention before you feel fried. It’s a biofeedback loop for self-regulation.
Correlate Mood with Physiology: Use a simple 1-5 mood log in your app’s journal feature. Over time, you’ll see clear patterns: "On days my HRV is above [my average], I rate my mood a 4 or 5. On low HRV days, I’m a 2."
The Limits and Ethical Considerations
It’s vital to approach this with balance.
Data is a Guide, Not a Guru: Your feeling of sadness or anxiety is valid, regardless of what your HRV says. The device measures autonomic arousal, not the content or quality of your emotions.
Avoid Emotional Performativity: Don’t judge yourself for having a "bad" stress score. Use it with curiosity: "My body is stressed. I wonder what’s going on?" not "I’m failing at relaxation."
Privacy is Paramount: Mental health data is deeply personal. Ensure you use devices and apps with robust privacy settings and data security. You control who sees this intimate portrait of your inner state.
By integrating subjective mood logging with objective physiological tracking, you create a powerful feedback system for mental fitness. You learn which activities genuinely calm your nervous system, you catch spirals of stress earlier, and you build a more compassionate, data-informed relationship with your own mind. This holistic view is the future of well-being, a topic explored in our piece on the future of wearable health tech.
Optimizing for Specific Goals: Performance, Longevity, and Metabolic Health
With a masterful understanding of your patterns and the mind-body connection, you can now direct your efforts with surgical precision. Health tracking isn’t about being generically "healthier"—it’s about channeling your biology toward your most important objectives. Let’s map out strategies for three common high-level goals.
Goal 1: Athletic Performance & Recovery
For the athlete, data is the ultimate coach. The goal is to optimize the stress-recovery cycle to achieve peak performance on demand.
Key Metrics: HRV (the North Star), Resting Heart Rate (RHR), Sleep (especially deep sleep), Training Load (if your device calculates it), and Recovery/Readiness Score.
The Performance Protocol:
Plan with Readiness: Let your morning readiness score guide your session’s intensity. High score = go hard. Medium score = maintain. Low score = active recovery or rest. This prevents overtraining.
Track the Workout Effect: Post-session, note how your body responds. A large elevation in next-morning RHR and a drop in HRV is normal after intense training. It should rebound within 24-48 hours.
The 72-Hour Rule: Monitor the 72-hour window after a key competition or brutal workout. Your metrics may be depressed. This is when you are most vulnerable to illness or injury. Prioritize sleep, nutrition, and gentle movement until metrics trend upward.
Taper Perfectly: In the final week before a race or event, watch your HRV climb and your RHR drop as you reduce volume. This is the sign of "supercompensation"—you’re peaking.
Advanced Tactic: Use nocturnal HRV (your average overnight HRV) as a more stable metric than a single morning reading for guiding long-term training cycles.
Goal 2: Longevity & Healthspan
The longevity enthusiast focuses on slowing biological aging and maintaining function. Metrics shift toward stability, resilience, and metabolic health.
Key Metrics: HRV Trend (higher and more stable is better), Sleep Consistency, Resting Heart Rate Trend (lower is better), Heart Rate Recovery (how fast your HR drops after exercise), VO2 Max Estimate (a powerful predictor of longevity), and Glucose Trends (if using a CGM).
The Longevity Protocol:
Circadian Rigor: This is paramount. Extreme consistency in sleep/wake times, light exposure, and meal timing to reduce systemic inflammation and support cellular repair.
Stress Resilience Banking: Use your data to identify which practices (sauna, cold exposure, meditation, nature) most effectively boost your HRV and lower your RHR. "Bank" these practices regularly to build physiological resilience.
Zone 2 Cardio as Medicine: Use your heart rate zones to ensure you’re getting 150+ minutes per week of true, steady-state Zone 2 cardio (where you can hold a conversation). This builds mitochondrial health and metabolic flexibility—cornerstones of aging well.
Monitor the Drift: The goal is to slow the natural age-related decline of metrics like HRV and VO2 Max. Seeing a positive trend or maintained stability in these as you age is a major win.
Advanced Tactic: Correlate lifestyle experiments (e.g., a new supplement, fasting protocol) with multi-week trends in your HRV and sleep quality, not just how you feel in the moment.
Goal 3: Metabolic Health & Weight Management
Here, the focus is on energy utilization, blood sugar stability, and sustainable habit formation.
Key Metrics: Resting Heart Rate (linked to metabolic rate), Activity & NEAT (non-exercise activity thermogenesis is huge), Sleep (poor sleep disrupts hunger hormones), Heart Rate During Exercise (to ensure effective fat-burning zones), and Continuous Glucose Monitor (CGM) Data if available.
The Metabolic Protocol:
NEAT is Non-Negotiable: Your tracker’s step count and active minute goals are crucial. Set alerts to move every hour. Maximizing daily movement has a greater impact on total energy expenditure than your 30-minute workout alone.
Sleep for Appetite Control: Correlate poor sleep nights with next-day hunger pangs and cravings. Use this data to defend your sleep schedule as fiercely as your diet.
Optimize Workout Timing: If weight loss is the goal, some data suggests fasted, low-to-moderate intensity cardio (in your fat-burning zone) may be efficient. Use your heart rate zones to stay in that range.
Identify Personal Triggers: If using a CGM linked to your app, you can see which foods cause dramatic glucose spikes and crashes for you, leading to energy dips and hunger. This personalized feedback is far more powerful than generic food lists.
Advanced Tactic: Use your body temperature and resting heart rate data to estimate your menstrual cycle phase (for women). Appetite and metabolic rate naturally fluctuate with the cycle, and understanding this can prevent frustration with scale weight changes.
Each of these goal-oriented frameworks turns passive tracking into an active management system. You’re not just collecting data; you’re running a continuous optimization loop for your most valued life outcomes. To see how different devices support these paths, you might explore a wellness ring comparison of top brands.
The Wearable Ecosystem: Integration and the Connected Health Hub
Your smart ring or watch is a powerful soloist, but its performance elevates to a symphony when integrated into a broader ecosystem of health apps and devices. This connected environment creates a holistic health hub, providing a unified, multi-dimensional view of your well-being that is greater than the sum of its parts.
The Power of App Integration
Most advanced health platforms allow data to flow between applications via Apple Health, Google Fit, or proprietary APIs. This integration is transformative:
Nutrition + Biometrics: Sync your food logging app (like Cronometer or MyFitnessPal) with your wearable. Now you can see how specific meals or macros affect your next-morning resting heart rate, HRV, or sleep quality. Does a high-carb dinner spike your nighttime heart rate? Does adequate protein improve your recovery score?
Fitness + Recovery: Connect your workout app (Strava, TrainingPeaks, Peloton) to your health platform. Your wearable’s readiness score can be displayed in your fitness app to guide your workout, and your post-workout fatigue can automatically feed back into your recovery metrics.
Mindfulness + Physiology: Link your meditation app (Calm, Headspace). See the direct, quantifiable impact of a 10-minute meditation on lowering your live stress score and heart rate. This builds a powerful feedback loop for mental training.
Women’s Health + Cycle Tracking: Syncing a dedicated cycle tracking app provides context for your biometrics. You can see how your resting heart rate, skin temperature, and HRV naturally fluctuate across your menstrual cycle, allowing for truly cycle-synced training and nutrition.
Creating a Single Source of Truth
The goal is to avoid data silos. By funneling information into a central hub (often the app that comes with your primary wearable), you create a dashboard where disparate data points converse.
Example Dashboard View: On a single screen, you see: yesterday’s workout intensity from Strava, your sleep score from your ring, your morning weight from a smart scale, your logged food intake, and your current readiness score. Now you can ask: "Did my heavy squat session, combined with a caloric deficit, lead to my poor recovery score and elevated RHR?" The answer is in the correlated data.
The Rise of the Connected Health Device
Your wearable is the centerpiece, but it can be augmented by specialized devices:
Smart Scales: Provide body composition data (body fat %, muscle mass, water weight). Trend this alongside your fitness and nutrition data.
Continuous Glucose Monitors (CGMs): Offer a real-time view of your blood sugar responses. This is the holy grail for metabolic optimization. Seeing your glucose spike after a "healthy" smoothie can be a paradigm-shifting insight.
Smart Blood Pressure Monitors: For those monitoring hypertension, periodic readings can be logged alongside daily stress and activity data to identify lifestyle triggers.
EEG Sleep Headbands or Mats: For deep sleep optimization, these can provide even more detailed sleep staging data to cross-reference with your wearable’s sleep score.
Practical Steps to Build Your Hub
Choose a Primary Platform: This is usually the native app of your 24/7 wearable (e.g., Oura, Whoop, Apple Health, Google Fit). Ensure it has strong integration capabilities.
Enable Permissions: In your primary app’s settings, find "Connections," "Apps," or "Data Sources." Connect and authorize your other health and fitness apps.
Audit for Redundancy: You don’t need five apps tracking your steps. Decide which device is the primary source for each data type (e.g., your ring for sleep and HRV, your watch for GPS runs) and let the others write data to the hub without duplication.
Review Correlatively: Make your weekly review about connections. Don’t just look at sleep data in isolation. Look at it next to your workout calendar and your nutrition log.
Navigating the Data Deluge: Advanced Analysis and Long-Term Trend Spotting
As you progress from months to years of consistent tracking, you amass a priceless asset: your longitudinal health dataset. This isn’t just a log of daily scores; it’s the story of your life told through your physiology. Learning to analyze these long-term trends moves you from tactical daily adjustments to strategic life planning for health.
The Quarterly and Annual Review
Move beyond the weekly check-in. Schedule a deeper dive every 3 and 12 months.
What to Look For in a Quarterly Review:
Seasonal Patterns: Do your HRV and sleep scores dip in the hectic holiday season (Nov-Dec) or improve during summer vacation? Does your resting heart rate trend lower in cooler months?
Habit Efficacy: That new meditation practice you started 10 weeks ago—has it moved the needle on your average stress score or baseline HRV?
Training Cycle Analysis: For athletes, review the entire build, peak, and taper cycle for a goal race. How did your metrics correlate with performance and injury?
What to Look For in an Annual Review:
The Grand Trendline: Open the 1-year graph for your key metrics. Is the trendline for your HRV flat, slightly up, or slightly down? What about your resting heart rate? This is your high-level "biological age" and resilience report card.
Life Event Impact: Can you see the physiological signature of major life events—a new job, a move, the birth of a child, a period of grief—in your data? This isn’t about judgment, but about understanding the profound mind-body connection and your personal resilience timeline.
Aging Gracefully: Is the natural, age-related decline in certain metrics (like average HRV) happening slower than expected? This is the ultimate sign of effective lifestyle choices.
Statistical Significance in Personal Data
In your personal experiment of one, "statistical significance" means a change that is consistent and meaningful relative to your normal noise.
Establish Your Normal Range: For your RHR, HRV, and sleep duration, calculate your standard range (average ± typical variation). A change needs to be outside this range for several days to be noteworthy.
The 5-7% Rule: For metrics like HRV, a change of less than 5% from your rolling average is likely noise. A sustained change of 7% or more is a clear signal worth investigating.
Correlation vs. Causation (Personal Edition): You notice your deep sleep percentage drops every time you eat after 9 PM. You’ve seen this 15 times over six months. That’s a strong personal correlation that likely indicates causation for you, even if it doesn’t hold true in a population study.
Using Data for Preventative Insights
This is the crown jewel of long-term tracking. Your data can show you the precursors to burnout, overtraining, or metabolic drift years before they manifest as disease.
The Burnout Trajectory: It often looks like this: 1) A gradual, multi-month creep in resting heart rate. 2) A parallel, gradual suppression of HRV. 3) An increase in sleep latency and nighttime awakenings. 4) A final plunge in recovery scores and subjective energy. Seeing stages 1 and 2 is your chance to intervene dramatically.
Metabolic Inflexibility Warning Signs: A steadily rising trend in your resting heart rate, combined with poorer heart rate recovery after exercise and less variation in daily energy levels, can hint at declining metabolic health, even if your weight is stable.
The Importance of "Return to Baseline": After any stressor—illness, intense work project, emotional event—track how long it takes your metrics to return to their pre-stressor baselines. This "recovery velocity" is a key measure of resilience. Slowing recovery velocity over time is a critical alert.
Tools for Advanced Analysis
Data Export: Use your app’s data export feature (often CSV or JSON files) to import your data into spreadsheet software or visualization tools like Google Sheets or Airtable.
Custom Dashboards: Create your own graphs that combine data from different sources (e.g., plot workout intensity against next-day HRV for the last year).
Journaling Integration: Digitally tag your journal entries with key events. In your annual review, read your entries from periods of peak and valley in your biometrics to understand the full context.
By mastering long-term trend analysis, you become the historian and futurist of your own health. You learn from the past to wisely navigate the future. This profound level of self-knowledge is what separates a dabbler from a true master of health tracking. For those considering this deep dive, understanding the continuous vs. periodic monitoring debate is essential, as longitudinal insight requires consistent, continuous data.
The Future of Personal Health Tracking: What's Next?
The field of biometric tracking is not static; it’s accelerating at a breathtaking pace. The devices and insights we have today are merely the foundation for a future where health monitoring will be predictive, preventative, deeply integrated with medicine, and seamlessly woven into the fabric of our lives. Let’s explore the horizon.
On the Immediate Horizon (1-3 Years)
Non-Invasive Blood Glucose Monitoring: The race is on to create a wearable that can accurately estimate blood glucose trends without breaking the skin (unlike CGMs). Success here would revolutionize metabolic health management for millions.
Blood Pressure Monitoring from the Wrist/Finger: While some devices claim this already, the next generation will achieve medical-grade accuracy for continuous, cuff-less monitoring, a game-changer for hypertension management.
Advanced Stress & Mental State Detection: Using a combination of HRV, skin conductance (EDA), and temperature, algorithms will better differentiate between types of stress (eustress vs. distress) and even detect early signs of mood disorders with higher sensitivity.
True Recovery Prediction: Instead of just telling you how recovered you are now, AI will predict how you will recover from a planned workout or stressful event 24-48 hours in advance, allowing for perfect daily planning.
The Mid-Term Future (3-7 Years)
Multi-Modal Sensor Fusion: Your ring, your smart glasses, your earbuds, and even your clothing will contain specialized sensors that communicate. Your earbuds might track core temperature, your glasses track pupil dilation for cognitive load, and your ring track cardiovascular metrics—all synthesized into a holistic health avatar.
AI-Powered Hyper-Personalized Coaching: Your AI health assistant won’t just show data. It will know your goals, your schedule, your biometric responses, and your personal preferences. It will say: "Based on your lowered HRV trend and your big presentation tomorrow, I recommend you cancel your HIIT session, do 20 minutes of yoga at 6 PM, and aim for lights out by 10:15 PM. I’ve already adjusted your smart lights to facilitate this."
Early Disease Detection Algorithms: With regulatory approval, wearables will move from "general wellness" to "software as a medical device." Algorithms trained on massive datasets will look for the subtle, early physiological signatures of conditions like atrial fibrillation, sleep apnea, diabetes, and even some inflammatory diseases, prompting users to seek early clinical evaluation. Learn about the potential in our article on what's possible in health tech by 2025.
The Long-Term Vision (7+ Years)
The "Digital Twin": A dynamic, computational model of your unique physiology, built from a lifetime of your biometric, genomic, and microbiome data. Doctors could simulate interventions (a new drug, a surgical procedure) on your digital twin to predict outcomes and personalize treatment plans with unprecedented accuracy.
Seamless Integration with the Healthcare System: Your consented, anonymized longitudinal data will contribute to population health research. Your doctor will have secure, real-time access to your relevant trends during your telehealth visit. Prescription doses could be adjusted based on your continuous response data.
Preventive Medicine as the Default: The healthcare model will fundamentally shift from "sick care" to true prevention. Insurance incentives will be tied to engagement with predictive health tracking, as preventing a heart attack is infinitely cheaper than treating one.
Ethical and Societal Considerations
This exciting future comes with profound questions we must navigate as a society:
Data Privacy & Ownership: Who owns your lifelong health data? How is it protected? Can it be used against you by employers or insurers? Robust, user-centric data governance will be non-negotiable.
The Equity Gap: Will these technologies widen health disparities, serving only the wealthy? Ensuring accessibility and designing for diverse populations is a critical challenge.
The Human Element: As algorithms get smarter, we must guard against over-deference to technology. The patient-provider relationship and human intuition must remain central. Data should inform, not replace, human care.
The journey from today’s smart rings to tomorrow’s health-aware digital ecosystems is underway. By becoming a savvy user today, you are not just optimizing your current well-being; you are preparing to be an empowered, informed participant in the future of health itself. To follow this evolution, stay connected with thought leadership on our blog.
Conclusion of This Portion: The Empowered Self
We have traversed from the advanced metrics that fine-tune our understanding to the chronobiological rhythms that optimize our days. We’ve built bridges between mind and body, crafted goal-specific protocols, and woven our devices into a connected health hub. We’ve learned to analyze the story of our years and glimpsed the transformative future on the horizon.
This journey culminates not in a destination, but in a state of being: the state of the Empowered Self.
You are no longer subject to the whims of unexplained fatigue, unpredictable mood, or stagnant progress. You have developed a literacy in the language of your own body. You possess the tools to investigate, the framework to interpret, and the wisdom to act. You understand that health is not a single number on a scale or a lab report, but a dynamic, interconnected system—a system you can now observe, respect, and guide with intention.