Making Sense of Your Numbers: Why Your Ring Scores Fluctuate Daily
Why your ring scores go up and down every day.
Why your ring scores go up and down every day.
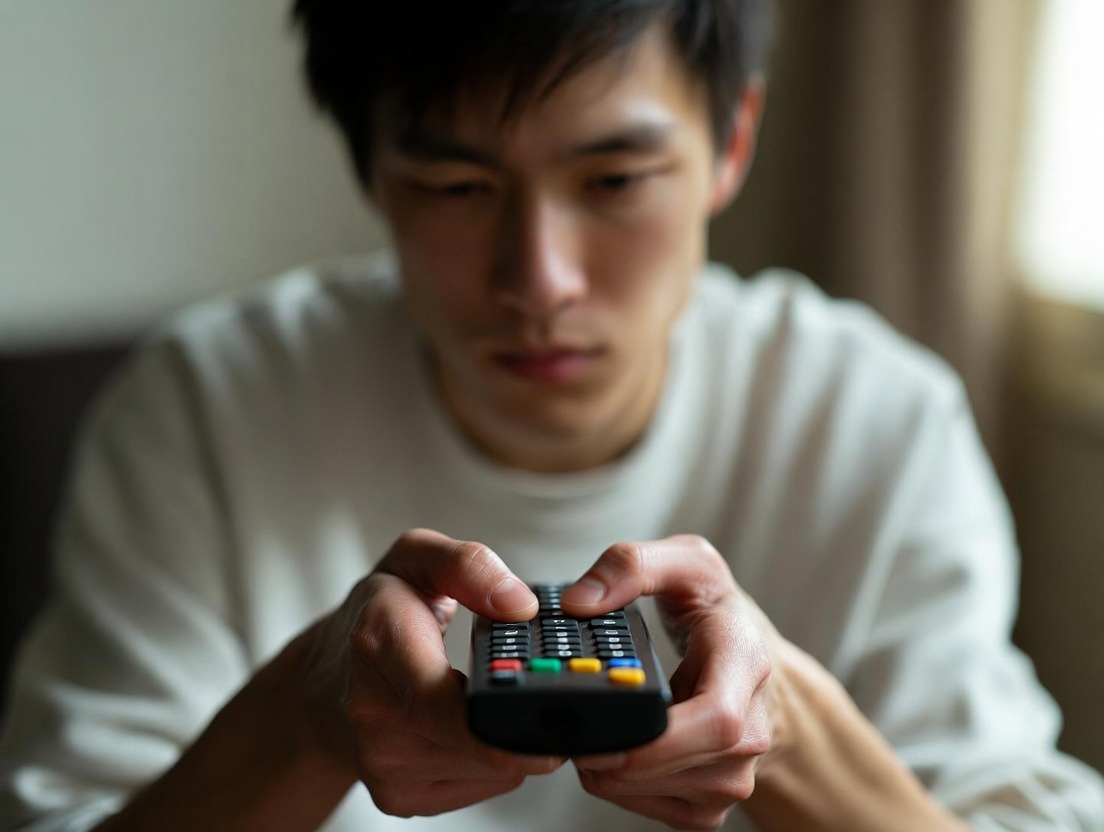
You wake up, grab your phone, and tap open your wellness app, eager to see the verdict from your smart ring’s all-night analysis. A wave of confusion hits. Your Readiness Score is a full 15 points lower than yesterday. Your Sleep Score, which was a triumphant 92 two nights ago, now reads a mediocre 78. Your heart rate variability (HRV) looks like a mountain range on the chart. A nagging thought emerges: “Is this thing broken? Or... am I broken?”
If you’ve experienced this digital dissonance, you are not alone. In the world of wearable wellness, daily fluctuations in your core metrics are not a sign of a faulty device or a failing body—they are the very essence of the story. Your body is not a machine programmed to output identical data every 24 hours; it is a dynamic, living system constantly adapting to a complex symphony of inputs: stress, recovery, nutrition, movement, emotion, and environment.
Chasing static, perfect scores is a recipe for frustration. The true power of a device like the Oxyzen smart ring lies not in achieving a single, flawless number, but in learning to interpret the beautiful, sometimes perplexing, language of fluctuation. This is the journey from data overwhelm to body literacy. This article is your comprehensive guide to decoding that language. We will move beyond the anxiety of “good” vs. “bad” scores and delve into the physiological and lifestyle reasons behind the daily dance of your numbers. By the end, you won’t just see fluctuations—you’ll understand the messages they carry, empowering you to make informed, personalized decisions about your health every single day.
Our culture is obsessed with optimization and peak performance. We are conditioned to see upward trends as “good” and any dip as “bad.” This mindset, when applied to biofeedback from a smart ring, is fundamentally misleading. It creates an unhealthy relationship with your own physiology, where you view your body’s natural adaptive responses as failures.
Consider this: your body’s primary goal is not to score 100 on a proprietary wellness algorithm. Its goal is homeostasis—maintaining a stable internal environment—and allostasis—adapting successfully to challenges. A consistently flat-line HRV is not a sign of perfect health; it can be a sign of chronic stress or a lack of adaptive capacity. A Sleep Score that never wavers might mean you’re never challenging your system enough to require deeper, more recuperative sleep.
The algorithms behind your Readiness, Sleep, and Recovery scores are designed to reflect this dynamic state. They are a snapshot of your system’s current status relative to your own baselines. A lower Readiness Score after an intense workout isn’t a mark of poor health; it’s an accurate reflection that your body has incurred a metabolic cost and needs resources for repair. It’s your ring saying, “Hey, we did a lot yesterday. Let’s prioritize recovery today.”
To truly benefit from this technology, the first and most crucial mental shift is to abandon the quest for perfection. Instead, adopt the mindset of a curious scientist observing a complex ecosystem. Your daily scores are data points in a long-term narrative. The story isn’t in a single chapter (one day’s score), but in the plot developments over weeks and months. This perspective is the cornerstone of a sustainable wearable wellness journey, where data empowers rather than judges.
Embracing natural rhythm means understanding that your body has cycles within cycles—circadian rhythms, ultradian rhythms, hormonal cycles, and seasonal shifts. Your scores will—and should—ride these waves. The goal is to harmonize your lifestyle with these rhythms, not to override them in pursuit of a static digital trophy.
Before we can understand why scores change, we must understand what they are built upon. Your smart ring’s dashboard isn’t just presenting numbers; it’s translating raw physiological signals into interpretable insights. Let’s break down the core pillars.
Heart Rate Variability (HRV): The Gold Standard of Autonomic Nervous System Balance
HRV is arguably the most important and misunderstood metric. It measures the subtle variations in time between each heartbeat. Contrary to intuition, a higher HRV (more variability) is generally better. It indicates a robust, resilient autonomic nervous system (ANS) that can swiftly switch between sympathetic (“fight or flight”) and parasympathetic (“rest and digest”) states.
Resting Heart Rate (RHR): Your Metabolic Idle Speed
Your RHR is the number of times your heart beats per minute while you are truly at rest (typically during sleep). A lower RHR often indicates better cardiovascular fitness and efficient heart function.
Sleep Architecture: Beyond Just “Hours in Bed”
Modern wearables like the Oxyzen ring move far beyond simple duration tracking. They analyze sleep stages: Light, Deep, and REM (Rapid Eye Movement) sleep. Each stage serves a critical function—physical repair in Deep sleep, memory consolidation and emotional processing in REM sleep. Your Sleep Score is a composite metric evaluating not just duration, but also consistency, timing, and the balance of these stages.
Body Temperature: A Subtle, Powerful Signal
Continuous wrist- or finger-based temperature sensing is a game-changer. It tracks your distal body temperature, which follows a circadian rhythm and is influenced by core temperature changes.
Respiratory Rate: The Quiet Indicator
The number of breaths you take per minute during sleep is a stable but insightful metric.
Activity & Recovery: The Ying and Yang
This isn’t just a step count. It’s about quantifying physiological load (the stress applied) and measuring your body’s response to that load. Your Readiness or Recovery Score is the algorithm’s synthesis of all the above metrics (HRV, RHR, sleep, temperature) to answer one question: “How prepared is this body to take on stress today?”
Understanding these individual metrics is the first step to demystifying your composite scores. They are the raw vocabulary of your body’s language.
Now that we know what’s being measured, let’s connect the dots. Your daily life is the input; your ring data is the output. Here are the most powerful levers pulling your scores up and down.
1. Exercise & Physical Load: The Double-Edged Sword
Exercise is a controlled dose of stress. It breaks down tissue with the intent of prompting a supercompensation—building back stronger. This process is vividly reflected in your metrics.
2. Sleep Quality & Quantity: The Foundation
Sleep is non-negotiable for recovery. It’s when the magic of repair, memory consolidation, and metabolic regulation happens. Inconsistency here creates ripple effects everywhere.
3. Nutrition & Hydration: The Internal Chemistry Set
What and when you eat and drink directly fuels or hinders your physiological processes.
4. Mental & Emotional Stress: The Invisible Load
Your brain doesn’t distinguish between a deadline and a predator. Chronic worry, anxiety, or emotional turmoil keeps your sympathetic nervous system subtly engaged.
5. Circadian Rhythm & Consistency: The Body’s Master Clock
Your body thrives on predictability. The timing of your sleep, meals, and activity cues your internal clock, which governs hormone release, temperature, and alertness.
6. Alcohol & Substances: The Chemical Disruptors
These are pharmacological interventions with direct, measurable effects.
7. Environment: The External Stage
Your body is constantly interacting with its surroundings.
8. Illness & Immune Response: The Internal Battle
This is where wearables transition from fitness tools to health guardians.
By viewing your daily scores through the lens of these eight factors, you move from “Why is my score low?” to the more actionable “Did my intense workout yesterday, late dinner, and stressful work call combine to create this lower readiness state?”
Data in a vacuum is meaningless. The transformative moment comes when you connect the dots between a life event and a physiological response. This is the practice of correlation, and it turns your ring into a personalized biofeedback lab.
Step 1: Maintain a Simple Lifestyle Log.
You don’t need a detailed journal. Just use the notes section in your wellness app or a simple calendar to jot down key events:
Step 2: Observe with a 24-48 Hour Lag.
Physiological impacts are often delayed. The effect of Tuesday’s hard workout and late night may not show up fully until Wednesday’s morning Readiness Score or Wednesday night’s sleep data. Don’t just compare today’s score to yesterday’s actions; look back two days.
Step 3: Look for Patterns, Not Perfect Matches.
After 2-4 weeks, review your log alongside your score charts. Ask questions:
These patterns are your personal user manual. They move you from generic advice (“get more sleep”) to personalized insight (“When I finish eating 3 hours before bed, my Deep sleep increases by 15%”). This process is the heart of building healthy habits with technology.
A Note on Confirmation Bias: It’s easy to see what you want to see. If you believe alcohol doesn’t affect you, you might ignore five data points that say otherwise and cling to the one night it didn’t. Let the preponderance of evidence guide you. The data is neutral.
This is the most critical concept in avoiding data anxiety. Your baseline is your normal. It is not a population average, your friend’s number, or an influencer’s target.
How Baselines are Established: Advanced algorithms, like those powering the Oxyzen ring, don’t just look at a 7-day average. They use longer-term data (often 30-60 days) to establish a dynamic range for each metric for you. This range accounts for your age, sex, fitness level, and natural cycles.
Why This Matters: A person with a naturally low HRV baseline of 30ms who sees a drop to 25ms is experiencing a 17% decrease—a significant stress signal. A person with a baseline of 80ms who drops to 75ms is experiencing a much smaller relative change. Comparing your 30ms to their 80ms is pointless and discouraging. Your scores are meaningful only in the context of your own history.
Red Flags vs. Normal Fluctuation: The system is designed to alert you to significant deviations from your personal baseline. A slight dip in your Sleep Score from 85 to 82 is normal fluctuation. A crash from 85 to 62, especially when correlated with a spike in RHR and drop in HRV, is a red flag worth investigating.
Your goal is not to hit an arbitrary number but to expand your healthy range. With improved fitness and stress management, your HRV baseline may slowly rise, and your RHR baseline may slowly fall. You become more resilient, able to handle larger stresses (like a hard workout) with a smaller physiological disturbance, and you recover back to baseline faster. This journey of understanding trends versus daily fluctuations is where long-term progress is measured.
Human physiology is cyclical. Ignoring these inherent rhythms is a major source of confusion when interpreting daily data.
The Menstrual Cycle: A Masterclass in Fluctuation
For individuals who menstruate, the cycle is a powerful 28-35 day hormonal wave that directly governs core metrics.
Seeing your RHR climb for two weeks straight could be alarming if you don’t recognize it as a normal luteal phase response. Tracking your cycle alongside your ring data provides profound insights into your unique pattern, allowing you to sync training, nutrition, and recovery expectations with your biology. This is a key aspect of how wearable wellness changes through life stages.
Aging: The Gradual Shift
Baselines naturally change over decades. Average RHR may increase slightly, and HRV tends to gradually decrease. Recovery from stress may take longer. This isn’t “worse” data; it’s different data. It means the interpretation of what constitutes a “good” recovery or an appropriate training load must evolve. Wearables provide the objective feedback to adapt your lifestyle gracefully as you age, supporting a principled approach to longevity.
Our instinct is to fight a low score—to push through, to prove the ring wrong. This is the opposite of its purpose. A low Readiness or Recovery Score is not a failure; it’s actionable intelligence. It’s your body, via the ring, asking for a different approach.
The “Green Light” Score (High Readiness):
This is a signal of high adaptive capacity. It’s a day to confidently tackle that intense workout, take on a big project, or be socially active. Your system is primed to handle stress and grow from it.
The “Yellow Light” Score (Moderate Readiness):
Proceed with caution. Maybe choose a moderate workout instead of a max-effort one. Focus on clean nutrition, hydration, and stress management. It’s a day for maintenance, not breakthroughs.
The “Red Light” Score (Low Readiness):
This is the gift. This score is telling you, unequivocally, that your resources are low. The most powerful thing you can do is obey it.
By honoring a low score, you might avoid a minor illness, a nagging injury, or a state of burnout. You convert a potential week of poor health into a single “recharge” day. This builds resilience. The ring that helps you push is useful; the ring that teaches you when not to push is invaluable. This philosophy is central to effective recovery and rest day strategies.
The very tool designed to reduce stress can become a source of it. “Orthosomnia” – a preoccupation with achieving perfect sleep data – is a real phenomenon. Checking your scores constantly, feeling anxiety if you forget to wear the ring, or basing your entire self-worth on a daily number are signs you’ve lost the plot.
Healthy Data Hygiene Practices:
Cultivating this balanced relationship is key to avoiding data overwhelm and ensuring technology serves you, not the other way around.
True insight rarely comes from a single number. It emerges from the interaction between metrics. Learning to read these combinations is like learning to read chords instead of single notes.
Classic Stress Signature:
Poor Recovery Night:
Circadian Disruption:
Fitness Adaptation (Positive Stress):
By learning these “chords,” you move from seeing disjointed numbers to diagnosing states. This is the advanced skill of getting the most from your device.
Let’s synthesize everything into a practical, 5-minute morning routine that transforms data into decisive action.
Step 1: The Holistic Scan.
Open your app. Before fixating on a single score, take in the entire dashboard. Note the primary scores (Readiness, Sleep) and the underlying metrics (HRV, RHR, Temp, Respiratory Rate). Are they telling a coherent story?
Step 2: The “Why” Hunt.
Based on what you see, recall the last 48 hours. Did you train hard? Drink alcohol? Stay up late worrying? Have a big deadline? Eat late? Feel a tickle in your throat? This is where your lifestyle log is invaluable.
Step 3: The Decision Matrix.
Step 4: The One Adjustment.
Based on your decision, choose one actionable adjustment for the day. It could be:
This framework turns passive observation into empowered action. It closes the loop between measurement and meaning, which is the ultimate goal of any principles to improve daily life through technology.
If daily scores are the weather—changeable, sometimes stormy, sometimes clear—then long-term trends are the climate. The real transformative power of continuous wearables isn't in managing today's "rain," but in understanding the seasonal shifts that make rain more or less likely. This is the move from micro to macro, from symptom to system.
Identifying Your Personal Health Seasons:
Over months and years, your data will reveal patterns invisible on a daily scale.
The 90-Day Review: Your Quarterly Health Audit.
Set a calendar reminder every three months. In this review, ignore the daily spikes and dips. Use trend-view features in your app to answer these questions:
This long-view analysis is the essence of tracking long-term health trends. It turns anecdotes ("I feel better") into evidence ("My 90-day HRV average has increased by 12%, confirming my resilience is improving"). It provides the motivation for sustained change that daily fluctuations can sometimes obscure.
To trust the story, you must understand the storyteller. The Oxyzen ring, and devices like it, are feats of miniaturized engineering, but they are not medical-grade diagnostic tools. Knowing what they excel at and where they have limitations is crucial for sensible interpretation.
How PPG (Photoplethysmography) Works:
The primary sensor is a tiny LED light that shines into the capillaries of your finger. A photodetector measures the amount of light reflected back. With each heartbeat, blood volume in the capillaries pulses slightly, changing the light absorption. This data is used to calculate heart rate, and through sophisticated algorithms, derive HRV (specifically, rMSSD and SDNN metrics).
Strengths of the Form Factor (Ring vs. Watch):
Important Limitations & Context:
Understanding this helps set realistic health expectations. The goal isn't diagnostic perfection; it's the acquisition of a reliable, personalized feedback loop that reveals patterns and correlations you would otherwise miss. For a deeper dive into the underlying science, explore our resource on the science behind wearable technology.

Your wellness app is a powerful island of information. But its true potential is unlocked when you build bridges to the other pillars of your health ecosystem. Data in isolation has limited value; data in conversation creates wisdom.
Informing Your Conversations with Healthcare Providers:
This is a paradigm shift from "I feel tired" to "Over the past three months, my nocturnal resting heart rate has averaged 8 bpm higher than my baseline, and my HRV trend shows a sustained drop, correlating with the onset of my fatigue." This objective data can:
Learn how to prepare for these empowered patient-doctor conversations with your data in hand.
Syncing with Your Fitness and Nutrition Ecosystem:
Most wellness platforms allow for integrations. Syncing your ring data with apps like Apple Health, Google Fit, Strava, or MyFitnessPal creates a unified dashboard.
This integrated approach moves you from scattered data points to a unified theory of your personal health. For a guide on navigating these connections, see our article on third-party integrations.
We are on the cusp of moving from descriptive analytics ("This is what happened") to predictive and even prescriptive analytics ("This is what's likely to happen, and here's what you might do about it"). The future of devices like the Oxyzen ring lies in smarter interpretation of the very fluctuations we've been learning to decode.
From Tracking to Forecasting:
Advanced machine learning models, trained on vast anonymized datasets, will begin to identify your unique precursors to common outcomes.
Hyper-Personalized Nudges:
Generic health advice ("get 8 hours of sleep") will be replaced by micro-suggestions based on your real-time physiology.
This evolution represents the ultimate maturation of the technology—from a mirror that shows your present state to a coach that helps you navigate your future. To glimpse where this is headed, explore thoughts on how smart ring features will evolve.
Even with all this knowledge, you'll encounter head-scratchers. A day you felt awful but scores high, or a night of seemingly perfect sleep that yields a poor score. Here’s how to troubleshoot.
Common Scenarios and Explanations:
For a more comprehensive list of solutions, our guide to troubleshooting common issues is an invaluable resource. And remember, comprehensive customer support and resources are always available for persistent technical problems.
The final, and perhaps most important, piece of the puzzle is your mindset. Technology is a tool, and like any tool, its effect depends on the hand that wields it. Cultivating the right psychological approach is what separates a rewarding, enlightening practice from an anxiety-inducing chore.
Embrace Non-Judgmental Curiosity.
Adopt the stance of a friendly scientist studying a fascinating subject: you. When a score is low, instead of thinking "I failed," ask, "What is this data point trying to teach me about my body's current needs?" This reframes the experience from one of performance evaluation to one of discovery and self-care.
Focus on Control, Not the Number.
You cannot directly control your HRV. It is an output. You can control the inputs: your bedtime, your workout intensity, your hydration, your meditation practice. Shift your daily goals from "I want an 85 Readiness Score" to "I will be in bed by 10:30 PM to support my recovery." This puts agency back in your hands and makes the score a feedback mechanism on your actions, not a judgment of your worth.
Celebrate the Response, Not Just the Result.
Did you get a low score, honor it with a rest day, and wake up the next day feeling fantastic? That's a huge win! The victory isn't in the high score alone; it's in the intelligent, responsive behavior the data enabled. This builds body trust and reinforces a sustainable, healthy relationship with the technology.
This balanced approach is key to ensuring wearable wellness motivates long-term behavior change rather than short-term obsession. It aligns with the core psychology of health data, which emphasizes empowerment over punishment.
Theory is essential, but stories make it stick. Let's look at three anonymized, composite examples of how individuals learned to listen to their fluctuating data.
Case Study 1: The Overtrained Executive
Case Study 2: The New Mother Navigating Hormonal Shifts
Case Study 3: The Professional Diagnosed with an Autoimmune Condition
These stories illustrate that the value isn't in avoiding fluctuations, but in developing the literacy to understand their unique language in the context of your own life.
Knowledge is only power when applied. Here is your actionable, step-by-step plan to move from reader to practitioner.
Week 1-2: The Observation Phase
Week 3-4: The Correlation Phase
Month 2 & Beyond: The Mastery Phase
This gradual, evidence-based approach prevents overwhelm and leads to lasting, personalized insights. It is the practical path to sustainable health habits.
One of the most common—and potentially detrimental—features of modern wellness apps is the community dashboard or benchmark. Seeing that your Sleep Score of 78 is "in the top 40%" of users your age can trigger pride or anxiety. But what does this comparison truly mean, and is it helpful?
The Illusion of the Average:
Population averages (like "average HRV for a 40-year-old male") are statistical aggregates. They smooth out the immense diversity of human biology, genetics, lifestyle, and even the type of device worn. Your unique baseline is your truth. A person with a lifelong, naturally low HRV who functions optimally at 30ms is not "unhealthy" compared to the 70ms average; they are simply on a different curve.
When Benchmarks Can Be Useful:
Community data has value only when used as a very broad, non-prescriptive reference point, not a target.
The Ethical Use of Your Own Data as a Benchmark:
The most powerful benchmark you have is your past self. Use the app’s trend features to compare your current month to your previous month or to the same month last year. This controls for seasonal and life-stage variables. This self-referenced analysis is the core of meaningful progress and aligns with the principle of focusing on long-term health trends over daily leaderboards.
Ultimately, the goal is to use community data as a map legend—for general orientation—while using your personal trend data as the detailed path you are actually walking. Disengaging from comparison is a profound step in avoiding one of the most common mistakes in wearable wellness.
We've covered how lifestyle drives daily changes. But beneath that layer lies a foundational one: your genetic and constitutive makeup. This is the "hardware" your lifestyle "software" runs on, and it sets the boundaries and tendencies of your fluctuations.
The Genetic Set Point:
Research indicates that a significant portion of HRV, basal metabolic rate, and circadian chronotype (being a "morning lark" or "night owl") is heritable. You may have a genetic predisposition toward a higher or lower HRV baseline, or a body temperature rhythm that runs slightly longer or shorter than 24 hours. This means:
Sex-Based Biological Differences:
Biological sex influences normative ranges and fluctuation patterns profoundly.
Understanding this constitutive layer helps you separate the signal of daily life from the background of your unique biology. It encourages self-compassion and realistic goal-setting, which is fundamental to setting realistic health expectations.

For individuals managing chronic conditions (e.g., autoimmune diseases, diabetes, cardiovascular issues, anxiety disorders), the interpretation of daily fluctuations requires an additional, careful layer of context. The ring doesn't diagnose, but it can provide unparalleled contextual awareness.
The Condition as a Constant Variable:
When you have a chronic condition, it becomes a constant input into your physiological system. Your "normal" baseline and range of fluctuation will be defined in part by the condition itself.
Identifying Triggers and Tracking Interventions:
This is where the correlation practice becomes a powerful management tool.
A Crucial Caveat:
It is vital to partner with your healthcare provider when using wearable data to manage a condition. Do not adjust medication or treatment plans based on ring data alone. Instead, use the data to enrich the conversation: "Doctor, I started this new anti-inflammatory protocol, and over the last month, my average sleeping heart rate has dropped by 4 bpm and my HRV trend is improving. What are your thoughts?" This is the model for how wearables empower patient-doctor conversations.
While we champion the benefits, a balanced view requires acknowledging that for some individuals, constant self-quantification can cross into harmful territory. Recognizing the signs is part of responsible use.
Orthosomnia: The Quest for Perfect Sleep Data.
Coined by sleep researchers, this refers to an unhealthy preoccupation with achieving perfect sleep scores, leading to increased anxiety about sleep—which ironically worsens sleep. Signs include:
Exercise Addiction and Overtraining Syndrome (OTS):
For those predisposed, the gamification of recovery scores can fuel unhealthy behaviors.
Data-Induced Anxiety and Hypochondria:
The constant stream of physiological data can, for some, become a source of health anxiety.
Mitigation Strategies:
As we invite these devices into the most intimate aspects of our lives—recording our sleep, heart rhythms, and temperature—we must consciously address the ethical and practical questions of data stewardship. Your physiological data is uniquely personal; protecting it is paramount.
What Data is Collected and How Is It Used?
Reputable companies like Oxyzen are transparent about their data policies. Key questions to understand:
Your Rights and Controls:
You should have clear controls within the app:
Long-Term Considerations:
Being proactive about data privacy ensures that your journey of self-discovery remains empowering and secure, protecting the very personal story your fluctuations tell.
The Oxyzen ring is a powerful tool, but it exists within a broader ecosystem of health technology. Understanding its strengths relative to other devices helps you build a holistic, multi-dimensional picture of your health.
Smart Rings vs. Smartwatches: A Synergistic Duo, Not a Competition.
Integration with Medical-Grade Devices:
For those with specific health concerns, consumer wearables can be paired with periodic use of medical devices.
Building this connected ecosystem allows you to move from isolated data points to a convergent, high-fidelity picture of your health, a concept central to navigating app ecosystems and integrations.
The field of wearable physiology and biofeedback is rapidly evolving. Staying informed helps you get the most from your device and interpret new features and metrics as they become available.
Foundational Knowledge Platforms:
Community Knowledge with a Critical Eye:
Online forums and social media groups can be valuable for troubleshooting and sharing experiences. However, apply critical thinking:
Committing to ongoing learning transforms you from a passive user to an active participant in the wearable wellness revolution, ensuring you get the most from your device over its entire lifecycle.
As we look to a future where these devices play a larger role in personal and even public health, we must confront and mitigate potential biases. The algorithms interpreting our data are only as good as the datasets they are trained on.
The Diversity Gap in Health Data:
Historically, much physiological and medical research has been conducted on homogeneous populations (often male, of European descent). If wearable algorithms are primarily trained on such data, they may be less accurate or provide less meaningful benchmarks for:
Advocating for Inclusive Wellness:
As a consumer, you can support companies that:
By supporting ethical, inclusive design, we help ensure that the benefits of wearable wellness—and the ability to understand our unique fluctuations—are accessible and accurate for all. This aligns with a vision where technology supports preventive healthcare for entire populations, not just a privileged few.
We began with a moment of confusion—a disappointing score where one wasn't expected. We end with a reframe: that fluctuation is not noise; it is the signal. It is the rich, dynamic language of a living system communicating its ever-changing state.
Your smart ring is not a judge keeping score of your life. It is a translator. It takes the silent whispers of your autonomic nervous system, the subtle rhythms of your heart, and the quiet cycles of your temperature, and gives them a voice you can understand. A low score is that voice saying, "I need support." A high score is it saying, "I am ready." The daily variation is the conversation.
By embracing this perspective, you graduate from a passive consumer of data to an active participant in your own well-being. You learn to dance with your rhythms, not fight them. You move from seeking a static, perfect state to cultivating a resilient, adaptive system that can thrive amidst life's inevitable stresses and joys.
The journey of making sense of your numbers is, ultimately, the journey of making sense of yourself. It is a continuous, compassionate dialogue between you and your biology, facilitated by remarkable technology. It is about becoming the expert on the one body and mind you will have for life. So, the next time you see a score that gives you pause, smile. The conversation has just gotten interesting. You now have the tools to listen and respond.
Your Trusted Sleep Advocate: Sleep Foundation — https://www.sleepfoundation.org
Discover a digital archive of scholarly articles: NIH — https://www.ncbi.nlm.nih.gov/
39 million citations for biomedical literature :PubMed — https://pubmed.ncbi.nlm.nih.gov/
Experts at Harvard Health Publishing covering a variety of health topics — https://www.health.harvard.edu/blog/
Every life deserves world class care :Cleveland Clinic - https://my.clevelandclinic.org/health
Wearable technology and the future of predictive health monitoring :MIT Technology Review — https://www.technologyreview.com/
Dedicated to the well-being of all people and guided by science :World Health Organization — https://www.who.int/news-room/
Psychological science and knowledge to benefit society and improve lives. :APA — https://www.apa.org/monitor/
Cutting-edge insights on human longevity and peak performance:
Lifespan Research — https://www.lifespan.io/
Global authority on exercise physiology, sports performance, and human recovery:
American College of Sports Medicine — https://www.acsm.org/
Neuroscience-driven guidance for better focus, sleep, and mental clarity:
Stanford Human Performance Lab — https://humanperformance.stanford.edu/
Evidence-based psychology and mind–body wellness resources:
Mayo Clinic — https://www.mayoclinic.org/healthy-lifestyle/
Data-backed research on emotional wellbeing, stress biology, and resilience:
American Institute of Stress — https://www.stress.org/

