The Beginner-Friendly Guide to Health Data Frequency: How Often Your Ring Measures
A beginner's guide to how often your ring takes measurements.
A beginner's guide to how often your ring takes measurements.
You slip a smart ring onto your finger. It’s sleek, comfortable, and promises a window into your health you’ve never had before. Within days, it’s telling you about your sleep, your stress, your readiness for the day. But a quiet question might form in the back of your mind: How often is it actually checking all this?
Is it taking a snapshot once an hour? Is it listening constantly? The answer is not only more fascinating than you might think, but it’s also the very key to unlocking the true power of this device on your finger. Understanding the “when” and “how often” of your ring’s measurements transforms it from a mysterious black box into a trusted, insightful partner in your wellness journey.
This isn’t just about ticking data points. It’s about the rhythm of your biology. Your body doesn’t operate on a convenient 9-to-5 schedule or a tidy 60-minute loop. It has its own cadences—ultradian rhythms that cycle every few hours, circadian rhythms that ebb and flow with the sun, and infradian rhythms that unfold over weeks or months. The most advanced smart rings are designed to move to these rhythms, sampling data at frequencies that capture the full, nuanced story of your health.
In this comprehensive guide, we will demystify the measurement frequencies of your smart ring. We’ll move beyond the marketing buzzwords and delve into what’s happening at the sensor level, why it matters for accuracy, and how different sampling rates paint different pictures of your well-being. From the constant, gentle pulse of heart rate monitoring to the nightly deep dive into sleep architecture, and from the spot-check of body temperature to the continuous calculation of your movement—we’ll cover it all.
By the end, you’ll not only know how often your ring measures but you’ll understand why that frequency is chosen, how to interpret the data it produces, and how to leverage this relentless, silent monitoring to make tangible, positive changes in your life. This is the foundational knowledge that turns raw data into actionable wisdom. Welcome to the beginner-friendly guide to health data frequency.
Before we dive into specific metrics like heart rate or sleep, we must first grasp the two fundamental modes of operation for your smart ring: continuous measurement and periodic (or spot) measurement. This distinction is the cornerstone of all wearable data collection and understanding it is crucial for setting realistic expectations.
Continuous measurement is exactly what it sounds like: an unbroken stream of data. The sensor is actively collecting information at a very high frequency—often multiple times per second. Think of it like a security camera recording footage 24/7. This mode is essential for capturing transient events, precise trends, and the full context of your physiological state. The primary example is photoplethysmography (PPG), the optical sensor that reads blood flow for heart rate and related metrics. For much of the day and night, a quality smart ring is in a continuous, low-power monitoring state, taking PPG readings every few seconds to build a seamless timeline of your cardiovascular activity.
However, “continuous” doesn’t always mean “max power, all sensors firing.” To preserve battery life—a significant advantage over smartwatches—the ring employs intelligent algorithms. It might use a lower sampling rate during periods of recognized rest (like when you’re sitting still) and automatically ramp up the frequency during detected activity or sleep.
Periodic or spot measurement, on the other hand, is like taking a snapshot. The sensor activates at defined intervals to take a single reading or a short burst of readings, then goes back to sleep. This is common for metrics that change slowly or where constant monitoring is less critical or too power-intensive. A prime example is skin temperature. While it fluctuates, it doesn’t do so in milliseconds like your heartbeat. Your ring might take a temperature reading every 5 or 10 minutes throughout the day and night. This is enough to establish a reliable baseline and detect meaningful deviations, such as the subtle rise that indicates the onset of illness or, for women, the shift associated with different menstrual cycle phases—a feature explored in our article on smart ring benefits for women's cycle tracking.
Why does this matter to you? The mode dictates the data’s resolution and use case.
The magic of a modern smart ring is its ability to seamlessly weave these two modes together. It uses continuous movement data (from the accelerometer) to contextualize the periodic readings. A temperature reading taken while you’re in a cold room is interpreted differently than one taken while you’re under blankets. This sensor fusion is what elevates the data from isolated numbers to a coherent health narrative, providing the kind of actionable health data that can inform daily decisions.
Of all the metrics, your heart’s rhythm is the workhorse of the smart ring. It is the most frequently measured and arguably the most informative signal for overall wellness. Let’s break down how your ring listens to your heartbeat and what it does with that information.
Heart Rate (HR) Monitoring Frequency:
Your ring’s green LED PPG sensor is nearly always at work. In its standard monitoring mode, it will take a heart rate reading every 2 to 10 seconds throughout the entire day and night. This creates a dense, continuous data set. During sleep or periods of profound rest, the interval might be at the longer end of that range to save battery. The moment the ring’s accelerometer detects motion indicative of activity—whether it’s a brisk walk or a workout—the sampling frequency dramatically increases, often to multiple readings per second. This ensures it captures the rapid fluctuations of exercise intensity and provides accurate metrics like workout heart rate zones and peak heart rate.
Heart Rate Variability (HRV) Monitoring Frequency:
HRV is a more nuanced metric. It measures the tiny, millisecond variations in the time interval between each heartbeat. A higher HRV generally indicates a more resilient nervous system and better recovery. Calculating HRV requires a clean, precise heartbeat signal.
The "Why" Behind the Frequency:
The heart doesn’t lie, but its story is told in milliseconds. Capturing heart rate continuously is non-negotiable for calculating accurate calories burned, detecting abnormal rhythms (like atrial fibrillation), and understanding sleep stages (where heart rate patterns are key). The high frequency during activity is what allows the ring to be a credible partner for fitness tracking, rivalling chest straps in many cases. This relentless, 24/7 health monitoring without bulk provides a cardiovascular diary that would be impossible to manually log.
Sleep is where your smart ring truly shines. Free from the constraints of a bulky watch, its comfort allows for uninterrupted sleep tracking night after night. But how does it know if you’re in light, deep, or REM sleep? It’s a masterclass in multi-sensor, high-frequency data fusion.
The Measurement Symphony of Sleep:
When you fall asleep, your ring enters a dedicated high-fidelity monitoring mode. It’s not using one signal but a chorus of them, sampled at different but coordinated frequencies:
The "Epoch" – The Unit of Sleep Analysis:
Sleep scientists don’t analyze sleep second-by-second. They use “epochs,” typically 30-second windows. Your ring’s algorithm does the same. Every 30 seconds, it takes all the data from the last half-minute—heart rate pattern, movement intensity, breath rate—and runs it through a validated machine learning model. This model, often based on clinical polysomnography studies, assigns a sleep stage (Wake, Light, Deep, REM) to that 30-second epoch.
Frequency in Action: Spotting Disruptions:
This high-frequency, multi-data approach allows the ring to detect micro-events you’re unaware of. A 10-second spike in heart rate and a burst of movement might be logged as a brief arousal, even if you didn’t fully wake up. This granularity is what creates the rich sleep architecture graphs in your app and provides the true overnight advantage for understanding sleep quality beyond just total duration.
Body temperature is a slow, steady drumbeat compared to the staccato of heart rate. It’s a classic example of periodic measurement yielding profound insights over time.
Sampling Frequency:
Your ring does not measure core body temperature (that requires an internal sensor). It measures skin temperature at the finger. This is a useful proxy for tracking relative changes from your personal baseline. The ring will take a temperature reading at regular intervals, commonly every 5 to 10 minutes throughout the 24-hour cycle. It does this using a dedicated thermistor or infrared sensor.
The Power of the Baseline:
The raw temperature number (e.g., 33.5°C) is less important than its trend. Over the first week or two of wear, your ring’s algorithm builds a personalized baseline for you. It understands your typical temperature at 3 AM, at 10 AM, at 4 PM. It accounts for external factors it can detect, like increased movement (which raises skin temp) or being in a cold environment.
Once the baseline is established, the ring looks for meaningful deviations. A sustained elevation of 0.5°C to 1.0°C above your personal baseline for 6+ hours, especially overnight, is a strong physiological indicator of:
Why Not Continuous? Continuous temperature sampling would generate massive amounts of data with minimal additional insight, while drastically draining the battery. The slow, periodic sampling is perfectly tuned to the slow-changing nature of this metabolic signal.
If the heart rate sensor is the storyteller, the accelerometer is the stage manager, providing essential context. It answers the fundamental question: What is my body doing right now? This data is collected continuously at a very high frequency, often 25-50 times per second (25-50 Hz).
How Frequency Creates Meaning:
This high-frequency sampling allows the ring to not just detect that you moved, but how you moved. The precise pattern of acceleration forces lets the algorithm distinguish between:
From Raw Data to Activity Metrics:
The raw accelerometer data is processed in real-time to generate the metrics you see:
This constant context is what makes the ring’s data intelligent. It knows a heart rate spike during a run is normal, but the same spike while you’re sitting on the couch is a sign of stress. This fusion is a key part of the accuracy advantage that defines the best wearable tech.
Your breathing rate is a vital sign that has gained prominence, especially for its role in assessing overall wellness and stress. Unlike a chest strap that measures chest expansion, your ring deduces respiratory rate indirectly but effectively.
Measurement Method and Frequency:
Every time your heart beats, it pushes a pulse of blood through your capillaries. With each breath you take, the pressure in your chest changes slightly, which has a tiny, rhythmic effect on how quickly that blood pulse reaches your finger. This is called Respiratory Sinus Arrhythmia—a natural, healthy phenomenon where your heart rate speeds up slightly on the inhale and slows on the exhale.
Your ring’s algorithm scans the continuous, high-frequency heart rate data and looks for this periodic modulation. It extracts the breathing signal and calculates your respiratory rate in breaths per minute. This calculation is typically performed once per minute or averaged over longer periods (like 5-minute windows during the day, and per sleep stage at night).
Practical Insights from Breathing Data:
The beauty of this measurement is its passivity. You don’t need to think about breathing into a device; the ring simply observes the natural byproduct of your life processes, exemplifying the principle of passive tracking that works better than active logging.
“How many calories did I burn?” It’s a universal question. Your smart ring’s answer is one of its most sophisticated calculations, a direct result of merging high-frequency data streams.
It’s Not a Guess; It’s a Calculation:
Your ring does not have a “calorie sensor.” Instead, it calculates your Total Daily Energy Expenditure (TDEE) by combining:
Frequency and Fidelity:
Because heart rate is sampled continuously, your calorie burn estimate is updating in near real-time. Every few seconds, the algorithm takes the latest heart rate, contextualizes it with the simultaneous accelerometer data (is this heart rate from walking or from stress?), and adds a tiny increment to your rolling calorie burn total.
This method, while not medically precise, is far superior to step-based estimates from older trackers. A step counter cannot differentiate between a leisurely stroll and a heart-pounding sprint—but your heart rate can. This fusion of data is a prime example of how continuous tracking beats periodic check-ups, providing a dynamic and personalized picture of your energy output throughout the entire day.

This is where raw data becomes insight. Metrics like “Recovery Score,” “Readiness,” or “Stress Score” are not directly measured by a single sensor. They are high-level algorithmic interpretations synthesized from the buffet of data we’ve just covered.
How Often is a "Score" Generated?
These scores are typically calculated once per day, most often in the morning after you wake up and sync your ring. The algorithm performs a holistic review of the past night and the previous day:
The algorithm weighs these factors, compares them to your personal baselines, and outputs a single score or set of scores. This is your body’s “press briefing” for the day.
The Frequency of Underlying Data Matters:
The accuracy of this readiness score is entirely dependent on the frequency and quality of the underlying measurements. A robust HRV reading requires clean, continuous nighttime heart rate data. An accurate assessment of sleep restoration requires high-frequency movement and heart rate sampling to correctly classify sleep stages. A meaningful temperature reading requires regular spot measurements to know if you’ve deviated from your norm.
This single, daily score is the culmination of hundreds of thousands of individual sensor readings taken over the previous 24 hours. It’s designed to answer the ultimate question: Is my body prepared for strain today, or does it need more rest? This empowers you to personalize your training, manage stress, and avoid burnout, a benefit that can profoundly improve work performance and productivity for knowledge workers and athletes alike.
You might wonder: if the ring is measuring all this stuff so often, how does it last a week on a single charge? The answer is a masterpiece of intelligent power management and strategic measurement scheduling. Battery life isn’t a passive feature; it’s an active design constraint that shapes how and when sensors are used.
The Power Hierarchy of Sensors:
Different sensors consume different amounts of energy.
Adaptive Sampling: The Ring’s Brain
Your ring isn’t stupid. It doesn’t use the high-power PPG at its maximum frequency 24/7. Instead, it uses the low-power accelerometer as a trigger.
This intelligent toggling is the secret. It’s why you get days of battery life while still receiving comprehensive data. The ring is designed to gather the richest data at the most meaningful times, not waste energy collecting redundant data when you’re stationary.
Let’s step back from individual sensors and watch a day unfold through the lens of your ring’s measurement strategy. This synthesis is where the true value emerges.
7:00 AM – Wake Up: You touch the ring to your charging dock. In the final hour of sleep, it was taking heart rate every 5 seconds, movement 32 times per second, and temperature every 10 minutes. It processes this data, calculates your sleep stages, and generates your Recovery Score. You sync, and see your “readiness” for the day.
9:00 AM – At Your Desk: You’re working. The accelerometer detects the faint, rapid vibrations of typing. The PPG is in low-power mode, sampling heart rate every 15 seconds, noting it’s at a resting level. Temperature takes a spot check. Your calorie burn ticks up slowly with your BMR.
12:30 PM – Lunchtime Walk: You get up and start walking. The accelerometer immediately recognizes the gait pattern. It signals the main processor: “Activity detected!” The PPG LED brightens and starts sampling 2 times per second. Your heart rate climbs from 65 to 110 BPM. The calorie calculation now adds larger increments with each data point.
3:00 PM – Stressful Meeting: You’re sitting still, but your heart rate, sampled every 10 seconds, shows a steady climb from 68 to 85 BPM. The accelerometer confirms you’re not moving. The algorithm notes this incongruence—elevated heart rate without activity—and may log it as a period of potential stress or cognitive load, offering insights into how to reduce stress and anxiety naturally.
10:30 PM – Falling Asleep: You’re in bed, reading. Movement becomes rare. The ring’s algorithm, noticing prolonged inactivity, dim lighting (if it has a light sensor), and your typical bedtime, begins to transition into sleep mode. PPG frequency stabilizes to its sleep rate.
2:00 AM – Deep in Sleep: All systems are in dedicated sleep configuration. A flawless dance of data collection is occurring, building the foundation for tomorrow’s insights.
This seamless, automatic shifting between measurement strategies creates a holistic timeline. You aren’t looking at disconnected charts of heart, movement, and temperature. You’re looking at an integrated story of your day—your exertions, your rest, your stresses, and your recovery. This is the profound benefit of a device that works while you work, sleep, and live.
Now that you understand the “how,” you can become an active partner with your device. Here’s how to apply this knowledge for better results:
Your smart ring is more than a piece of tech; it’s a biomonitoring platform on your finger. Its power lies not in any single reading, but in the relentless, intelligent frequency of its measurements—a silent, persistent inquiry into the state of your being. By understanding this rhythm, you graduate from a passive user to an informed participant in your own wellness journey. You learn the language your body speaks through data, and in doing so, gain an unparalleled tool for living a healthier, more balanced, and more intentional life.
The journey into understanding your smart ring’s measurement frequency is akin to learning a new language—the language of your own physiology. We've explored the technical cadence of each sensor, but now we must connect these rhythms to the lived experience of your body. The true magic lies not in the isolated data points, but in the patterns that emerge when millions of these points are woven together over time.
Your body is not a static machine; it’s a dynamic, adaptive system governed by biological clocks. The genius of continuous and periodic measurement is that it allows your ring to become a cartographer of your internal landscape, mapping these invisible rhythms with startling clarity. This section will explore how the specific frequencies we’ve discussed—the constant pulse, the nightly deep dive, the gentle temperature rhythm—combine to reveal the most profound insights about your health: your circadian alignment, your unique physiological responses, and your long-term trends.
A single heart rate reading of 72 BPM tells you almost nothing. A heart rate reading taken every 10 seconds for 24 hours, however, tells an epic story. It shows your morning rise, your post-lunch dip, your afternoon focus, your evening wind-down, and the deep, restorative troughs of your sleep cycles. This is pattern recognition at its most powerful, and it’s only possible because of consistent, frequent measurement.
Building a Meaningful Baseline:
The first and most critical job of your ring is to learn you. Over the initial 1-2 weeks of continuous wear, it’s not just collecting data; it’s establishing your personalized baselines. It answers questions like:
These baselines are not population averages; they are your unique physiological fingerprint. A resting heart rate of 58 BPM might be normal for a trained athlete but a sign of bradycardia for someone else. Your ring learns your normal, which is why trends are infinitely more valuable than absolute numbers. This personalization is a core smart ring benefit for your unique biology.
Detecting Deviations and Anomalies:
Once your baseline is established, the ring’s algorithms switch to a detective mode. They are constantly looking for significant, sustained deviations. This is where the chosen frequencies prove their worth.
This pattern-based anomaly detection is the foundation of preventive insight. It shifts the focus from diagnosing problems to noticing early, subtle signs of imbalance, empowering the kind of proactive self-care that forms the basis of preventive healthcare.
The most fundamental pattern your ring maps is your circadian rhythm—your body’s internal, roughly 24-hour master clock that governs sleep-wake cycles, hormone release, body temperature, and metabolism. Disruption of this rhythm is linked to a host of issues, from poor sleep and low energy to increased risk for chronic diseases. Your smart ring provides an unprecedented, objective view of your circadian alignment.
How Frequencies Paint the Circadian Picture:
Different metrics, sampled at their optimal frequencies, contribute different brushstrokes to this portrait:
The Sleep-Wake Anchor:
Sleep is the most powerful synchronizer of your circadian clock. The ring’s high-frequency sleep analysis doesn’t just tell you how long you slept; it tells you when you slept and how consolidated that sleep was. Going to bed and waking up at consistent times strengthens your circadian rhythm. The ring can show you the tangible benefits of this consistency in your temperature rhythm and morning readiness scores, providing the validation for your wellness efforts.
By integrating these data streams, your ring can effectively answer: Is my lifestyle in sync with my biology? This feedback is a powerful tool for making gradual adjustments to sleep timing, light exposure, and meal times to optimize your energy and health—a key component of healthy aging and longevity.
While the circadian rhythm is the master 24-hour conductor, your body also dances to shorter tunes called ultradian rhythms. These are cycles that repeat multiple times within a 24-hour period. The most well-known is the Basic Rest-Activity Cycle (BRAC), a roughly 90-minute oscillation between higher and lower alertness that continues even during sleep (where it governs the cycling between sleep stages).
Capturing the Peaks and Troughs:
Your smart ring’s sensors, particularly the continuous heart rate monitor, are sensitive enough to hint at these ultradian patterns during the day.
The Practical Application: Working With Your Rhythms:
Understanding that your energy, focus, and creativity naturally ebb and flow in ~90-minute cycles can revolutionize your daily productivity. Instead of fighting through a mental fog with more coffee, you could interpret a dip in your data as a signal for a true break—a short walk, some deep breathing, or a period of non-demanding work.
This biological harmony, facilitated by your ring’s insights, can directly improve work performance and productivity by aligning tasks with your natural capacity. It encourages a rhythm of focused sprints followed by genuine recovery, a model far healthier than the constant grind.
Beyond daily and hourly cycles, our bodies also move to slower, longer rhythms known as infradian rhythms. For many, the most relevant is the menstrual cycle, a roughly 28-day hormonal symphony that influences nearly every system in the body. For others, seasonal changes in mood and energy (often related to light exposure) are significant.
Mapping the Monthly Cycle with Precision:
This is where the periodic temperature tracking of a smart ring becomes a game-changer. Basal body temperature (BBT) tracking has long been used to pinpoint ovulation, but it required manual, first-thing-in-the-morning measurement with a precise thermometer. A smart ring automates this perfectly.
Seasonal and Long-Term Trends:
Worn over months and years, your ring’s data becomes a longitudinal health journal. You can observe:

One of the most immediate and actionable patterns your ring reveals is the dynamic interplay between stress (sympathetic nervous system activation) and recovery (parasympathetic nervous system dominance). This isn’t a daily summary; it’s a real-time, moment-to-moment feedback loop made visible by high-frequency data.
Seeing the Signature of Stress:
When you experience stress—be it a difficult conversation, a looming deadline, or intense exercise—your body initiates a cascade of physiological changes. Your ring detects the signature:
The Equally Important Recovery Signature:
Once the stressor passes, a healthy body should efficiently down-regulate. Recovery is not the absence of stress; it’s the active process of returning to balance. Your ring measures this too:
Using the Loop for Self-Regulation:
This real-time visibility is transformative. Instead of vaguely feeling "stressed," you can see the physiological correlate. This awareness alone can be calming. You can then experiment with interventions:
This creates a powerful biofeedback mechanism, helping you reduce stress and anxiety naturally by connecting actions to tangible physiological outcomes.
For anyone engaged in fitness, the story isn’t told in a single workout. It’s told in the pattern of strain and supercompensation over weeks and months. Your smart ring, through its constant monitoring, shifts the focus from output (how hard you trained) to outcome (how well you recovered and adapted).
The Three-Phase Pattern of Effective Training:
The Danger of Non-Recovery:
Without this data, it’s easy to skip phase 3 and impose another strain while still fatigued. This leads to a downward spiral of under-recovery, stagnating progress, and increasing injury risk. Your ring’s daily readiness score is essentially a traffic light for this cycle: Green (recovered, train hard), Yellow (proceed with caution), Red (need rest). This guidance transforms training from guesswork to a science, providing the kind of recovery insights that transform training for serious athletes and casual exercisers alike.
We touched on sleep staging earlier, but the pattern between stages—your sleep architecture—is where the true quality of rest is determined. A healthy sleep pattern isn’t random; it’s a structured progression of cycles, each about 90 minutes long, containing proportions of Light, Deep, and REM sleep.
How Frequency Reveals Architecture:
The ring’s 30-epoch analysis doesn’t just label sleep; it sequences it. A good app will show you a histogram of your night, revealing:
Interpreting the Pattern for Better Sleep:
By observing these patterns, you can experiment with lifestyle changes to improve your architecture. Perhaps dimming lights earlier promotes faster sleep onset, or avoiding late meals reduces nighttime awakenings. This detailed feedback is central to the ring’s ability to help you sleep better tonight and every night.
Perhaps the most important pattern your ring reveals is the one that makes you, you. Beyond circadian rhythms and stress responses, we all have unique physiological quirks and signatures.
Identifying Your Personal Triggers:
With consistent wear, you can start to play detective using your data log.
This process of linking subjective experience to objective data is empowering. It moves you from generic health advice to a personalized wellness protocol. You learn what truly works for your body, fostering a deeper sense of data ownership and self-efficacy.
Wellness is often a shared journey. The patterns revealed by smart rings can extend beyond the individual to create shared understanding and accountability.
Couples and Family Wellness:
When partners wear rings, they can observe how their rhythms interact. They might see their sleep quality improve when they go to bed together, or notice how shared stress (like a family event) impacts both their recoveries. This shared data can foster empathy and motivate healthier shared habits, turning wellness into a team sport—a unique benefit for couples tracking together.
Community and Benchmarking (Anonymized):
Some platforms allow for voluntary, anonymous aggregation of data to show how a user compares to similar demographics (e.g., "Your HRV is in the top 20% for women your age"). While individual patterns are paramount, this context can be motivating and provide a general frame of reference for what’s "normal."
A device that measures you constantly raises valid questions about data privacy and security. The pattern of data collection must be matched by a robust pattern of data protection.
What to Look For in Your Ring's Ecosystem:
Choosing a ring from a company that prioritizes protecting your privacy and data is a critical part of the purchase decision. The most insightful patterns are meaningless if they aren’t kept secure and under your control.
In this first portion of our guide, we have moved from the technical "how often" to the profoundly human "so what." We've seen that the specific measurement frequencies of your smart ring are not arbitrary; they are carefully tuned instruments in an orchestra dedicated to playing the symphony of your biology.
The constant pulse of the heart rate sensor, the vigilant hum of the accelerometer, and the patient tick of the temperature sensor work in concert to map your circadian, ultradian, and infradian rhythms. They reveal the dynamic dance between stress and recovery, chart the architecture of your sleep, and narrate the story of your fitness adaptations. Most importantly, they begin to sketch the unique, irreplaceable pattern that is you—your personal physiological signature.
This knowledge transforms the ring from a data collector into a true companion on your wellness journey. It provides the language to understand your body's whispers before they become shouts, offering a powerful tool for prevention, optimization, and self-discovery. In the next section, we will dive into the practical application of all this knowledge: how to choose a ring based on its measurement capabilities, how to interpret the data dashboards, and how to build a lifestyle that harmonizes with the profound patterns now visible to you for the first time
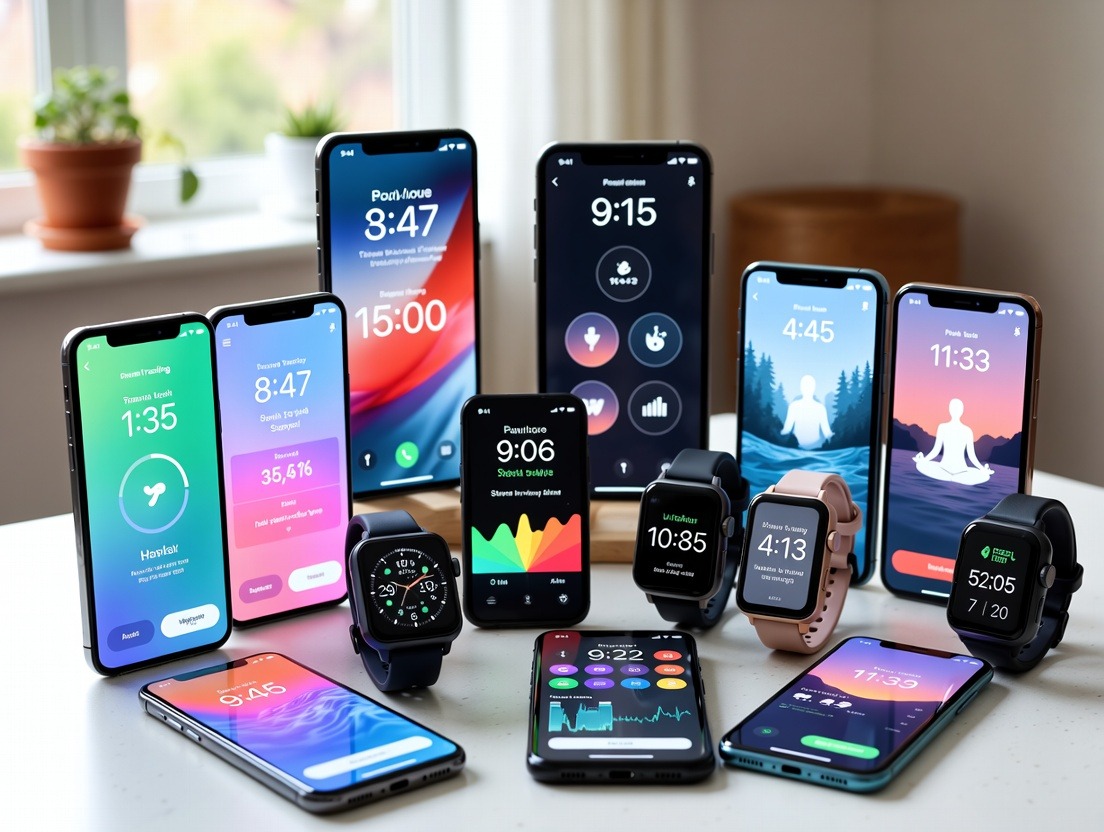
We’ve established how your smart ring measures and what profound patterns it reveals. Now, we arrive at the most critical juncture: the interface. This is where the torrent of raw sensor data—the billions of measurements taken at their specific frequencies—meets you, the user. It must be distilled, visualized, and presented in a way that is not just understandable, but genuinely useful. The dashboard of your companion app is the control room for your health. Decoding it is the final step in turning measurement frequency into meaningful, daily action.
This section will serve as your field guide to navigating the data landscape presented by your smart ring. We’ll explore common metrics, understand the visualizations built from different data streams, learn how to spot red flags and green lights, and ultimately, create a personal framework for integrating this continuous feedback loop into your life without becoming overwhelmed by it. The goal is not to become a data scientist, but to become a more informed, intuitive, and empowered steward of your own well-being.
While every smart ring app has its own design language, they all rely on similar foundational visualizations built from the underlying measurement frequencies. Understanding these common views is key.
1. The 24-Hour Timeline (The “What Happened?” View):
This is often the home screen’s central feature—a single, scrollable graph spanning midnight to midnight. It’s a masterful fusion of multiple data streams sampled at different rates.
What it tells you: This view provides immediate context. You can trace a stressful meeting (a sustained HR elevation over a motionless period), see the impact of your afternoon walk (a HR spike over an activity bar), and confirm your sleep window.
2. The Sleep Detail Page (The “How Did I Rest?” View):
Drilling into sleep reveals a more specialized dashboard.
What it tells you: Beyond just duration, it shows sleep quality. Seeing low deep sleep? Maybe you need more consistency. Seeing frequent awakenings? Perhaps caffeine timing or environmental factors are at play. This is the primary tool for improving your sleep quality.
3. The Readiness/Recovery Score & Its Components (The “What Should I Do Today?” View):
This is the app’s attempt to synthesize everything into a single, actionable number or set of numbers. It’s crucial to look under the hood of this score.
What it tells you: This is your daily directive. A low score driven by low HRV and high temperature suggests your body is fighting something; prioritize rest. A low score from high activity load but good sleep suggests you’re in a training groove but need mindful recovery. This guidance system epitomizes how a smart ring can make health data actionable.
4. The Weekly/Monthly Trend Views (The “What’s My Trajectory?” View):
Here, daily scores or specific metrics (avg. HRV, resting HR, sleep duration) are plotted on a line or bar graph over weeks or months.
With the dashboard mapped, let’s define what you’re looking for within each primary metric. Remember, “normal” is personal, but some general principles and red flags are universal.
1. Heart Rate Variability (HRV): The North Star of Recovery
2. Resting Heart Rate (RHR): The Metabolic Idle Speed
3. Body Temperature: The Slow, Steady Signal
4. Respiratory Rate: The Breath of Calm or Strain
The risk with any detailed data stream is analysis paralysis or obsession. The goal is informed intuition, not data slavery. Here’s how to build a sustainable practice.
1. Establish Your “Data Check” Ritual:
Choose a consistent, brief time to review your data—perhaps with your morning coffee. A 3-minute ritual is enough.
2. Embrace the “Trend is Your Friend” Mantra:
Print this out if you must. Do not make decisions based on a single day’s data. Always view metrics in the weekly or monthly trend view before becoming concerned or elated. This perspective is what delivers the long-term compound value of wearing the ring.
3. Log Life for Context:
Use the journal/note feature in your app. Log: “Big presentation today,” “Drank wine,” “Ate late,” “Felt amazing,” “Started new supplement.” In a few weeks, you can look back and see the objective physiological impact of these subjective events. This turns the ring into a personal science lab and is the fastest path to personalizing for your unique biology.
4. Set SMART Alerts, Not Noise Alerts:
Most apps allow you to set alerts. Use them sparingly and wisely.
This is paramount. Your smart ring is a consumer wellness device, not a medical diagnostic device.
The Powerful Way to Use Ring Data with a Doctor:
Your ring’s data becomes incredibly valuable in a clinical setting when used as a detailed log of symptoms and trends.
Red Flags That Warrant a Professional Conversation:
The ultimate goal of understanding measurement frequency and interpreting your dashboard is to foster a lasting, positive relationship with your health. This is a journey of decades, not days.
The Three Stages of a Smart Ring User:
Building a Legacy of Health Data:
Imagine having a decade-long record of your sleep, stress responses, and fitness adaptations. This isn’t just data; it’s a health autobiography. It can show how your body changed through life stages, how it responded to different challenges, and what truly worked to keep you vital. This long-term perspective is perhaps the most profound, yet understated, benefit of all.
We have now completed a full circuit: from the microscopic frequency of sensor sampling, to the macroscopic patterns of biological rhythms, and finally to the practical dashboard where you, the human, interact with this ocean of information.
The beginner-friendly guide is no longer just about “how often your ring measures.” It’s about how that relentless, intelligent measurement schedule grants you a new sense: the sense of informed intuition. You begin to feel a dip in energy and, instead of guessing, you can correlate it with a night of poor deep sleep. You feel stress building and can use your breath to literally steer your heart rate curve downward on the screen. You embark on a fitness journey and have objective, irrefutable proof of your heart and body getting stronger.
This is the promise of modern wearable technology, realized not through magic, but through the meticulous, frequent measurement of your life’s most vital signals. By understanding the rhythm of the measurement, you learn to dance to the rhythm of your own biology, leading to a life of greater balance, awareness, and vitality.
Your Trusted Sleep Advocate: Sleep Foundation — https://www.sleepfoundation.org
Discover a digital archive of scholarly articles: NIH — https://www.ncbi.nlm.nih.gov/
39 million citations for biomedical literature :PubMed — https://pubmed.ncbi.nlm.nih.gov/
Experts at Harvard Health Publishing covering a variety of health topics — https://www.health.harvard.edu/blog/
Every life deserves world class care :Cleveland Clinic - https://my.clevelandclinic.org/health
Wearable technology and the future of predictive health monitoring :MIT Technology Review — https://www.technologyreview.com/
Dedicated to the well-being of all people and guided by science :World Health Organization — https://www.who.int/news-room/
Psychological science and knowledge to benefit society and improve lives. :APA — https://www.apa.org/monitor/
Cutting-edge insights on human longevity and peak performance:
Lifespan Research — https://www.lifespan.io/
Global authority on exercise physiology, sports performance, and human recovery:
American College of Sports Medicine — https://www.acsm.org/
Neuroscience-driven guidance for better focus, sleep, and mental clarity:
Stanford Human Performance Lab — https://humanperformance.stanford.edu/
Evidence-based psychology and mind–body wellness resources:
Mayo Clinic — https://www.mayoclinic.org/healthy-lifestyle/
Data-backed research on emotional wellbeing, stress biology, and resilience:
American Institute of Stress — https://www.stress.org/

